How We Did IT
Hospital Using Epic Hyperspace Reduces Epic & Citrix XenApp Logon Times by 80%

“Without a doubt, there is no comparison between the level of detail found in Goliath Performance Monitor and other tools like Director, etc.”
Infrastructure
Citrix XenApp, Epic Hyperspace
Challenge
Citrix Architects Spend Too Much Time Troubleshooting Citrix Clinicians report slow logon times, IT pinpoints root cause and permanently fixes issue.
The below screen shots were provided by a large non-profit healthcare organization that uses Citrix XenApp to deliver Epic Hyperspace and other business and clinical applications to over 5,000 physicians, clinicians and healthcare workers. The Healthcare IT team received support tickets from various end users about slow logon times. This document describes how the Citrix engineer used Goliath Performance Monitor to pinpoint and troubleshoot the “Citrix is Slow” complaint and implement a fix action that permanently resolved the issue and reduced logon times for the impacted users by more than 80%.
Solution
Logon Duration Drill Down Identifies Root Cause
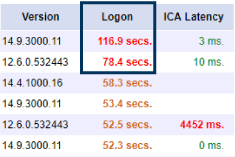
After receiving complaints about long Citrix XenApp logon times, the Citrix engineer used the session display to troubleshoot Citrix connection by sorting logon times. They then identified a session with a logon time of nearly two minutes (Figure 1)– much too long in a hospital setting where clinicians were often logging in to multiple machines as they provide patient care in 20-minute increments.
Figure 1: Using sort to quickly find sessions with high logon times.
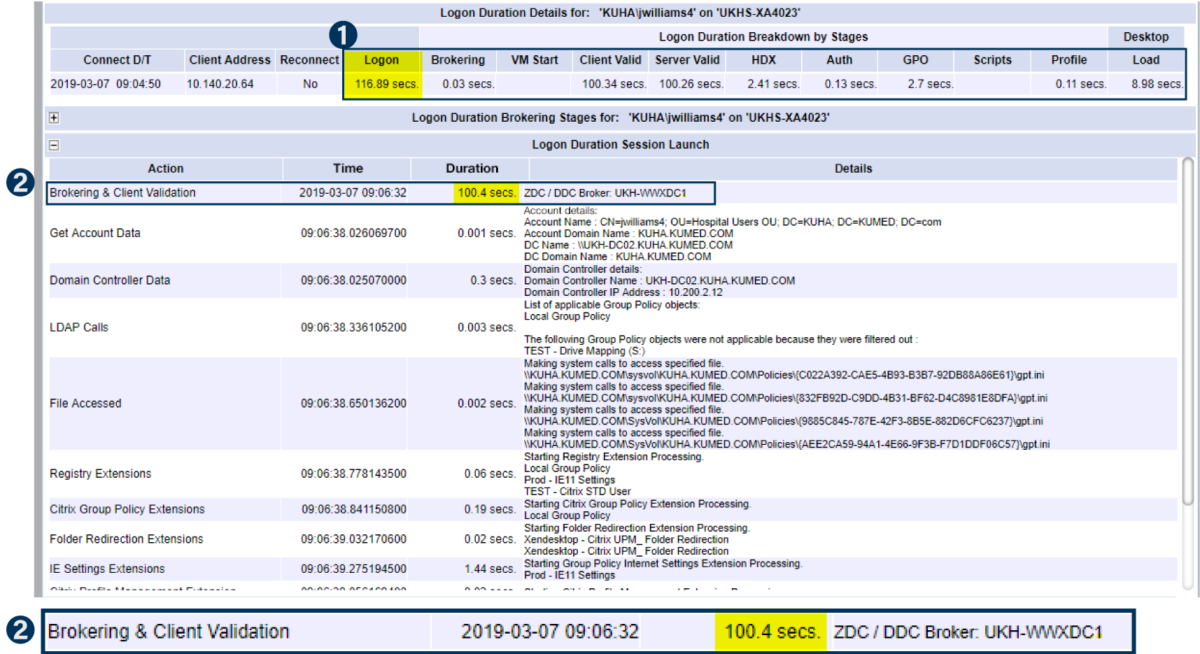
Unlike Citrix free utilities and other tools that only provide high level summary stage details for the logon process, the engineer was able to see the more than 33+ detailed stages provided by Goliath Performance Monitor – even though the Citrix session in question was more than a week old. This unique level of detail allowed him to quickly identify that 100.4 seconds, 86% of the total logon time was spent on the Client Validation stage (Figure 2).
Figure 2: The Logon Stage Details section of the Logon tab is unique to Goliath Performance Monitor. It presents a granular breakdown of the login process by combining all of the above metrics with information included in the Goliath logs. This approach saves time and testing efforts by highlighting specific details during the login process that an administrator would normally have to dig through logs and other areas to obtain.
In two clicks, the Citrix engineer was able to both confirm the issue and pinpoint root cause by identifying the exact Delivery Controllers involved in the client validation process. The specific detail provided – including the specific Citrix XenApp delivery controller involved, focused troubleshooting on the true root cause of the problem. The team realized this problem could be solved – and prevented in the future — by allocating more memory to the specific Citrix XenApp Delivery Controllers during the busy logon hours in the morning.
Results
The New Posture of Proactive Alerting Before End Users Are Impacted
After making this change, the system showed a reduction of logon times by over 80% during early morning shift hours when most of the Citrix logon traffic occurred. In addition, proactive alerts were set to trigger based on both logon time length as well as memory utilization for the Delivery Controllers involved. This means that if these thresholds are breached in the future, IT will receive an alert and take corrective action before users are impacted.
*Epic, Hyperspace, Hyperdrive, and System Pulse are trademarks of Epic Systems Corporation

