How to Report On Remote Worker Activity and Key Performance Indicators
End-User Productivity Report
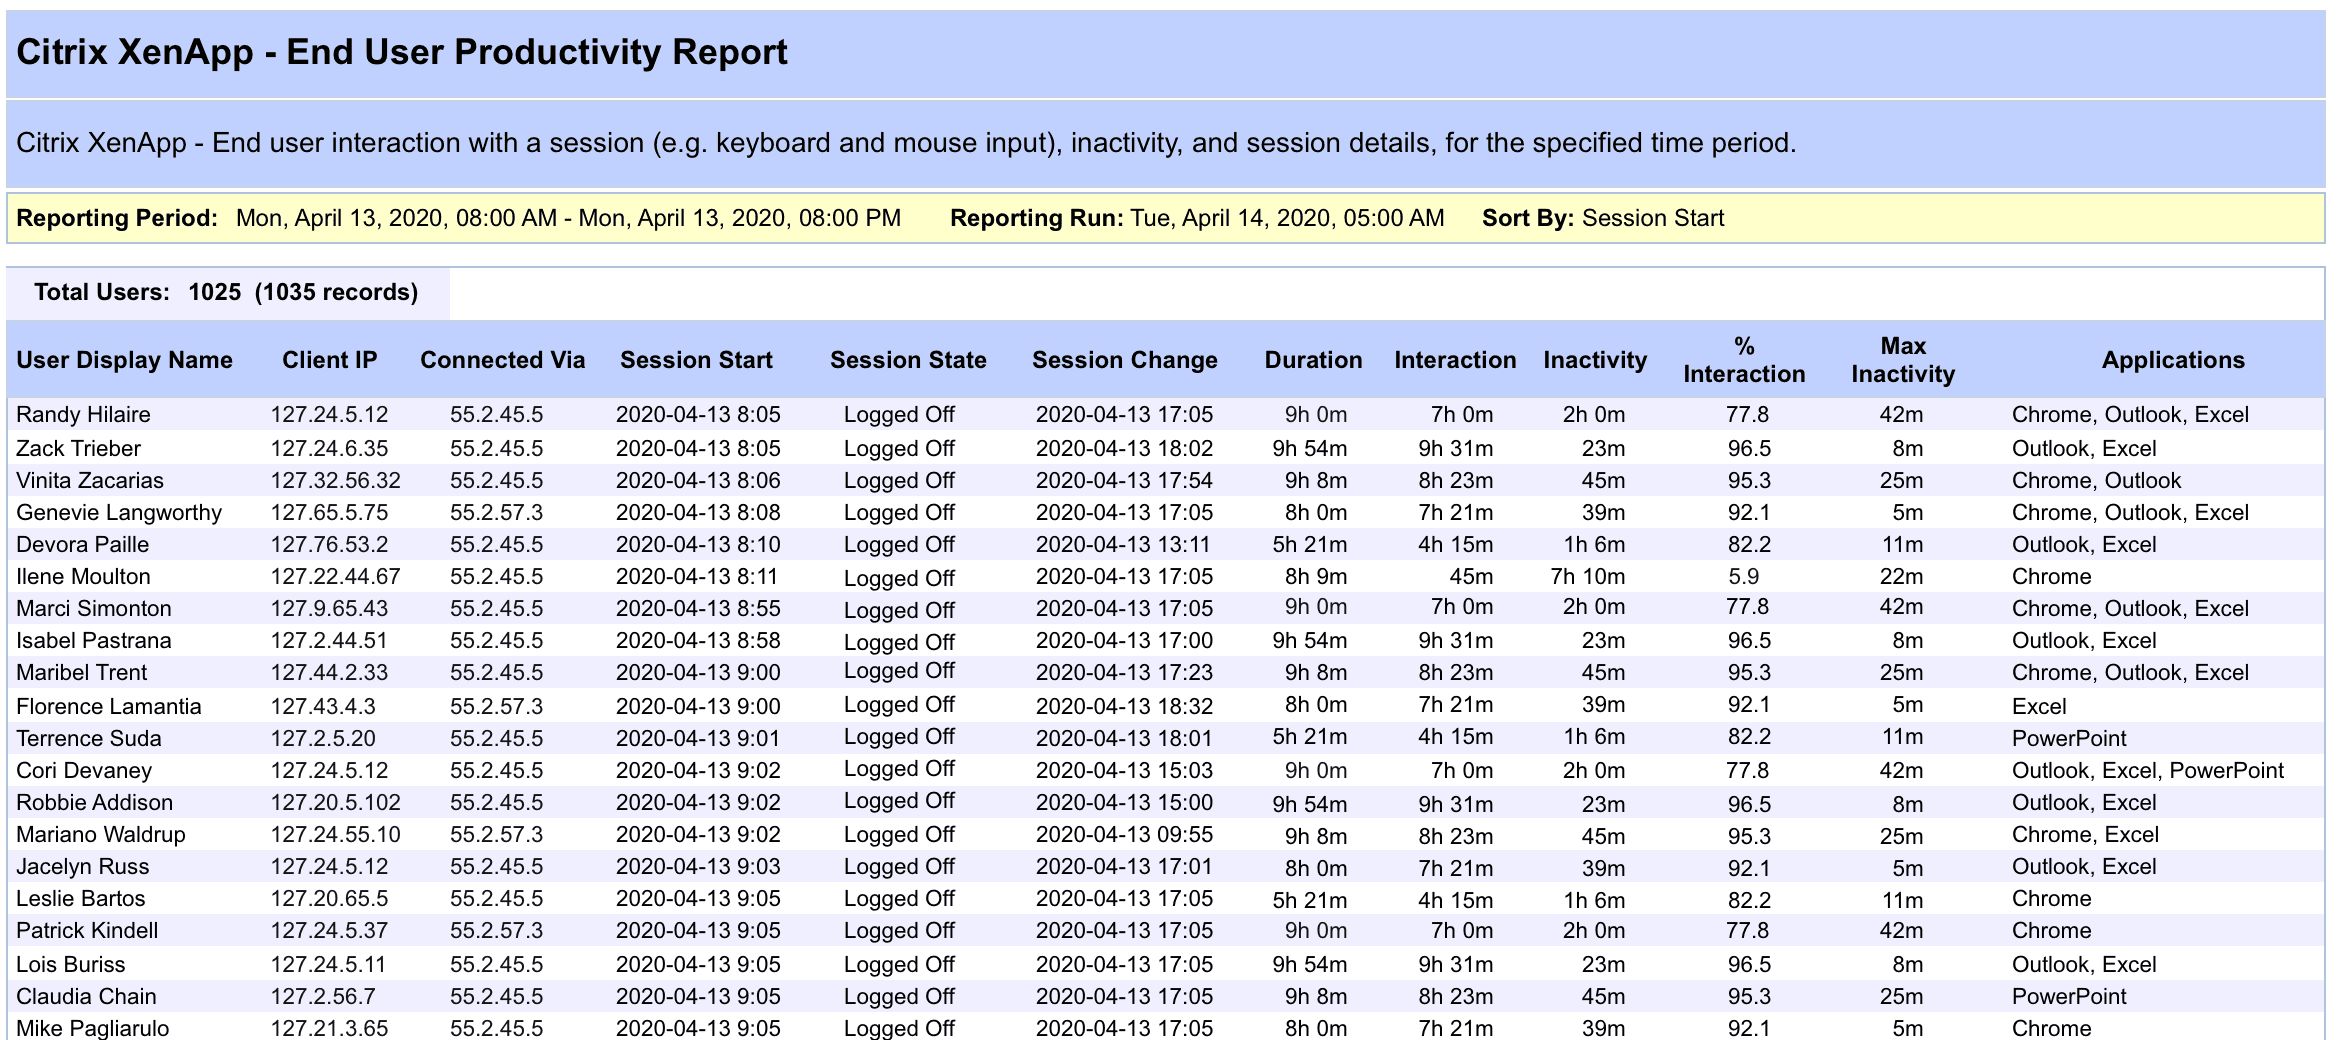
Goliath offers an End-User Productivity Report that provides employee productivity tracking. This report tracks exactly how many hours an end-user was interacting within their Citrix session and how much time they were inactive (i.e. not working). The report can be scheduled to run or executed on-demand and can be emailed, exported (PDF, CSV), or viewed directly within the Goliath interface. Figure 1, below, displays the End-User Productivity Report that shows managers actual user interaction and inactivity.
Figure 1: The end-user productivity report can be filtered based on user and time period to show such statistics as total time a user was interacting with the system (interaction), total time a user was inactive and NOT interacting with the system (inactivity), and percentage of the duration time that the user was interacting within the system (% interaction).
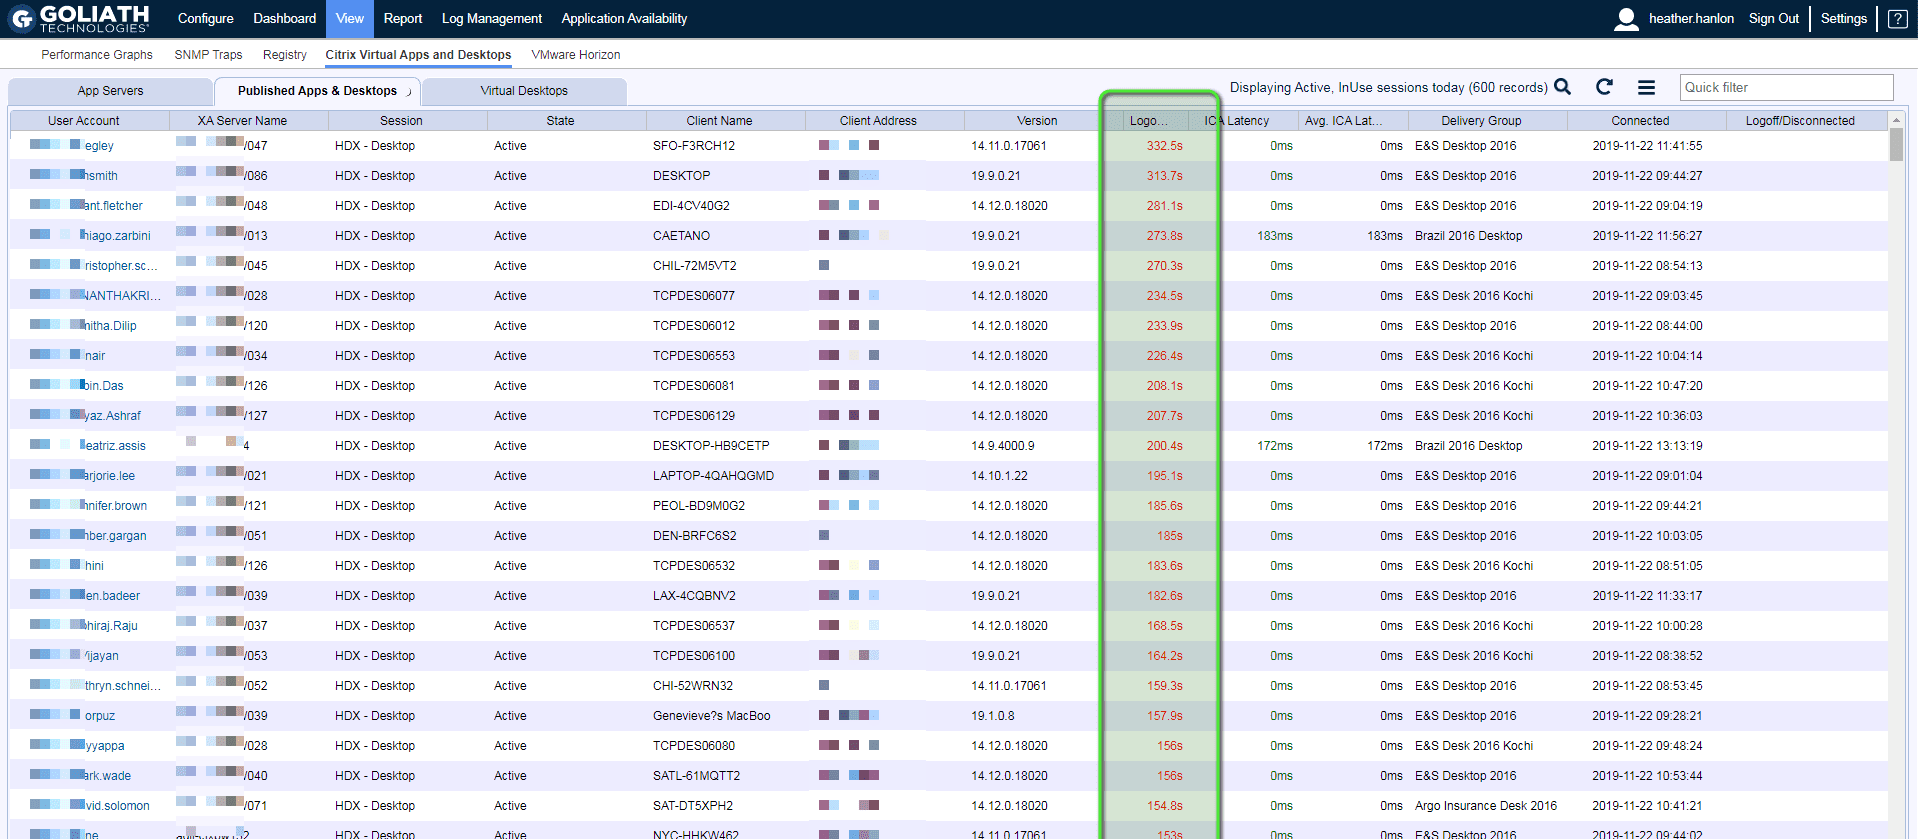
Goliath provides real-time analytics around each individual user session (Figure 2). At any point in time, IT can use this view to sort by logon times or ICA latency to quickly determine if there are any abnormalities or larger performance issues.
To hear how Penn National Insurance uses this chart daily to track real-time performance for their remote workers, watch this short customer video.
Figure 2: The Virtual Apps and Desktop display provides analytics for the actual user sessions where admins can not only drill into users with issues, but also sort and spot check those end users who may be experiencing poor performance.
Historical Performance Reports
Goliath offers historical reports and analytics that measure the end user experience and documents the actual performance around logon times, ICA or BLAST latency, session performance, availability, and more. These reports not only show data going back 60, 90 or 120 days, but can be leveraged to collaborate cross-functionally and drive meaningful conversations with other IT teams (server, network, applications), management, vendors, and end users.
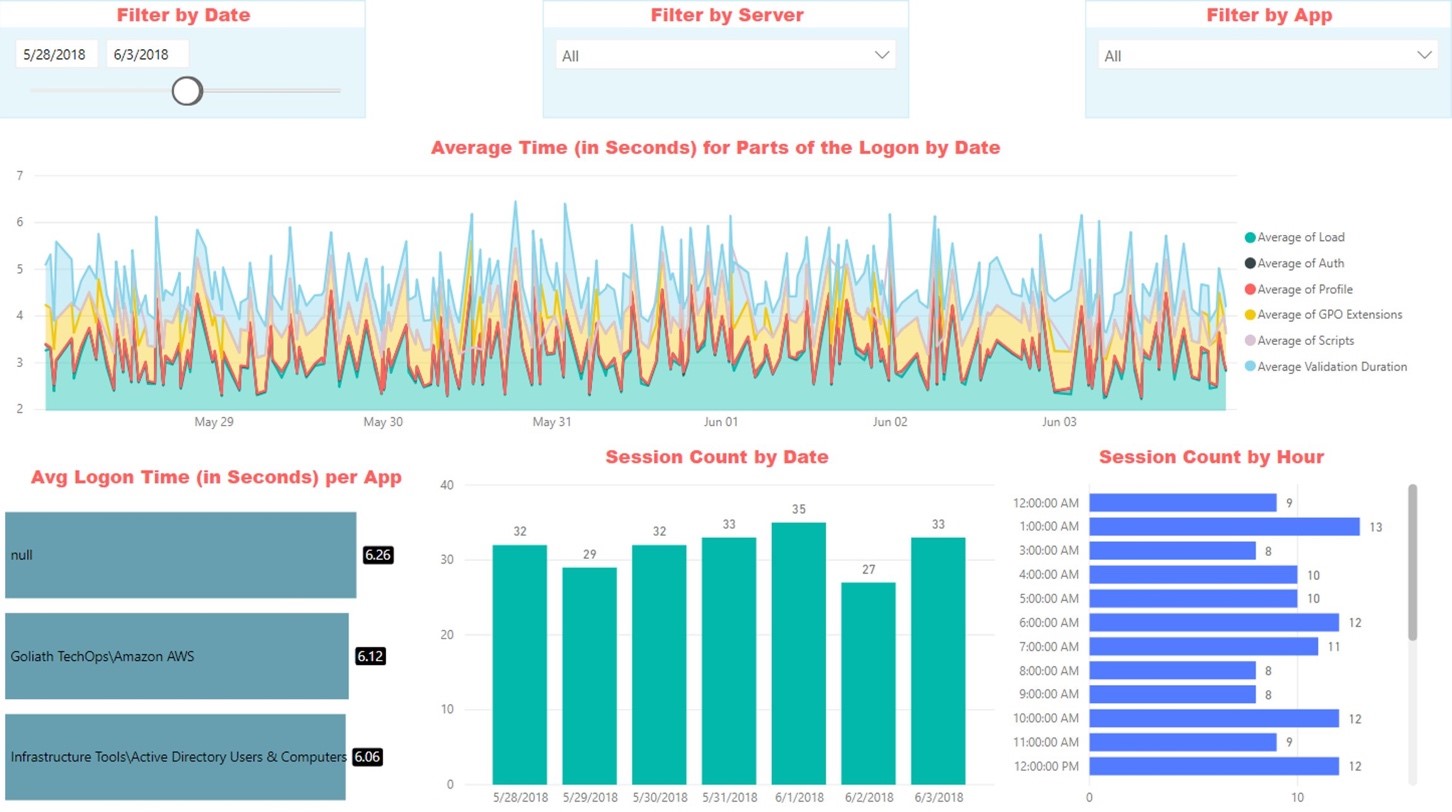
Figure 3, below, is an example of the logon duration report where the different sections of the logon process are broken down across the environment, highlighting any bottlenecks. This report can be run over a specific time period, by server, or by application.
Figure 3: The graphical logon duration report shows trends over time to management, other IT teams, and end-users, identifying where bottlenecks exist and, once fixed, that resolution has been achieved.
License Usage Reports
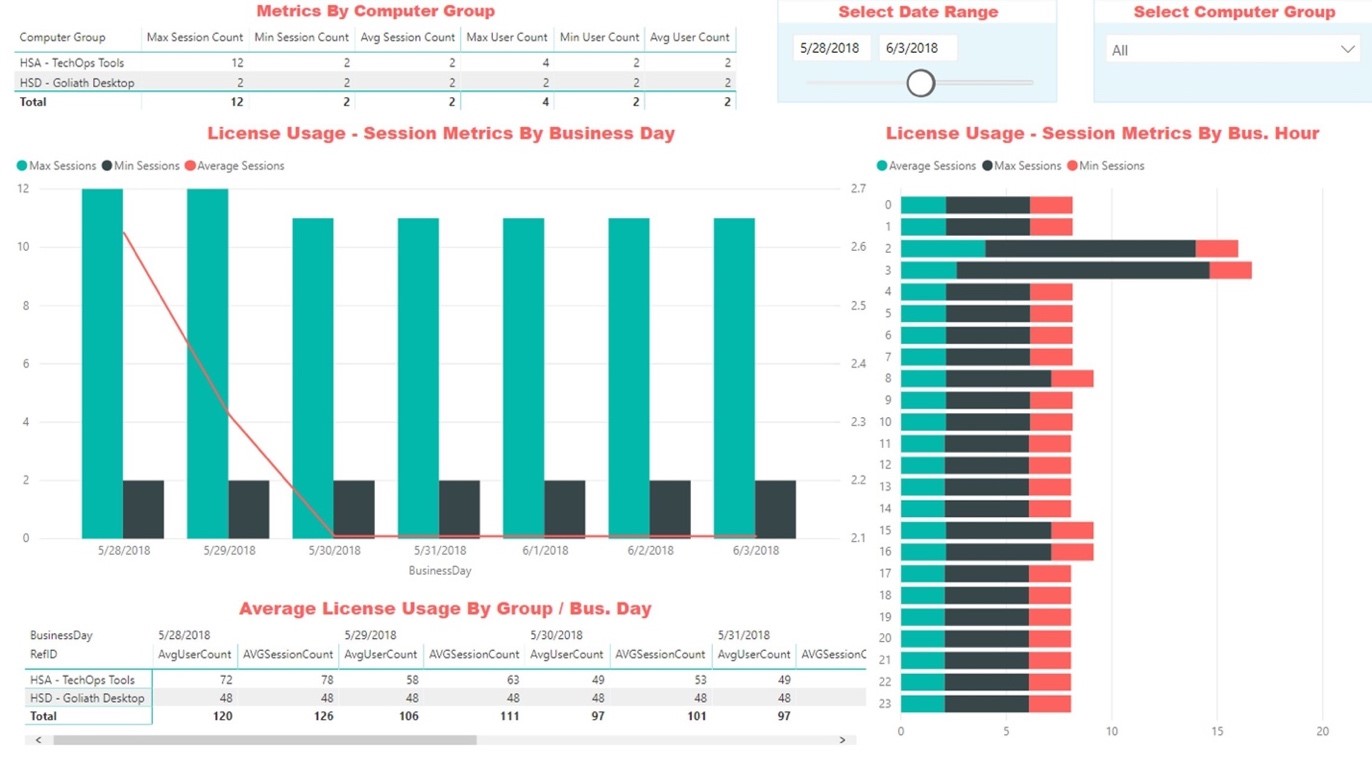
The license usage report identifies the unique number of users that logged into the environment over a defined stretch of time along with the total number of licenses utilized. This enables administrators to quickly determine how close they are to running out of licenses during peak usage times. This is growing in importance as the increase in remote working has increased license usage for many organizations.
Goliath also offers reports on Citrix or VMware Horizon licenses looking at groups of users as well as time (Figure 4). Now before increasing Citrix or VMware Horizon licenses due to increased remote staffing levels, actual usage data can be used to confirm the requirement. If licenses are added, they can be tracked to ensure they are being utilized as expected
Figure 4: The License Usage report breaks down actual usage of licenses and can be filtered over a specific date range or group of users.


