Don’t Troubleshoot Citrix Blind
As an engineer, we’ve all been there. In the middle of an escalation, users are frustrated, management is hovering over you looking for updates every 5 minutes, while at the same time you are trying to troubleshoot the issue and figure out what’s going on. It’s a stressful situation to be in, and unfortunately one that we find ourselves in all too often in IT. Everyone just wants it fixed and they want it NOW!
This is the moment where you either shine or falter. The tools that you have at your disposal can literally save you hours of time, headache and grief. If the system you support is multifaceted and dependent on an entire cast of other technologies such as Citrix, it can be a true “needle in a haystack” type of scenario trying to determine the root cause.
This is where Goliath Technologies’ ability to monitor and troubleshoot Citrix end-user experiences has stepped up to help me automatically obtain a great overview of the overall health of my end user’s Citrix session.
From within the Goliath console, navigating to View → Citrix Virtual Apps and Desktops, I can see data for all my Citrix App Servers, Published Apps & Desktops, and Virtual Desktops.
Monitoring Application Servers
The App Servers section provides insight into the Application servers running in my Citrix farm. Here I can view metrics around the number of user sessions along with resource utilization. By selecting a specific server, I can drill into the XenApp Summary Dialog, which provides even further information.
On this screen (see Figure 1), I tend to look for overloaded servers either from a session perspective or even a runaway process that may be consuming a lot of CPU or Memory. Depending on your density, if a single server is overloaded it could impact anywhere from 15-30 sessions.
Figure 1: On the Apps Servers tab you can view metrics around the number of user sessions along with resource utilization.
Monitoring Citrix XenApp Server Summary and Additional End-User Experience Metrics
From the XA Server Summary, I am presented with information about the Citrix server itself. Nearly all graphs are clickable and enable me to investigate further if necessary as you are troubleshooting. If, for example, I notice a resource issue on the App Servers dialog I’ll be able to drill in even further by looking at things like the “Top 5 Processes” (see Figure 2).
Compared to some vendors, Citrix does a decent job of writing to the Event Log, and if at first glance I don’t see any issues I’ll start to dig into the Application Event Logs. Here it’s very simple to jump around between servers and compare events between Delivery Controllers and Session Hosts.
Below are several good resources that provide descriptions for the various Citrix Event ID’s.
- XenApp and XenDesktop
- Citrix Profile Management Events
If you are looking for more detail on how Goliath can help with Event Log Monitoring, they have a good write up here.
https://goliathtechnologies.com/software/goliath-performance-monitor/microsoft/event-log/
Figure 2: Goliath provides the ability to drill further into metrics such as “Top 5 Processes by Resource Usage.”
Troubleshooting Citrix End-User Performance Issues
Under the Published Apps & Desktops tab (see Figure 3), I can see a list of all users. If I know the problem user, I can use the filter to quickly find their Citrix session and view more data around their overall experience.
Figure 3: Goliath’s Published Apps & Desktops tab allows you to quickly find and troubleshoot the Citrix session in question.
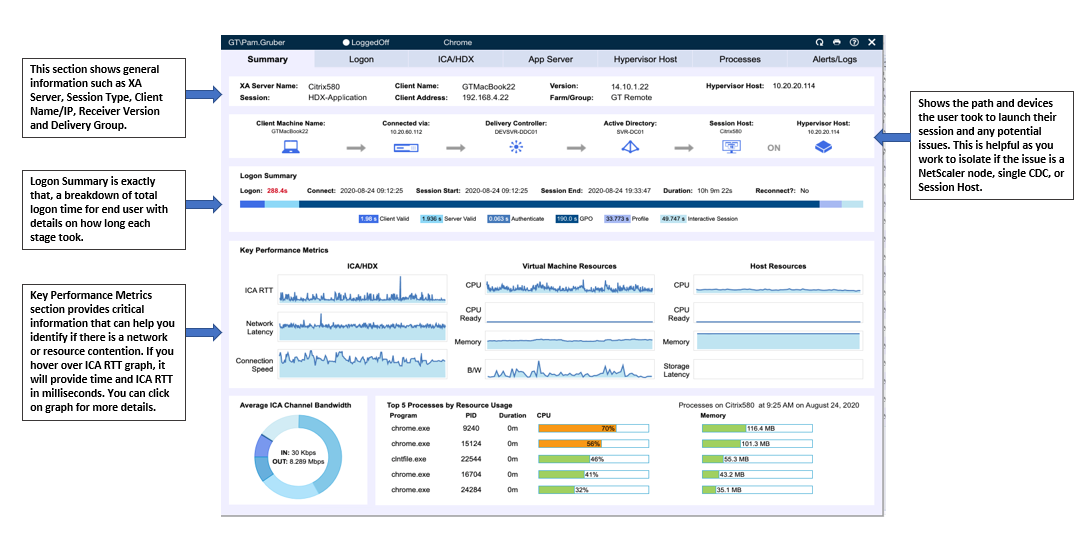
Of all the data that Goliath can present to me as an engineer, this is really one of those dashboards (see Figure 4) that I simply can’t live without when it comes to gauging the end users overall experience. There is a wealth of information that is presented in an easy to navigate user interface and summarized across a series of tabs. It is a single location where I can see any potential IT element that could impact end user experience from the user’s behavior, to the endpoint, and then all the way through any condition in the data center.
Anyone who has ever supported a Citrix environment knows just how painful it can be trying to troubleshoot logon issues and reduce the overall logon time. Over the years, I have spent countless hours simulating end user logons and tracking the time it took for each, all in what sometimes can feel like a “fruitless effort” attempting to shave only seconds. It can be extremely tedious and will most likely require digging into several scattered logs to figure out exactly where that additional time is truly coming from. With Goliath, I have an easy to read breakdown showing not just the overall logon time, but also each step in that process.
The Session Dialog, however, shows so much more than just the Logon Summary. While Citrix has done a fabulous job of tweaking the HDX protocol and making it a best in class solution for remote workers, it’s just a painful truth that the quality of that network means everything to the end users experience. ICA Latency, Round Trip Time, and Connection Speed are all measurements that help me to further understand if the user may be experiencing session freezing and mouse/keyboard lag.
Figure 4: Goliath’s Session Summary screen provides in a single view critical metrics from the endpoint, end-user behavior, connection, delivery infrastructure, all the way to the backend data center.
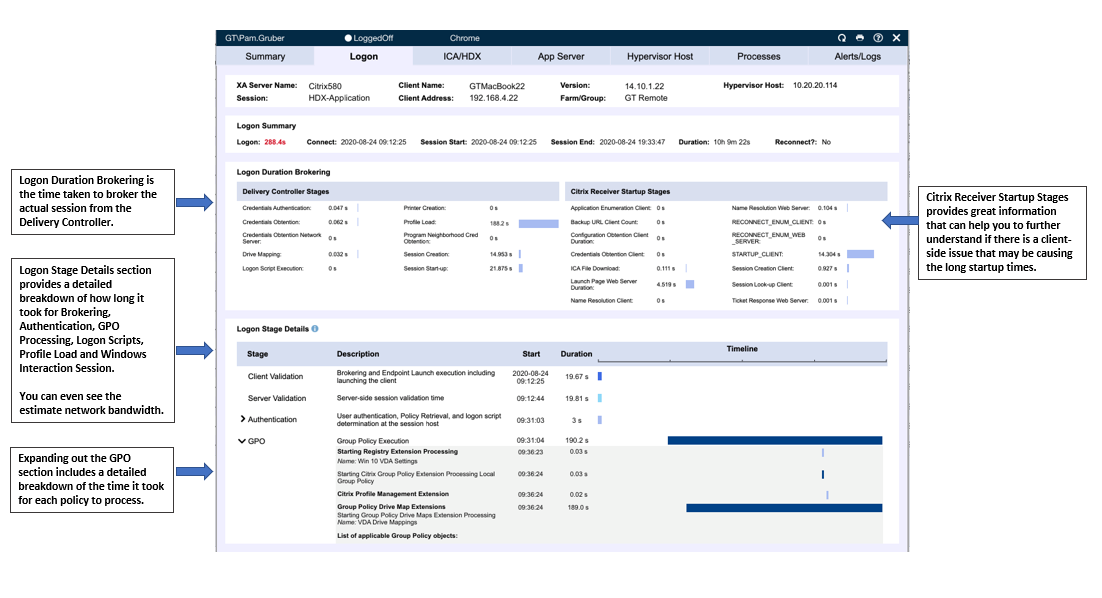
Talking about troubleshooting the end user logon process, I wanted to take a moment to focus on the Logon Tab (see Figure 5). Let’s say I noticed that Group Policy Processing was taking longer than expected, I can go to the Logon tab and see just how long each individual policy took to load. If the issue doesn’t seem to be policy related, I can see other important items related to the Logon process such as Client Validation, Authentication, Profile Load, and the Windows Interactive Session.
In addition to the Logon Stage Details, I can also see a breakdown of the Brokering Time and Receiver Startup Stages. Collectively this information helps to give me a holistic view of the time spent for the end user to launch their session and insight into a logon/launch issue.
As I walk through each of the additional tabs (ICA/HDX, App Server, Hypervisor Host, Processes, Alerts/Logs) I am given detailed information about each area of focus.

Figure 5: Goliath’s Logon tab allows you to drill further down into 33+ logon stages to quickly find root cause, such as GPO.
Conclusion
When I opened this article, I talked about the stress that gets placed on engineers when working through an escalation and articulated a scenario that I myself have been involved in countless times. If there is one thing that I can guarantee you, it’s that those situations will arise, they are unavoidable in IT. However, you can take the preventative steps to bullet proof yourself as best you can and be prepared.
As silly as it may sound, here your shield is “DATA”. The more visibility you have and the faster you can access that data about the environment you support, the sooner you can get back to your daily life. Everything that I walked through in this article is accessible in a matter of seconds. Not only that, but the user interface is setup in a way that allows you to quickly bounce between different servers and user sessions very easily.
I’m a huge Seinfeld fan and one line has always stuck out to me from my experiences working in IT, “Serenity Now, Insanity Later”.
Don’t wait for the insanity, it will find you 😊. If you feel like you aren’t prepared for those moments, take a few minutes to lay out a game plan. Once you have that plan, if you find the solution monitoring your Citrix environment is lacking, consider a trial with Goliath.


