Problem
A majority of end users complaining that every Friday from 10:00 am to 1:00 pm their sessions were slow.
Identifying Root Cause
When trying to identify the root cause of a Citrix end user experience issue, one of the key pieces of information is if the issue is widespread or if the issue is somewhat isolated. In the case above, since the issue seemed to be pretty widespread the best place to start your troubleshooting process is by using the Topology View within Goliath Performance Monitor.
The Topology View provides access to a high-level overview of the Citrix environment. This view is automatically built and scales to any size environment and even multiple environments.
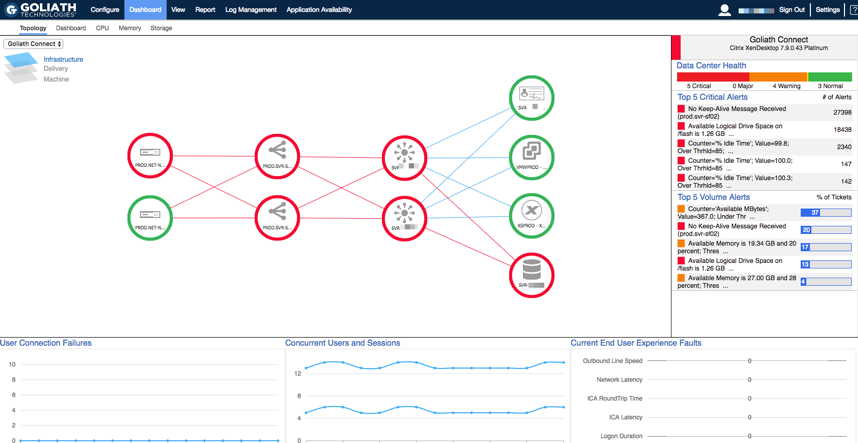
To access the Topology View, click Dashboard then Topology. This will display a window similar to the following:

The Topology view is divided into 3 layers: Infrastructure, Delivery and Machine. On the Infrastructure layer, your Citrix architecture is mapped to display how your Netscalers, Storefronts, Delivery Controllers and other Role Server are connected. These nodes function has a heat map, so as problem occur in the environment they will change colors to identify you of an issue. You can also click down to view key services, validation of uptime and availability, resource utilization, and the top alerts that are triggering.
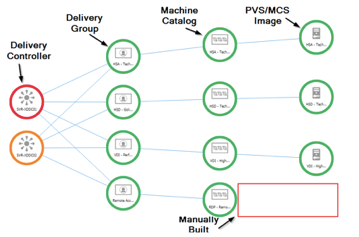
By drilling down into the delivery layer, you can see a logical view of the environment which maps the Delivery groups, Machine Catalogs, and Gold Images as pictured below.

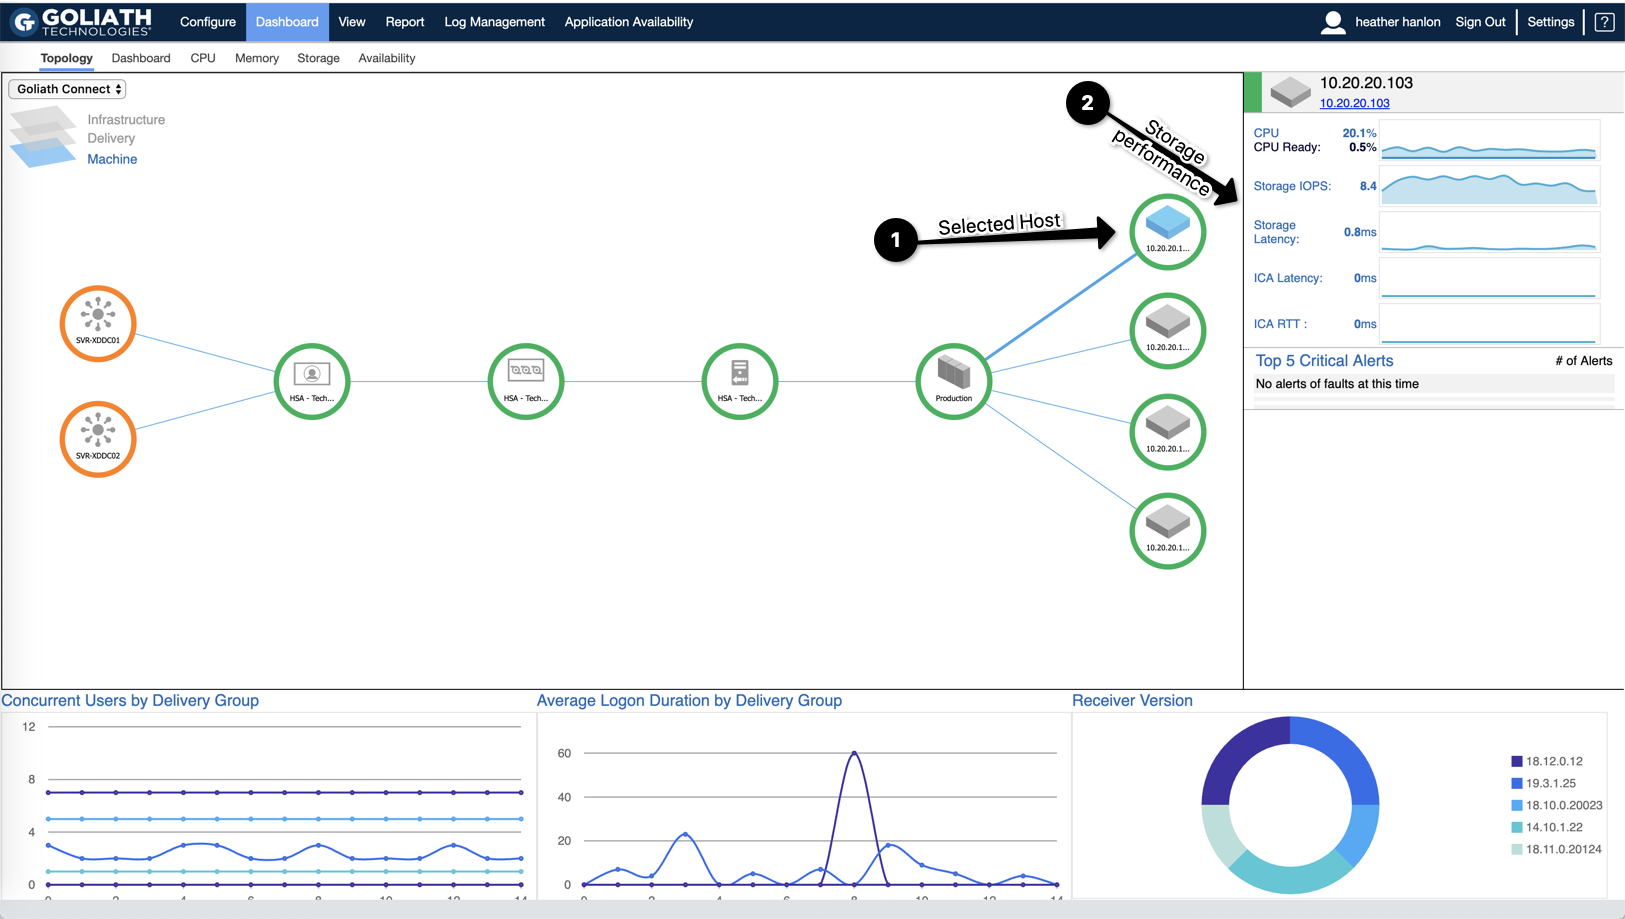
By drilling into any of the nodes on the delivery layer, it takes you to the machine layer where we can see how it builds out to the Image, Cluster, and hosts supporting these users, and on the right the end user experience and performance metrics identify. If there are any overarching bottlenecks affecting not just one user but hundreds or thousands of users.
The delivery and machines layers allow users to identify resource and user experience problems that are affecting large numbers of users.

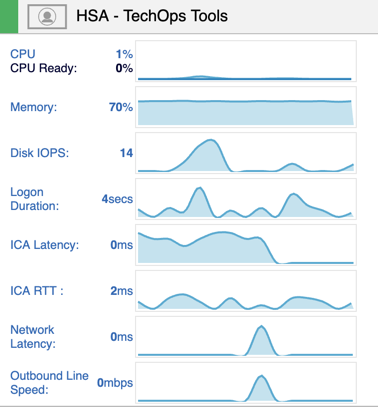
In terms of a widespread group of users complaining of slowness, you’ll want to start at the delivery layer and drill into the different delivery groups one by one. When troubleshooting slowness, the primary question you need to answer is whether the slowness is due to a network/connectivity or resource utilization. The quickest way to make that determination is by reviewing the Network Latency, ICA RTT, and Connection Speed. These performance metrics are shown as an average per delivery group on right hand side of the page.

In some cases, you’ll find that the delivery groups had nominal resources, good connection speed, no ICA Latency, Network Latency or ICA RTT. When this behavior is presented, it can be usually be confirmed that the poor performance issues are not related to a user or Citrix Delivery issue. With that said, you’ll want to next click into the clusters to further validate that the hosts supporting these users have resources. Often times, our customers will find that there was enough CPU and Memory, but storage latency was high. Next, by clicking into the hosts, you can see which hosts had session hosts impacted by Storage latency.

Root Cause
By following the above workflow on the Topology View, our customers have been able to eliminate the entire architecture but storage as causing the issue and show proof of where problem is taking place.
In scenarios like this one, one customer was able to alert their Storage team, who then looked into the issue further and saw there was snapshot based backups taking place during business hours and turned it off at that time. The following week it was confirmed that the performance issues that occured every Friday were no longer taking place.
Also, where this scenarios focused on storage latency, CPU and Memory could also be cause in some cases