Citrix CTP Blog
Collect, Correlate, & Visualize Citrix End-User Experience Data
Written By: Benjamin Crill

Previously we heard about the ability for the Goliath solution to test and self-heal the environment. This provides an ability to let the environment take care of itself, relying on the collective years of experience from EUC experts. However, we all know that just because an environment checks all the boxes, does not necessarily mean that users are productive and pleased with the environment. However, we can now focus on the things that are important to the end user, but we need to know what those are and how they are working together in concert. This will be the focus of what we look at next.
Automatic Correlation
No one enjoys receiving support calls from users complaining of performance issues, but it happens all the time. Doing your due diligence, you look for alarms, tickets, etc; ANYTHING that could point you to the root cause. The problem is that it isn’t always obvious or systemically noticeable when a single person has an issue. Now we must dig deeper and start to look at all the different connecting points to see where the true root cause could be. Let’s list out some possible experience issues and where we would typically look:
Slow authentication
- Which domain controller did the logon go against?
- Is the domain controller under resource contention?
Slow logon
- How long did the profile take to load?
- How long did Group Policy take to load?
- Which policies are being applied?
- Which host is the workload on?
- Is the host under resource contention?
Poor session performance
- What resources are being consumed on the workload VM?
- Are there errors on the workload VM?
That’s just the start of things – there could be more depending on what other solutions are in the environment that impact user experience. Nevertheless, you can see that it can be a difficult process to track down issues. Just looking at the list above, here are some of the tools you’ll be bouncing between:
- Command prompt
- Group Policy Management Console
- Citrix Director
- Citrix Studio
- vCenter/Prism/System Center/XenCenter – whatever your hypervisor of choice is
Going back and forth between tools is not ideal. At best you must find the time an issue occurred and line it up against the data from each tool. It would be so much easier if there was a way to see all that data lined up for you. This is where Goliath Performance Monitor helps you be more efficient.
When you start looking at a user’s session, the first thing you’ll see is the authentication and brokering path. At first glance you can immediately narrow down the actors involved in the user’s session. No more finding the session in Director/Studio to find the broker. No adjusting views to bring in the hypervisor the workload is running on. No special scripts to extract the logon server. It’s all right in front of the admin from the first click.

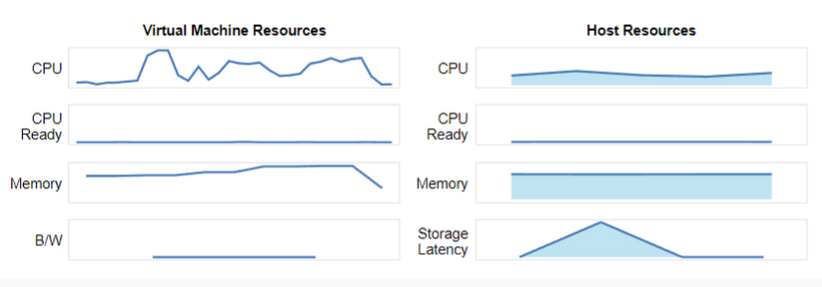
Further down on the Summary tab is this helpful bit of information. Now you can see how the virtual machine is performing as it relates to the host that it is on.
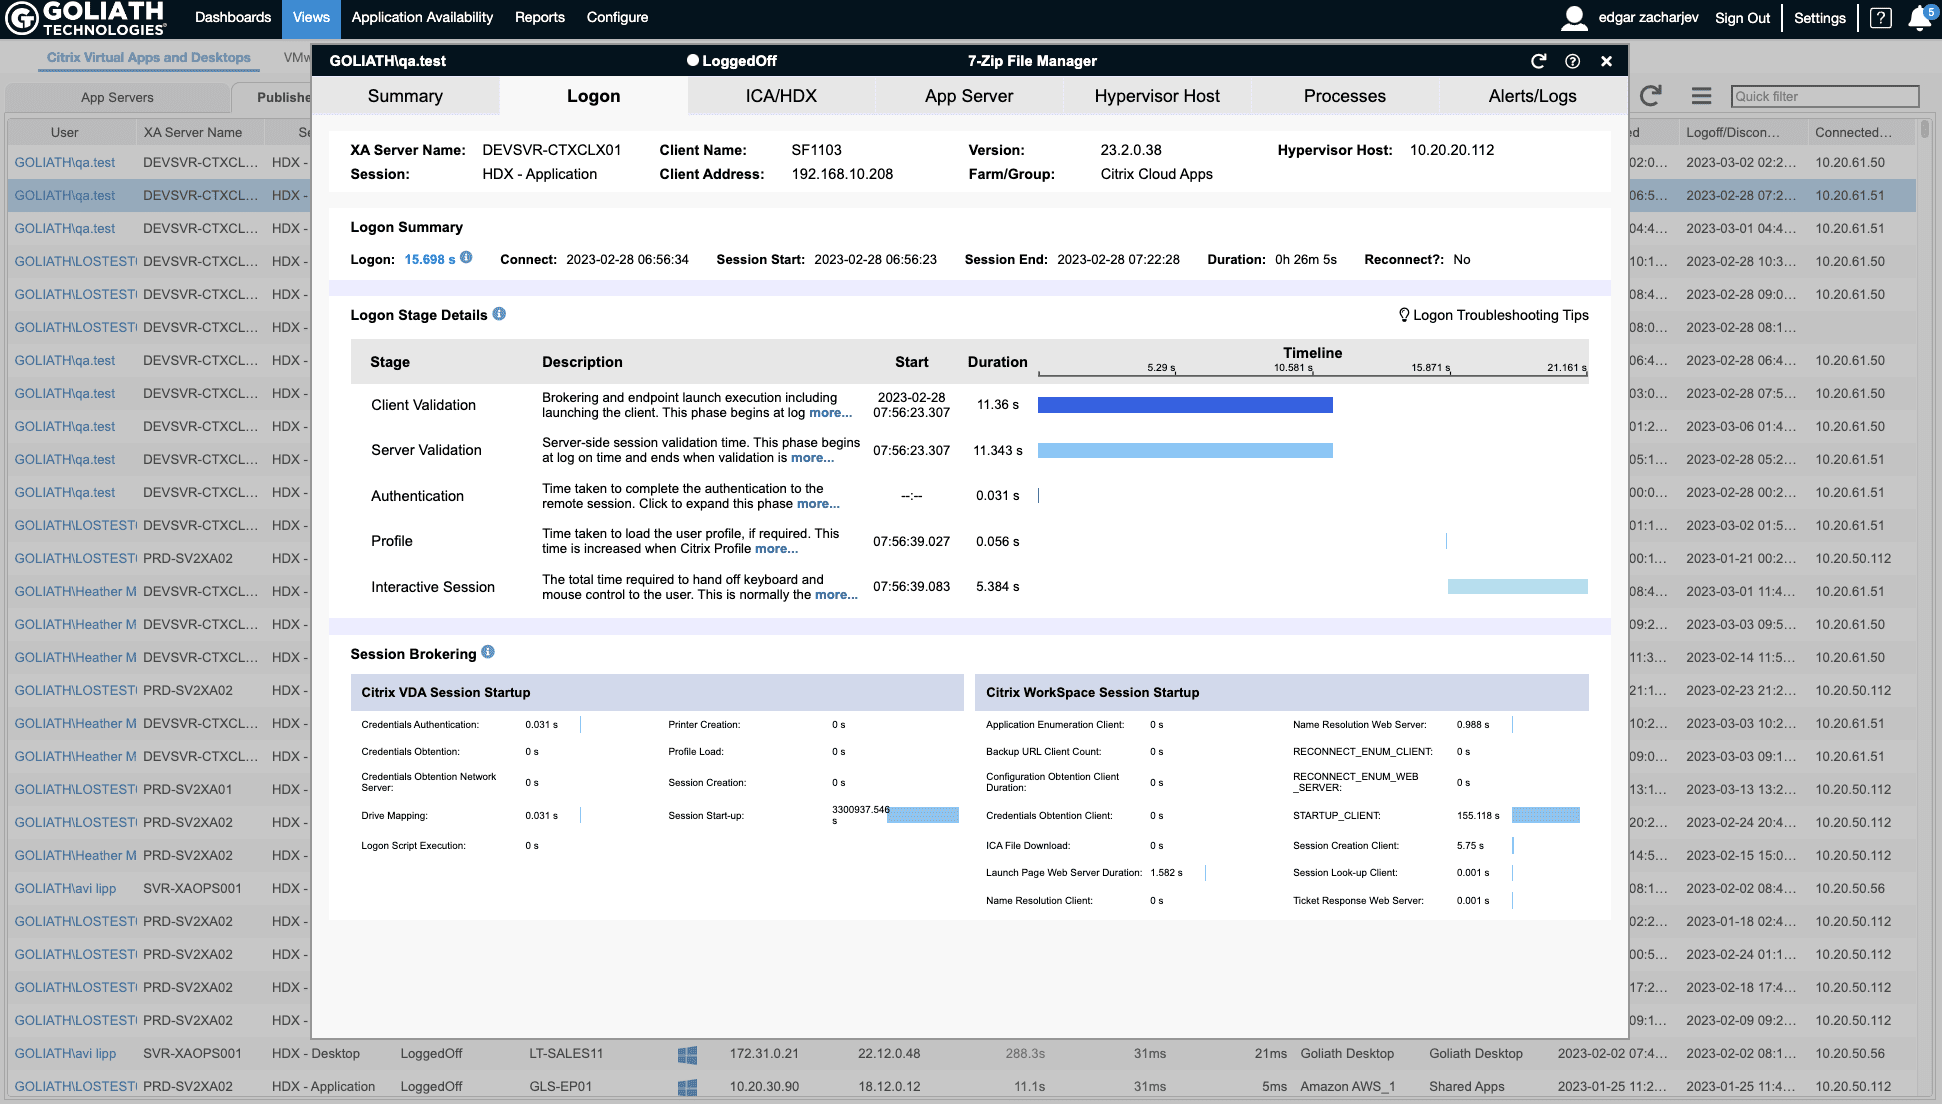
Troubleshooting logon duration must be one of the most tedious tasks out there. There are so many things happening at user logon, and they are right in the face of the user. It’s almost like being an orchestra conductor when you’re attempting to align all the disparate elements together, but it is ever critical to the user experience. The Goliath logon stage information gives you the data you need, showing the different stages of the logon, how and when they were executed, and for how long. You want to see if there was a GPO that didn’t apply? It will show you that in the GPO section. It just eliminated another step for the admin. Again, it will show you the logon server too, so you don’t even have to click back into the interface to keep that in the forefront of your troubleshooting workflow.
Finally, we have the infamous user complaint of “it just feels slow.” Well, now you can look at the workload the user is connected to and view its performance. You can look for pure performance counters, processes that may be consuming those resources, or errors and events that are being logged.
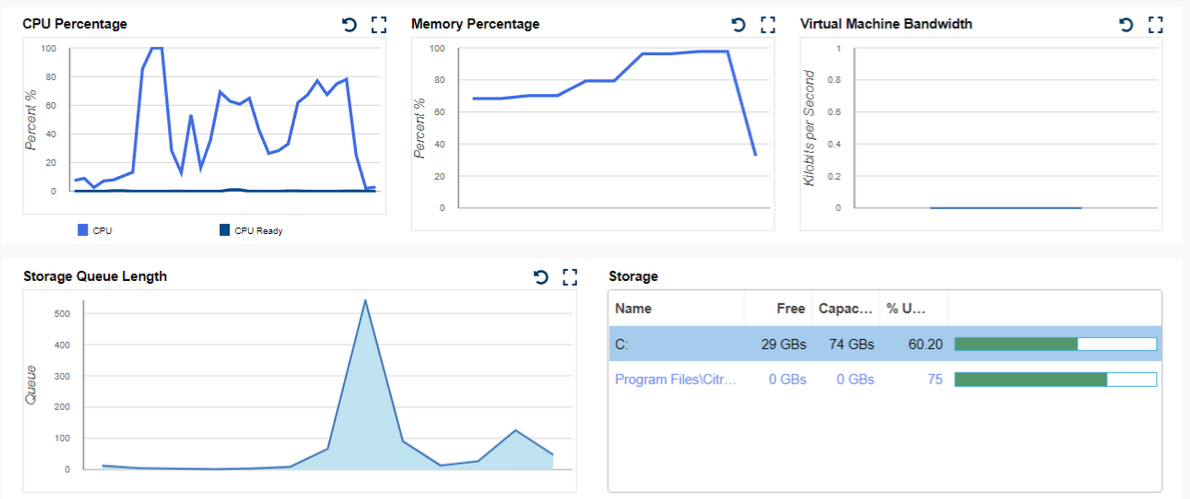

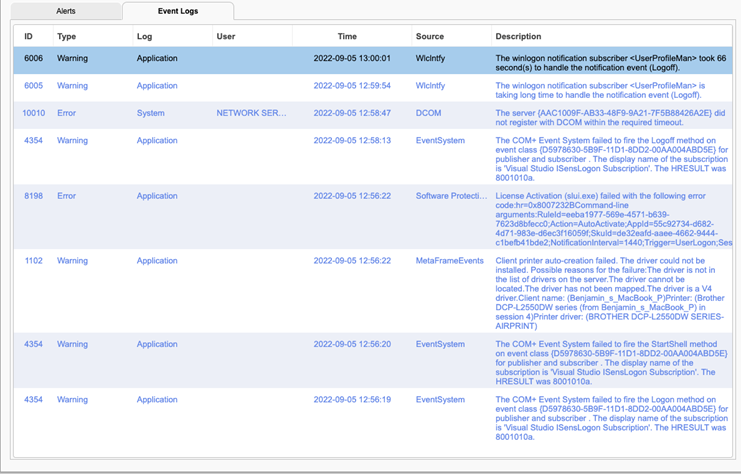
All this information is now at your fingertips. By centralizing it, the result is faster and more accurate troubleshooting. Faster time to resolution will help you show the value of your function in IT, plus demonstrate how you contribute to your company’s overall business goals.
ICA Drilldown
With any remoting technology, the weakest link is often the link itself. The connectivity between the end user and the resource is either congested, not stable, or the amount of data going across it is more than it can handle. Digging into that data, determining the cause, and remedying it is laborious. But it is integral when explaining to end users and management what is impacting user productivity. With the Goliath solution you can easily dig into the HDX protocol and its components to determine where issues are occurring. You might see that you have enough bandwidth, but that the latency is high. Unlike simply receiving a point in time statistic like in Director, you can see your data mapped and correlated.

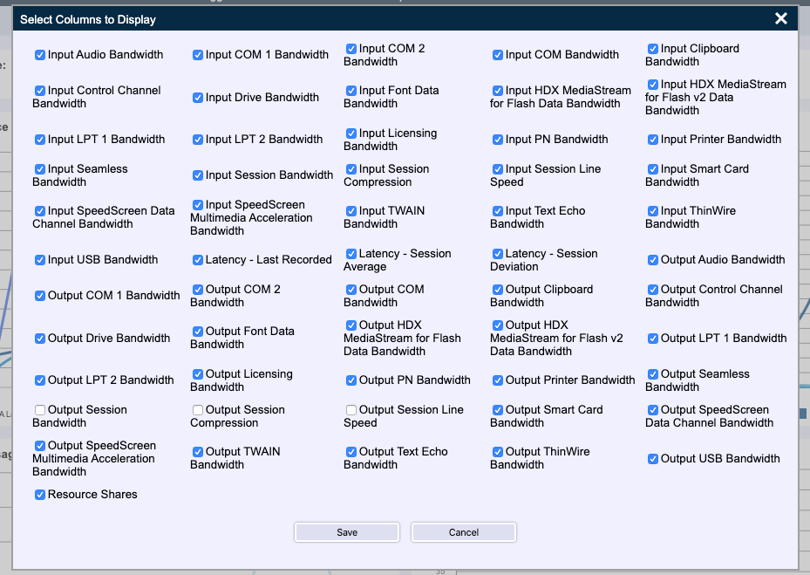
Sometimes what happens is a particular component can drive bandwidth consumption, or it might impact a particular portion of the user experience. Goliath’s tool lets you see the breakdown of the Citrix virtual channel usage. Now the admin no longer needs to isolate, test, and repeat to determine which is the culprit. The information is available to them from the start.

Not only is it available, but it can easily be filtered. The admin can see the overall view, or zero–in on particular channels to see greater detail. This can eliminate hours of policy changes, registry changes, client testing, etc. All this results in time saved for the company’s highly trained and well-paid staff, letting them focus on the next strategic goal.
Conclusion
Goliath Performance Monitor brings together a wealth of information. Some tools on the market will have a large depth of information but no good way to sort or locate the data you need. Even if you do find what you’re looking for, a large amount of work is needed to interpret the raw data. By correlating the data for you and allowing you as the admin to break it down into its component parts, you have a powerful tool to make sure your user productivity issues are addressed and resolved as quickly as possible.
Try Goliath For Free
Experience true end user experience monitoring and troubleshooting free for 30 days.
