Event Log Monitoring & Troubleshooting
Event Logs contain a treasure trove of information for identifying root-cause and solving some of the most complex technical challenges. However, logs from a single resource alone limit your visibility. Correlating events across multiple components provide the complete visibility needed to fully understand the entire chain of events when trying to find the underlying cause of a complex issue. Furthermore, management of logs both historically and in real-time is important as forensic analyses play an important part in finding root cause. This means that the ideal solution should also include archival capabilities that are efficient and robust.
Goliath Performance Monitor provides a complete log management solution allowing you to manage log data through correlation, analysis, searching, reporting and alerting from one console. Furthermore, it is fully integrated into a complete monitoring and troubleshooting platform, allowing you to have the deepest level of visibility for finding root-cause of even the most complex challenges.
Overview
Goliath tools enable you to:
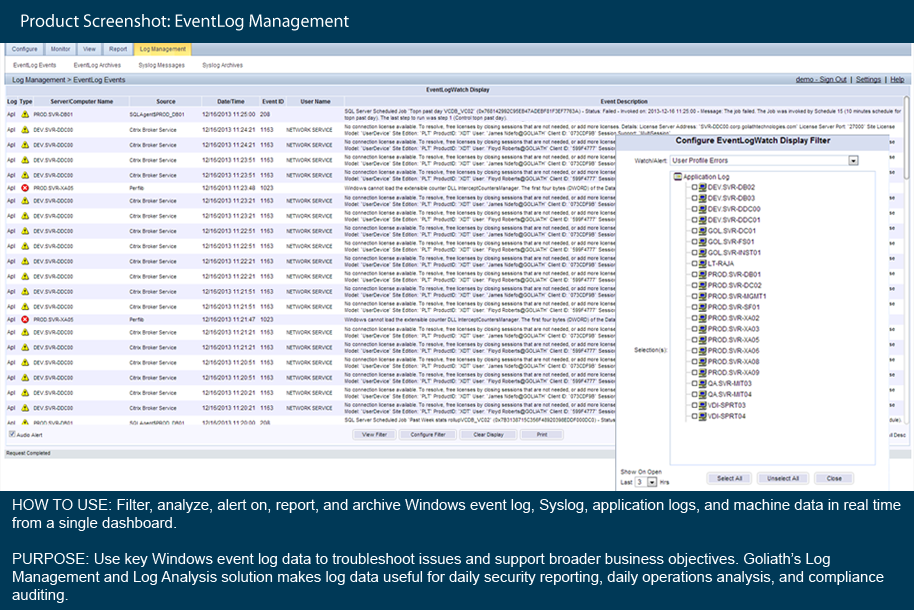
Filter: Customize Windows event log collection on basis of type, log, event ID, description, source, or user.
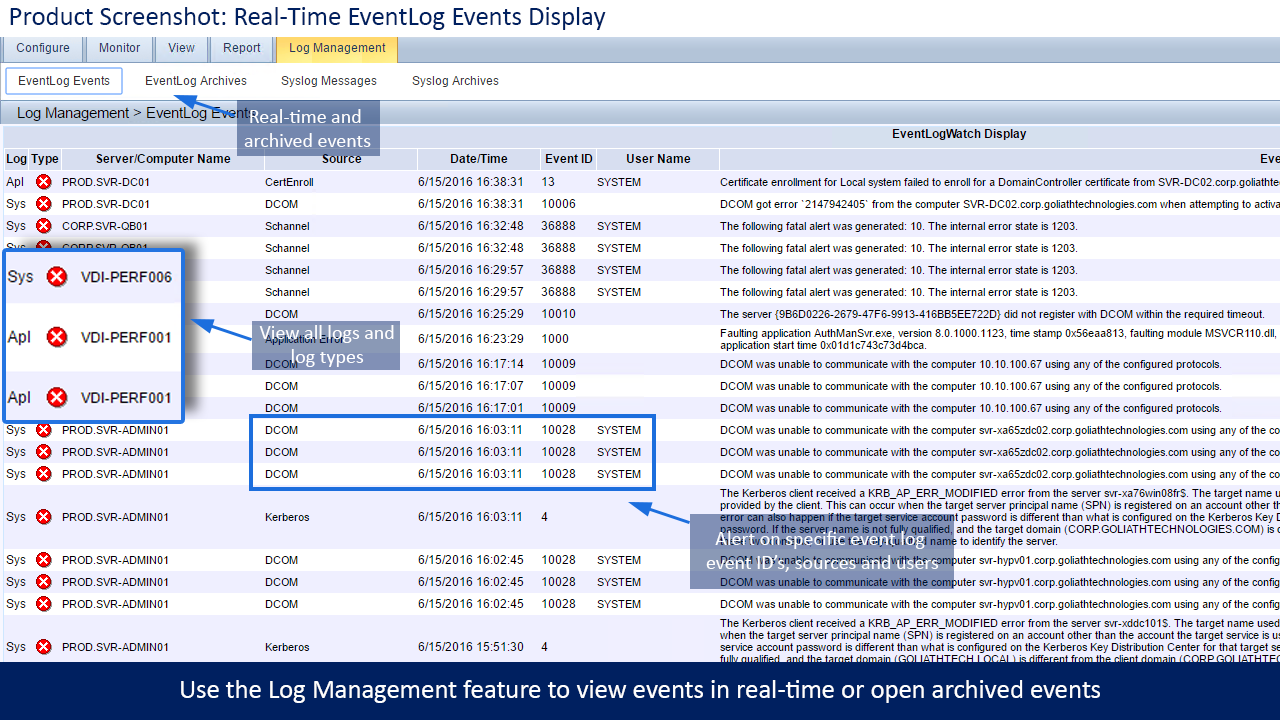
Analyze: Consolidate the most important events from across all your servers into one centralized real-time view.
Alert: Set notifications to take place as soon as a failure or fault occurs or a condition has been met. You can then simultaneously initiate automated remediation actions with the Goliath Performance Monitor.
Report: Run custom Historical Reports based on filtered and archived event logs.
Archive: Access your actual .evt and .evtx files for as long as you want. Our agent pulls the files, compresses them, and then stores them for long-term archive and retention.
If you are purchasing the Goliath Performance Monitor, the Windows Event Log Management and Log Analysis capability is included with any of our performance monitoring agents. This means that if you deploy an agent to Citrix XenApp, Citrix XenDesktop, VMware vSphere or Citrix XenServer virtual machines, or a physical server, you automatically receive Windows Event Log Management and Log Analysis functionality at no additional cost.
Capabilities
Goliath Performance Monitor Includes the Following Log Management Capabilities:
Real-time Event Correlation
- Alert on log events in real-time
- Correlate log events as they occur across all monitored resources
Universal Log Collection
- Analyze, search and troubleshoot all existing logs from all monitored resources on demand
Real-Time Alerting
- Create custom rules and alerts based on current log data analysis
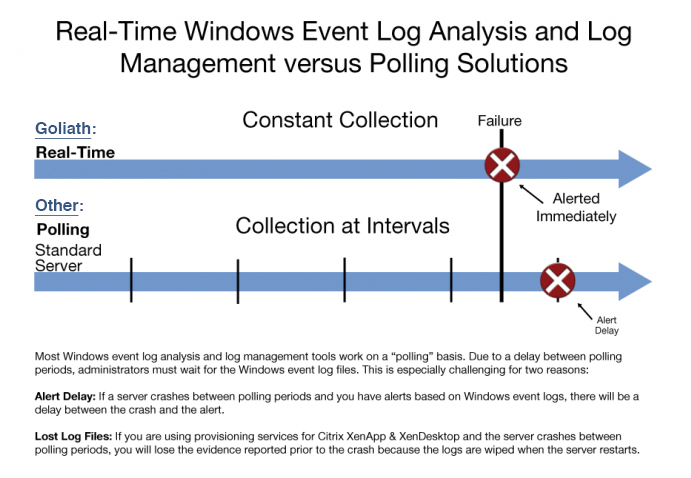
- Receive alerts on any event generated in system logs in real-time
- No delay when receiving notifications due to polling intervals
Remediation Actions
- Automatically resolve event log alert conditions as they occur
- Perform actions from basic services restart to running complex scripts automatically via alert remediation actions
Log Forensics
- Forensically correlate log data from multiple data sources over time to trend and find root cause
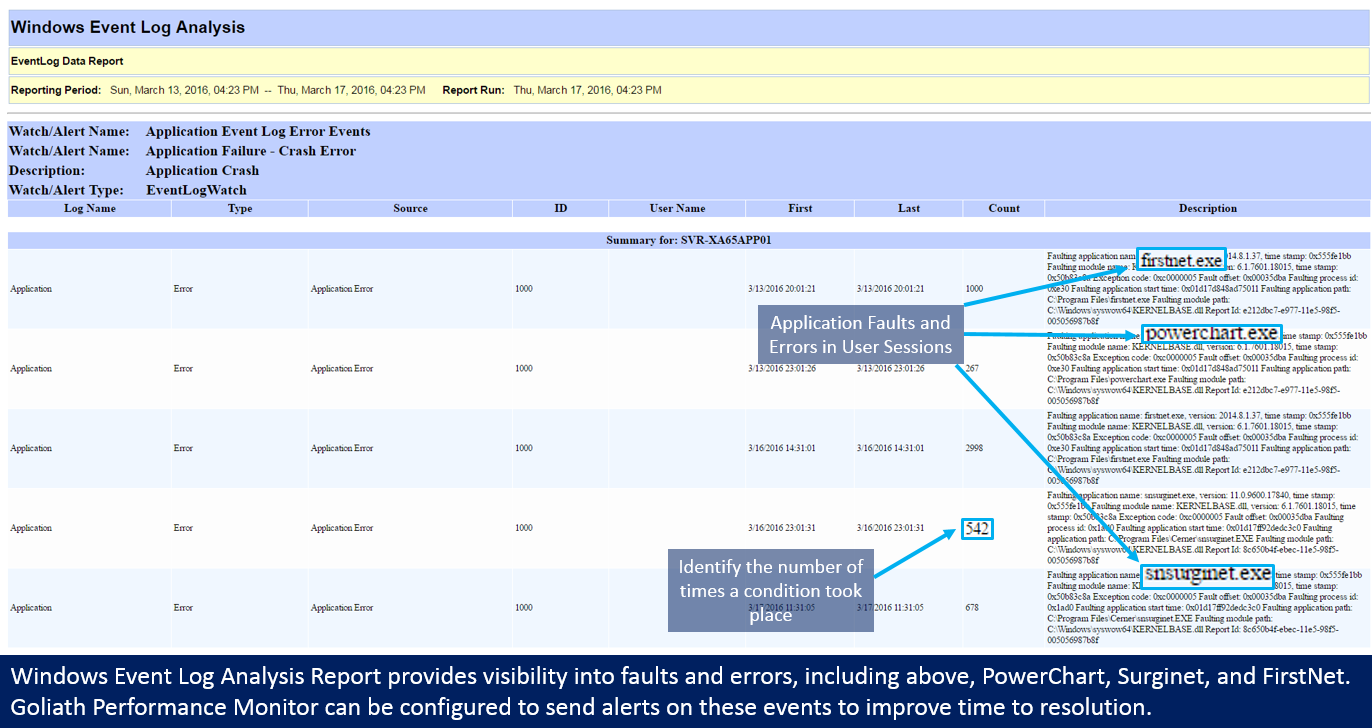
- Create log analysis reports on log data for historical analysis of system events
- Report on events to produce empirical evidence of issues and trends across the enterprise
Log Search
- Deep search capabilities for parsing log data across multiple sources
- Search and determine root-cause from all log data whether it is archive data or current log data
Log Archive
- Maintain, look back, and analyze logs after they have been purged from the source
- Efficient management and storage of log file archives
Event Log Management and Analysis
Goliath Performance Monitor allow you to:
Filter and alert for known conditions without having to comb through the logs yourself to reduce the amount of time between when a problem occurs and when the root cause is found
Search for conditions and consolidate critical events taking place on multiple servers into a single view to save time and reduce the effort needed to review server logs
Alert on known conditions automatically so you are aware as soon as an event or failure occurs within your environment
Leverage out-of-the-box monitoring rules for common problems and conditions such as Active Directory, Applications, Windows, and common applications like Microsoft Exchange, SQL, SharePoint, Citrix, Backup Software, VMware, and more
View the exact Windows event logs that triggered an event on a single server or on multiple servers all in a single screen to speed up troubleshooting and remediation times
Compress and archive Windows event logs to efficiently store logs long term
Produce historical reports on archived event logs to fulfill compliance requirements
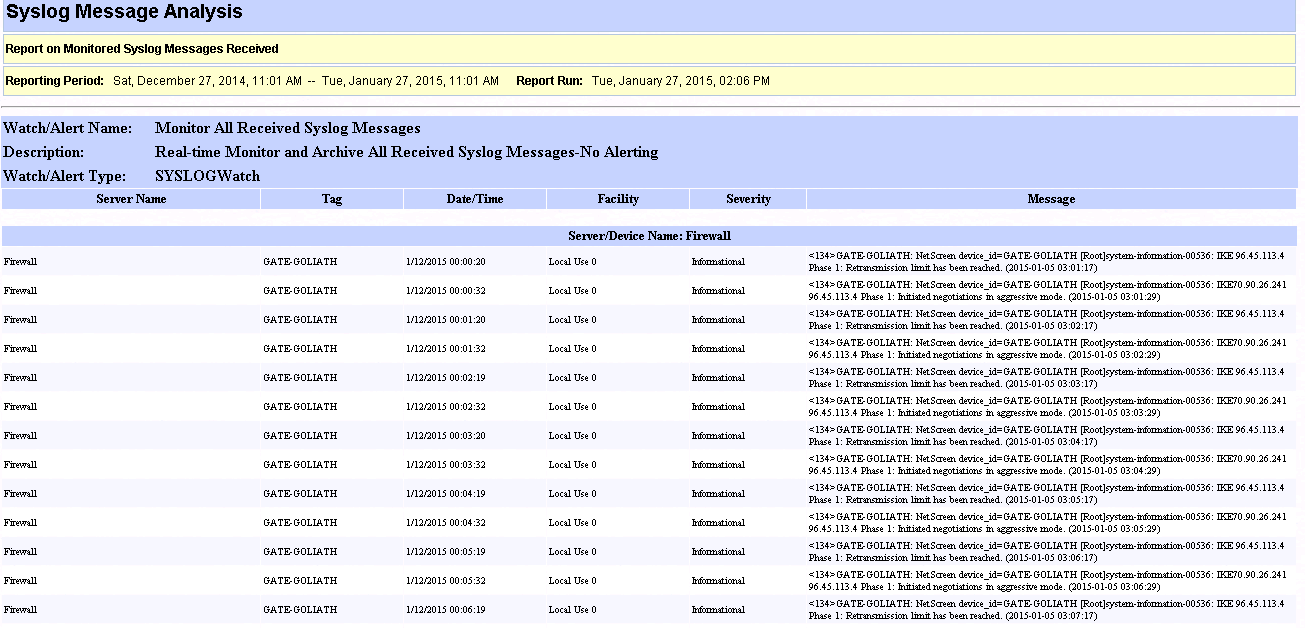
Report on events—including logons, account changes, server reboots, group policy modifications, and more—over a specific time period or even filter the reports down to identify a user’s activity, like domain administrator logins on the production servers
Syslog Management & Analysis
Goliath Performance Monitor also provides a method of capturing and filtering syslog messages. The syslog server filters syslog messages in real-time by sender, facility, severity, and message content for easy rule creation and to quickly identify important messages and troubleshoot environmental issues more rapidly. This simple and easy to use solution allows IT staff to associate alert conditions with automated fix actions for known solutions or send a notification to bring attention to a developing condition. A wide range of systems and applications are supported, including Linux/Unix servers, routers, and switches.
Filter: Customize syslog collection on basis of type, log, event ID, description, source, or user.
Analyze: Consolidate the most important events from across all your servers into one centralized real-time view.
Alert: Set notifications to take place as soon as a failure or error occurs, or a customizable threshold has been reached, and then simultaneously initiate automated remediation actions.
Continue Your Research on How to Isolate and Prove Root Cause of End User Experience Issues
