Expert Blog
Citrix Troubleshooting: How to Resolve ‘Citrix is Slow’

The complexity of finding root cause isn’t within Citrix itself, but rather the supporting IT elements that surround the Citrix farm and the lack of visibility that most IT professionals have into that environment. Free tools, like Citrix Director, do not provide visibility into early stages of the logon, app availability, backend systems (Active Directory, Profile Servers, Licensing Servers), virtual servers, user devices, printers, or storage. And if you are in healthcare, the complexity only increases when you add in your EHR systems (Cerner, Epic, MEDITECH, Allscripts) and do not have the data to identify if the root cause of poor performance is with the EHR system or the infrastructure supporting it.
In order to make troubleshooting “Citrix is Slow” easy, IT professionals need purpose-built tools that leverage embedded intelligence and automation to anticipate, troubleshoot, and prevent end-user experience issues regardless of where IT workloads or users are located.
Troubleshooting Requires Visibility
Goliath provides complete end-to-end visibility into the underlying virtualization delivery infrastructure, including specific details on the end user – all from a central console. This enables IT administrators to quickly pinpoint true root cause for troubleshooting and reach resolution from an integrated view of the entire virtualization delivery infrastructure – not just one element of it. As depicted in Figure 1 below, Goliath provides broad metrics across the 15+ systems that work together in concert to deliver the user experience.
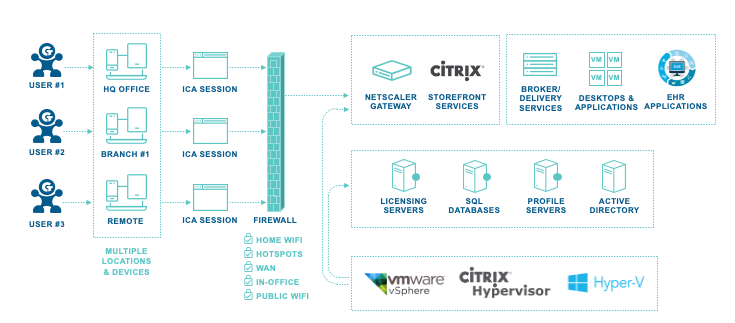
Figure 1: To deliver an end-user experience on Citrix, it requires over 15 technologies to work together in concert. In order to troubleshoot root cause of an issue, you need a purpose built tool like Goliath that can give you visibility into each of these touch points.
Troubleshooting Requires Embedded Intelligence and Automation
A good troubleshooting tool will automatically and intelligently map out your entire infrastructure to deliver end-to-end visibility around the health of your system. In doing so, an IT administrator can quickly identify where an issue could be and even be alerted proactively of the issue before an end user is impacted. Goliath offers an Automatic Citrix Discovery and Dependency Map. In this single, macro view, administrators are given the ability to monitor, manage, and troubleshoot issues with Citrix whether the root cause is the Citrix infrastructure or the supporting IT elements. It shows the overall health of your environment at a glance and provides context-sensitive supporting metrics and details as you select each element. You can drill down and dynamically examine your environment and troubleshoot issues more easily since everything is logically broken down.
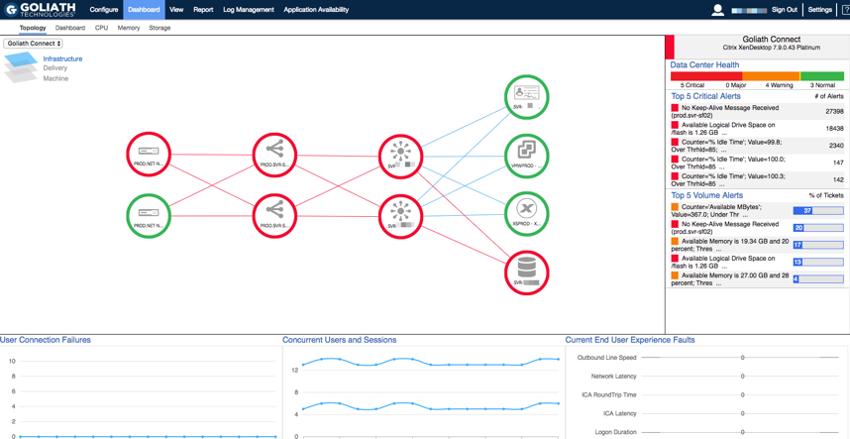
Figure 2: Automatic Citrix Discovery & Dependency Map
- Automatic mapping your entire Citrix infrastructure to visualize connections, relationships, and health of components.
- Ability to easily switch views to different data centers or locations.
- Correlation of end-user experience issues to delivery infrastructure components and overall health of the system.
- Context-sensitive metrics and alerts for selected components.
Troubleshooting Logon Initiation
Goliath is an early-warning system that specifically solves logon initiation problems. The Goliath virtual user automatically logs on and launches applications before your users get to work. This proactively confirms the virtual application and desktop delivery infrastructure elements are working together properly, and, if not, a real-time alert is sent isolating the failure point so the issue can be resolved before end users are impacted. This goes far beyond a simple simulator–real logons and sessions are created from your key user locations and confirm availability.
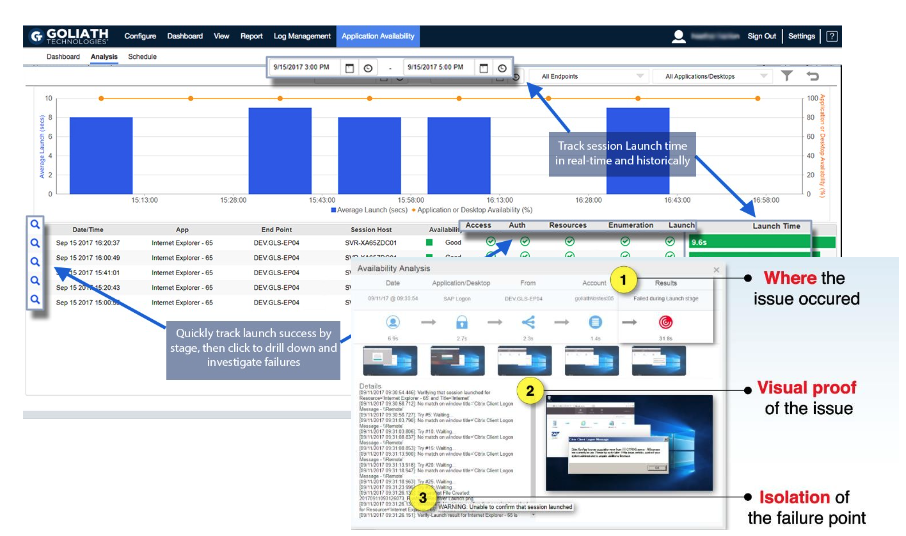
Figure 3: Goliath Application Availability Monitor attempts to logon exactly as your end users would – manually, going click-by-click, to provide the industry’s only solution providing authentically verifiable accounts of logon success or failure.
- Highlight of where the issue occurred during logon.
- Visual proof that an issue did occur.
- Isolation of the failure point.
Troubleshooting Logon Duration
The Goliath Performance Monitor offers unparalleled visibility into the sub-stages of the complex Citrix logon process. It breaks down the 9 main stages provided by Director and other tools into the 33+ detailed stages. By breaking down the main stages into more detailed sub-stages, Goliath pinpoints the true root cause of logon duration issues. For example, other tools can show that the GPO phase is running slowly, but Goliath provides a list of all GPOs accessed in that phase and the specific GPO or combination of GPOs responsible for slowness. This unique detailed view means it is much faster for IT professionals to identify and troubleshoot the problem.
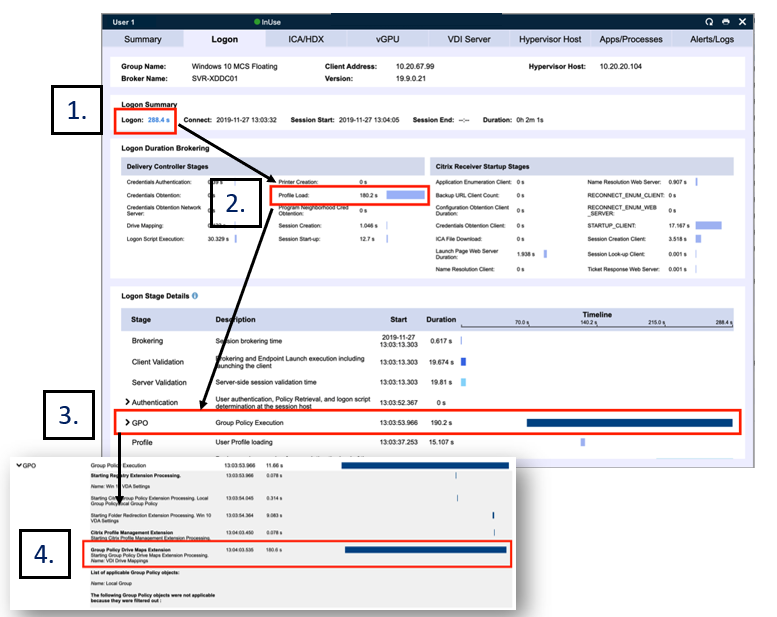
Figure 4: Goliath captures key details unavailable to Citrix Director & MAS and shares deep metrics in a single console to help you anticipate, troubleshoot, and document logon issues. In one screen, Goliath allows you to:
- View logon time.
- Quickly identify profile load consumes the most time.
- Confirm the Group Policy extension in Logon Stage Details consumes the most time.
- Open Group Policy detail to find a map extension is incorrectly mapped.
Troubleshooting Session Slowness
When ‘Citrix is slow’ means in-session performance issues, these issues are caused by network issues, server resource issues, or end-user behavior. The challenge is that, while many tools can provide ICA RTT and confirm that there are session slowness issues, they lack specific detail to identify the true root cause of those performance issues. The Goliath Performance Monitor uses deep Citrix API integration to break down ICA RTT into unique metrics that pinpoint the root cause of session slowness. Goliath measures actual network speed and bandwidth within Citrix to see if slowness is based on network issues, while application and server metrics may indicate that resource issues impact performance. Finally, the application shows specific end-user activity in terms of both specific applications and websites uses, as well as detailed ICA channel performance, to see if the end-user behavior is responsible for session slowness.
In each of these cases, it’s important to note that Goliath maintains this same level of detail for historical sessions. While other tools provide only real-time data or a limited historical view, Goliath allows you to keep your data over time. This is invaluable to troubleshooting efforts because it becomes easy to identify patterns over time that help pinpoint root cause quickly.
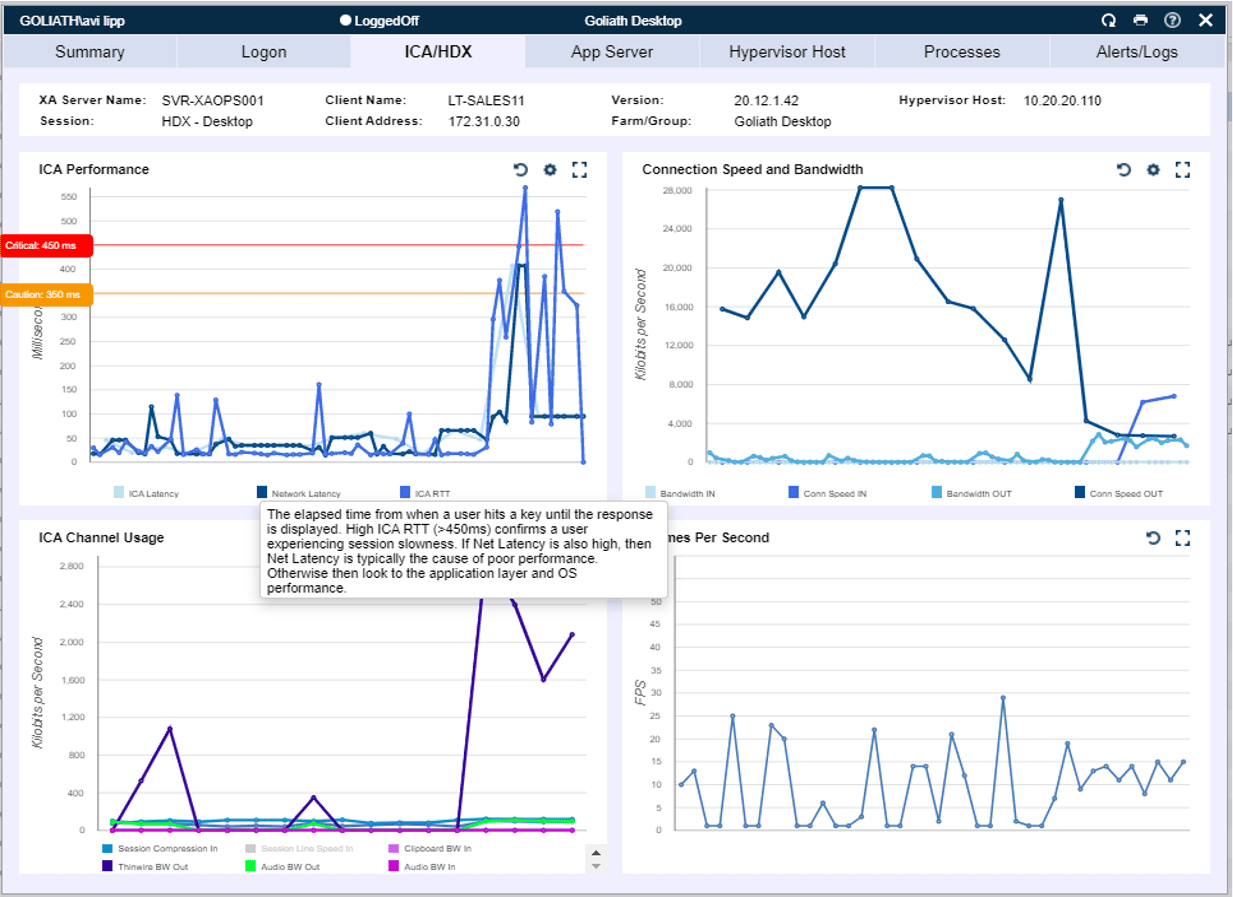
Figure 5: Goliath provides industry-leading visibility into Citrix session performance by breaking down the ICA/HDX protocol and returning precise metrics around individual ICA/HDX channel performance.
- Identify when network latency is causing ICA/HDX latency by correlating 3 metrics: ICA Latency, Network Latency and ICA Round-Trip Times.
- View the end-user’s connection speed for Citrix.
Goliath can take what might otherwise be an extraordinarily difficult troubleshooting task and reduce it to a few mouse clicks, all the while maintaining a focus on improving the end-user experience. Goliath specifically concentrates its troubleshooting efforts around looking for problems tied to login initiation, logon duration, and session performance, since these account for about 95% of the problems encountered in Citrix environments.
Try Goliath For Free
Experience true end user experience monitoring and troubleshooting free for 30 days.
