The following is a real use case about how a large health system with a VMware vSphere & MEDITECH environment deployed vSphere performance monitoring to proactively fix end user performance issues.
About a month ago I was working with a new customer who was implementing the Goliath’s VMware vSphere Performance Monitoring for the first time. This healthcare system includes 4 acute care hospitals and a number of other healthcare related facilities.
The healthcare system has over 200 VMware vSphere VMs supporting their 5,000 MEDITECH EMR/EHR users. Their primary concern was putting a stop to “end user alerts” resulting from application and server issues.
The goal was to help our customer set up our proactive vSphere performance monitoring technology to send real-time alerts of impending issues so their team can troubleshoot VMware vSphere and MEDITECH problems before end users are impacted. This proactive approach to vSphere performance monitoring, using our threshold-based alerting and remediation, allowed them to reduce support tickets by 32% in 90 days.
In the remainder of this post I will explain how our team at Goliath achieved this goal, and how we took this a step further using the VMware vSphere monitoring, troubleshooting, and remediation facility in our product. Our customer was pretty pumped about the results when we finished.
Why VMware vSphere performance issues are difficult to catch in time
In my experience, performance issues in the VMware vSphere stack are difficult to catch in time because there’s either a lack of visibility (some element isn’t being monitored), there are too many different tools monitoring VMware vSphere the whole stack, or sometimes people don’t even know what to monitor.
Eliminating monitoring tool bloat
Goliath Performance Monitor for VMware vSphere brings together functionality in one product that I typically see in multiple products. I will not bore you with feature dumps in my post but there are two meaningful points to make:
- Goliath has one for VMware vSphere monitoring. We monitor the full virtual stack including Host, VMs, Applications, OS, and Hardware. This is important because it both reduces the complexity of VMware vSphere performance monitoring and eliminates blind spots and false positives which are common in products that don’t monitor the full virtual stack.
- Goliath gives you real-time alerts based on thresholds, events, and faults to proactively keep you aware of performance issues before end users complain. Note: products that use WMI can’t be real time. If you ever used it, you already know this.
Setting up VMware vSphere monitoring rules & alerts
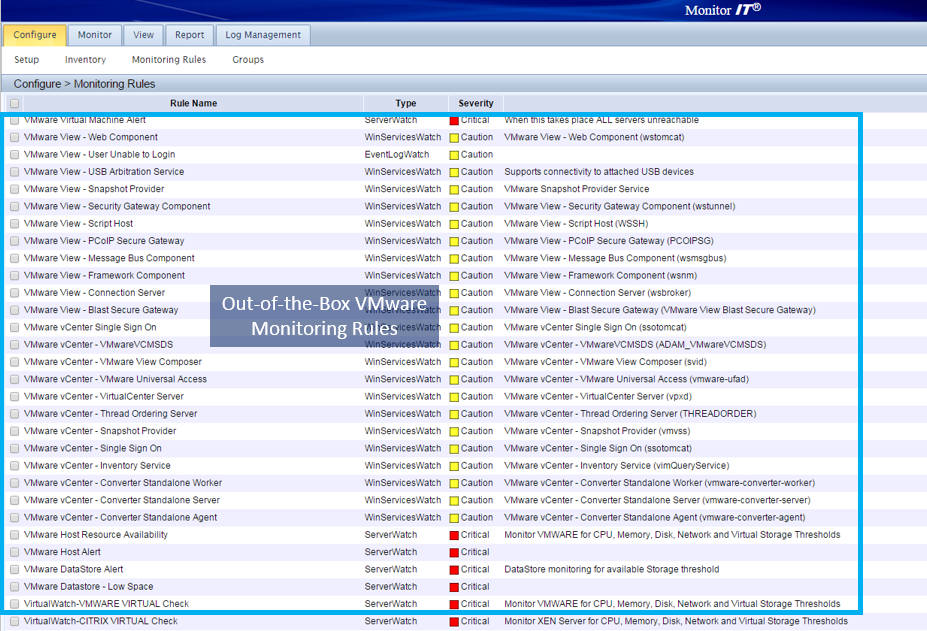
First we set up our VMware vSphere Monitoring Rules and real-time alerts. Keep in mind these are all out-of-the-box, meaning that the VMware vSphere monitoring expertise of knowing what conditions to look for or monitor are already pre-loaded into the base product, as are the alerts.
So the vSphere monitoring rules tell the product what conditions to look for on the hypervisor, virtual machines, OS, applications, and hardware. The vSphere monitoring rules also contain the alerts that will tell you in real time if a trigger event has taken place.
Below is a screen shot of some of the alerts that are automatically deployed post-install (not the actual customer’s). You can see that the product is looking for conditions such as resource utilization and threshold breaches for VMware host and VM resource utilization.
It is also checking to make sure VMware vCenter and its dependencies are running, and if they are not, restart the service. There are also alerts regarding VMware DataStore usage as well and log analysis for VMware failures and errors.
Out-of-the-Box Monitoring Rules Trigger Real-Time Alerts
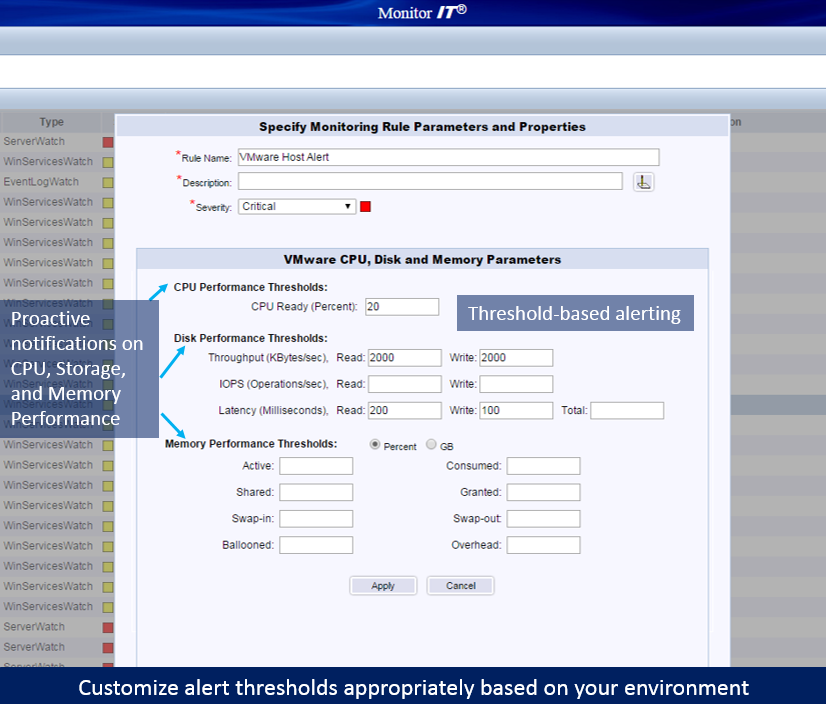
The customer then wanted to configure alerts based on specific thresholds that took into consideration the unique requirements of an “always on” Healthcare IT department. Specifically, they wanted thresholds on the VMware vSphere servers hosting MEDITECH, set lower than we typically would, at least initially, to give quite a bit of advanced notice so they could be sure they could fix the issue before anyone was impacted.
In the screenshot below, they used the VMware Host and VM Alert to configure VMware alert to alert on a host with high CPU, Storage Latency, IOPs, Throughput Utilization, as well as Memory Provisioning Thresholds.
The key vSphere performance monitoring metrics they were particularly interested in alerting on was Storage Latency, CPU Ready, Memory Swapping, and Ballooning as they were good indicators of resource conditions affecting application experience and a cause of slowness.
Will threshold-based alerts cause “alert storms”?
Now, with all of these alerts the question was, as it always is, “will I be inundated with alert storms?” We want to send useful alerts and minimize the noise because too many are as bad as none.
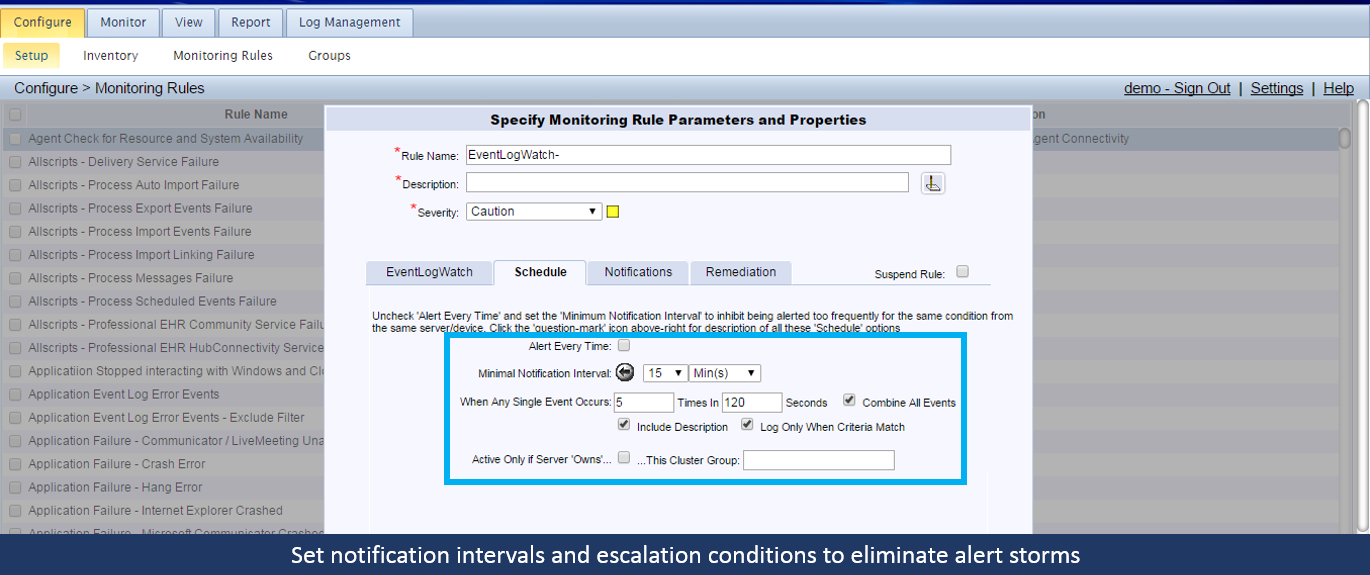
In the screenshot below, we use the ‘Schedule Tab’ of a vSphere performance monitoring rule to specify how often we’d like to be alerted. In this case, you can see the rule is set to alert immediately and then every 15 minutes for an ongoing condition. So, the vSphere performance monitoring is customizable.
Furthermore, it will group together concurrent events when there is a flapping condition into a single alert, to mitigate alert flooding.
Setting up remediation actions
Finally, we set up remediation actions. The customer was super impressed with this functionality. They were aware that the Goliath Performance Monitor for VMware vSphere monitoring had functionality in this area, but they didn’t know the power of it until we were able to dig in deep while activating and configuring the vSphere monitoring technology.
There are a few things to point out here. First, remediation actions only happen automatically if you want them to. It is your call and you are in control. Second, they can happen simultaneously with an alert being triggered so you know that there is a vSphere remediation sequence taking place.
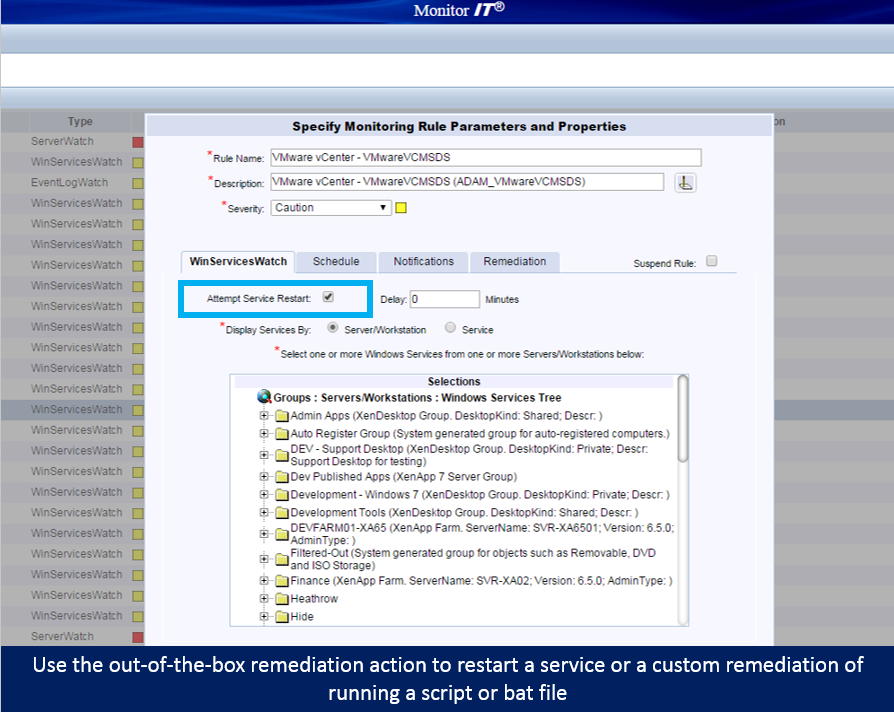
Common vSphere remediation actions I have seen are simple actions like restarting a vSphere VM or throttling an application with a CPU or memory leak and executing a workflow to reset a hung backup job and then kicking it off again from the main controller. Also, you can execute any .bat file, powershell, or script so the possibilities of what you can do with our remediation engine are pretty much endless.
In the screen shot below, you can see that this particular vSphere performance monitoring rule is utilizing Goliath’s out-of-the-box remediation action of restarting a service. Therefore, if this particular VMware Directory Services service is stopped for any reason or affecting authentication to vCenter, GPM will alert you in real-time and then restart the service to get it back up and running.
These are only a few key functions, but they were hugely impactful to this customer. Over the last month, they reported that downtime has significantly decreased. They have also adjusted thresholds to higher levels as they have become more comfortable with the environment’s performance level and capacity.
As a result of the deployment of a comprehensive VMware vSphere Performance Monitoring Solution support tickets dropped by 32%. In other words – success!
If you have a comments or question, please leave it in the comments section and I will be quick to respond. And to see all of this for yourself, try a 30-day free trial or demo of Goliath’s proactive VMware vSphere performance monitoring software.


