Editor’s note: this post is from Mike Tremel, Sr. Systems Engineer VCP5-DCA at Augusta Health. Mike explains how his Healthcare IT team proactively reduces troubleshooting tickets and improves remediation time by combining data from MEDITECH, Citrix and VMware in a single performance monitoring console.
The Challenges Facing IT
Augusta Health is a community hospital with 4,000 MEDITECH end users and 255 physicians. The challenge was that we lacked a purpose-built technology that brought together the three key components of the IT infrastructure that impact the end user experience with our EHR application:
- MEDITECH
- Citrix XenApp
- VMware
Not having a single software solution that gave us visibility and performance data from MEDITECH, Citrix XenApp and VMware caused significant issues when we attempted to resolve complaints or support tickets that claimed MEDITECH was slow.
Historically, our IT team deployed multiple products and utilities to manually disqualify each potential failure point until we determined the root cause. The other problem was that we spent more time figuring out what wasn’t causing the end user performance issues than what was.
Achieving Proactive with a Simplified Solution
While we were working to find fixes for performance issues, we began defining specific IT requirements for a technology that would solve our problems based on the gaps in visibility, such as:
- MEDITECH servers and how they are performing
- Deep performance metrics on Citrix XenApp and all of our VMware virtual machines
- End user experience, such as Citrix logon duration and Citrix HDX & ICA latency
As a Healthcare IT team we agreed that the ultimate solution would simplify the process of EHR/Citrix/VMware performance monitoring, close our gaps in visibility and bring all of this data into one console.
As we searched for the type of solution we envisioned, we realized it would require a tremendous investment in licensing, consulting, customization or deploying multiple products. And although VMware offers vCenter Operations Manager, it doesn’t give visibility into any data outside of VMware, like MEDITECH and Citrix, so it required us to consider additional products to find and fix the root cause of end user performance issues.
The Solution
We reviewed other very good technologies such as ControlUp and eG Innovations, but we selected Goliath Technologies. Their software was right for us because it brings together, in one console, the performance metrics for MEDITECH, Citrix XenApp, and VMware.
How Augusta Health Uses Goliath’s MEDITECH Performance Monitoring Module
Here’s how we leverage Goliath’s technology:
- Reduced troubleshooting times by being able to see at a glance our entire MEDITECH and VMware server infrastructure so we can quickly rule things out as potential root cause issues. For instance, I can quickly rule out host, storage latency, memory and CPU on all my MEDITECH and VMware servers.
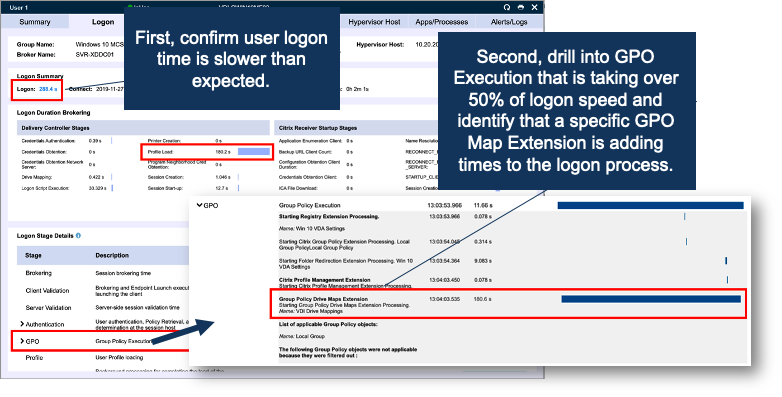
- Improved end user performance and putting a stop to the blame game. If I have an end user complaining that MEDITECH is slow I now have actual data on whether it is actually slow or not and why. I am armed with real time details of each logon stage and Citrix ICA channel utilization to more effectively determine the root cause of “slow.” The blame game is stopped cold with objective evidence as to the root cause of the issue! And, more often than not, it isn’t the MEDITECH application.
- Documenting the end-user experience on Citrix using performance metrics pertaining to a user’s Citrix session (both logon times and performance in session) allows us to compare and contrast reported slowness to actual values and trends over time. We sometimes get reports that “my logon time this morning was a lot slower than yesterday,” or “it has taken longer to login every day this week.”
- Proactively manage MEDITECH by using the purpose-built module to see many key metrics like queries in/out and read & write times to each of our file servers. By routinely watching these metrics, we can see how performance changes over time; and not just when there are reports of slowness, but also during “normal” times. The Goliath Performance Module for MEDITECH has given us insight into our MEDITECH performance that we didn’t have before.
- Overall the product has given us the ability to see trends over time and build a “benchmark,” which gives us insight to determine if a problem occurs and if it falls into a window of “normal” activity.
All of these features are out of the box. This is only possible because the technology is purpose built for MEDITECH, Citrix and VMware. It only took about a day of consulting for installation, configuration and training. As importantly, a byproduct of being purpose built is that it is easy to use so we utilize the product almost daily for proactive health checks.
To see it for yourself, I encourage you to get a free demo or fully-supported 30 day free trial of Goliath’s MEDITECH Performance Monitoring Module.

