Problem
End users are complaining of slow logon issues and there is no visibility if root cause is within the Citrix Broker Service, an issue with group profiles or even session latency.
Identifying Root Cause: Citrix Broker Service
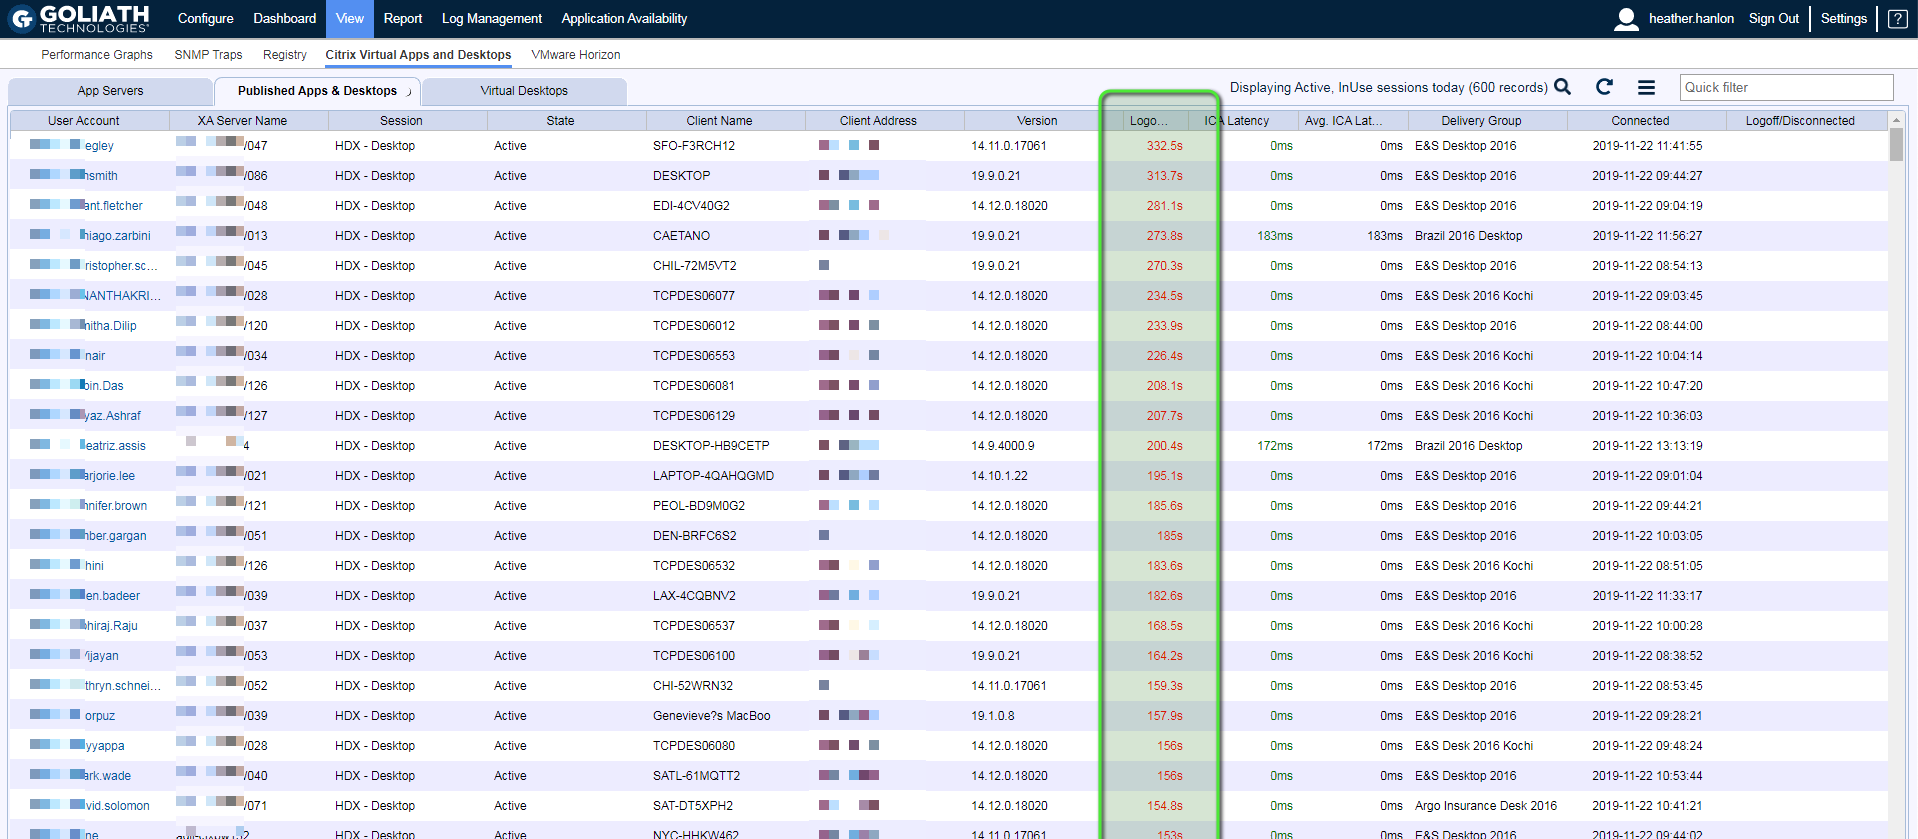
When trying to identify the root cause of a Citrix end-user experience issue, the main display to view all of the Citrix user sessions is the Virtual Apps & Desktops display. To access this display, click View then Citrix Virtual Apps and Desktops. This page is divided into 3 areas: App Servers and Published App & Desktops (for Citrix Virtual App, formerly XenApp, environments) and Virtual Desktops (for Citrix Virtual Desktop, formerly XenDesktop, environments). You’ll want to navigate to the applicable section for your environment (Published App & Desktop or Virtual Desktops) to troubleshoot further.
These displays include user session data (both past and present) that enable you to track the complete user experience through the environment, from the login at the endpoint, all the way through the environment back to the underlying infrastructure. These data points are then presented over the course of the session so you can troubleshoot any issue that takes place during a user’s session (see Figure 1).
In the case of logon duration and the issue where long logons are occurring for different users at different times of the day, you’ll want to use the search button at the bottom of the page to filter the page to match the time period at hand.
Once the page is filtered, you will see the sessions with high logons by sorting the page by the Logon column. Once the page is sorted, you can then use the other columns on the page like Machine Name, Username, Group Name and Start Time to confirm whether any patterns can be identified.
Figure 1 – Citrix Virtual Apps & Desktops page sorted by the Logon column
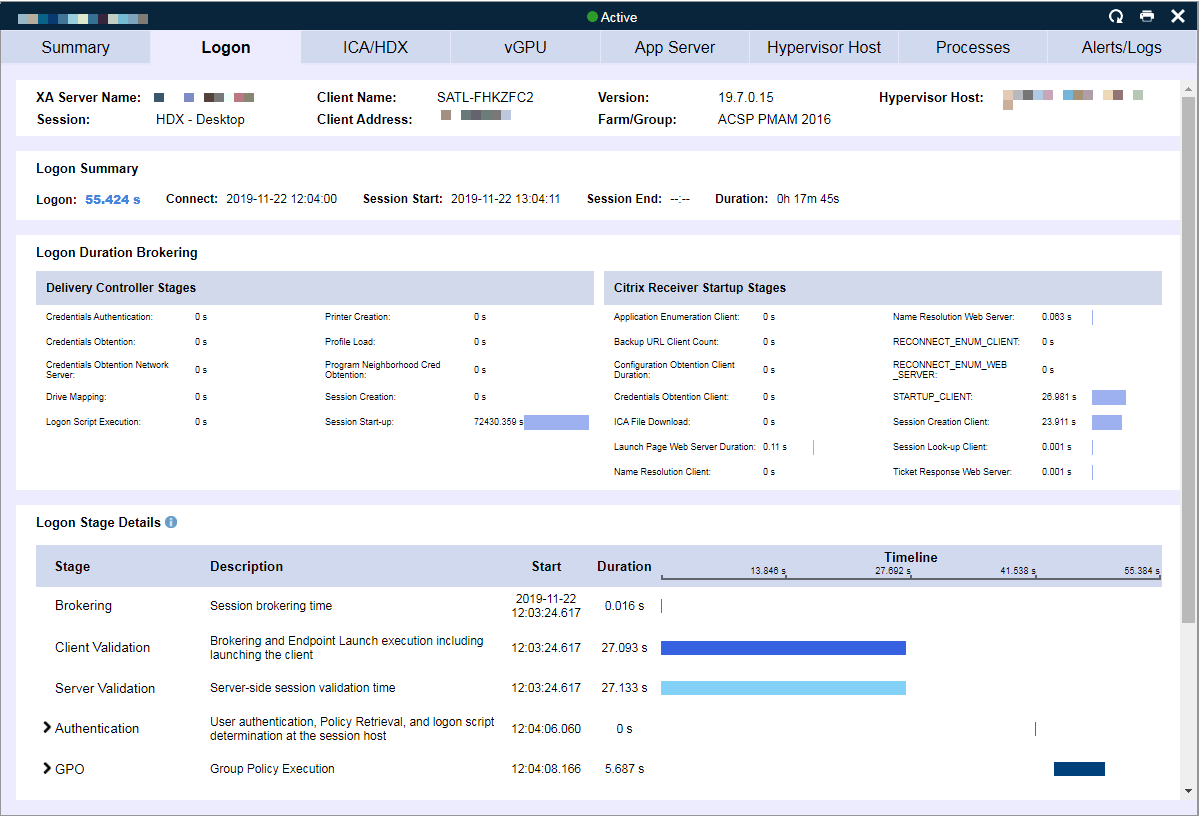
To analyze the 33+ stages of the user’s logon process, you can click on any of the user sessions to drill into the session metrics. Once you’ve drilled down, navigate to the logon duration tab (see Figure 2). This tab is broken into three sections. The top level provides the logon summary showing the high-level stages of the overall logon process, and then the next two sections break down the details of what is happening in the brokering stages and the launch of the session on the App Server or VDI.
The brokering stages in the middle of the dialog enable you to identify slowness due to Citrix Delivery Controller brokering issues including Authentication, Logon Script, Profile Load time, and delays in Windows session creation on the session host. On the client side, you can identify delays in establishing the micro-VPN connection, receiver launch, ICA file download, and more.
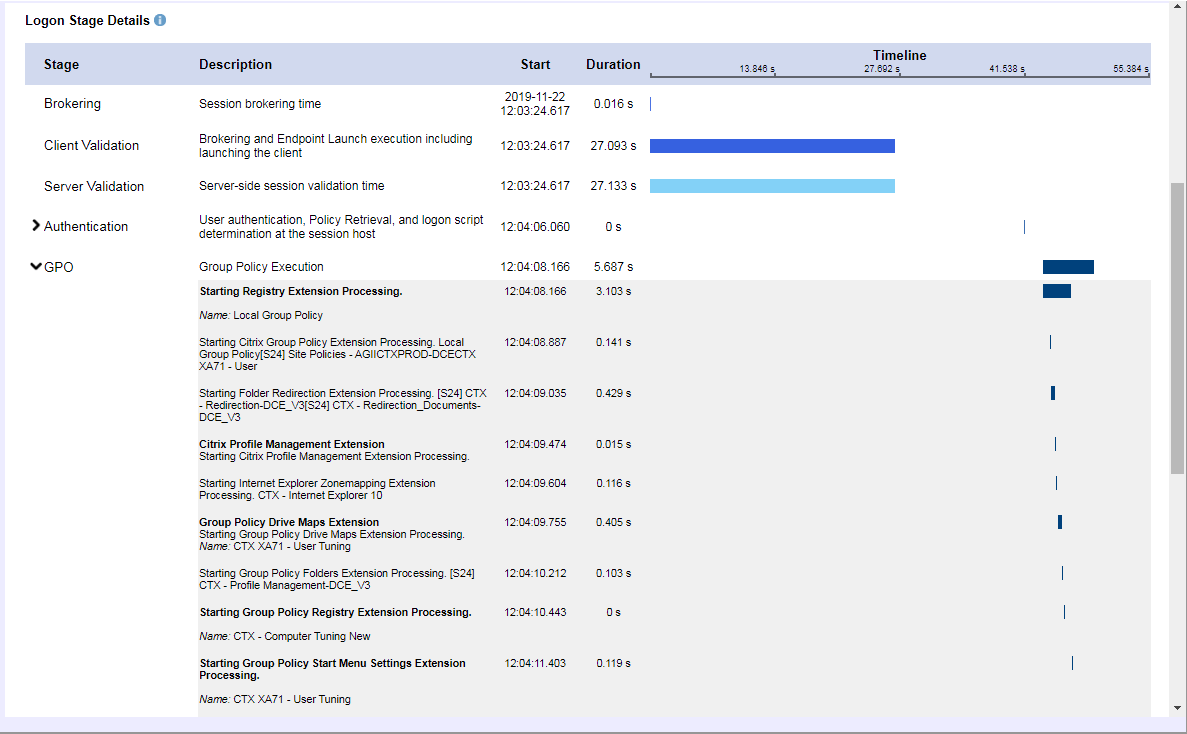
At the bottom of the dialog (see Figure 2.A) each stage of the logon process at the session host process is displayed including authentication at the domain controller, determining how long it took to copy over the policy files to the session host, logon script execution, drive mapping, printer mapping, and folder redirection. Each policy and script which is executed is included in this stage.
Figure 2 – Session dialog – Logon Duration tab
Figure 2.A – Session dialog – Logon Duration tab drill down
When you have many users in the environment complaining about the same issues, in this case logon duration, finding patterns can be key for identifying root cause. One item that is important when troubleshooting logon duration and often the cause of widespread issues, is the time it takes for the brokering stage, which relates to the delivery controller that was used. When the brokering time is consistently high, you’ll want to turn to investigating the Citrix Delivery Controller. By going to the Dashboard > Dashboard page of the technology, this page focuses as a color coded heat map of the entire environment and allows you to drill in on a machine basis to see faults that have triggered on the machine (driven by our monitoring rules), as well as drill into the resource utilization (see Figure 3).
In many cases with our customers, when they drilled into the delivery controller faults, they found events that triggered for high process utilization. In some cases, the process in question was the broker service process itself hitting the memory or page file memory thresholds.
Figure 3 – Dashboard > Dashboard machine drill down
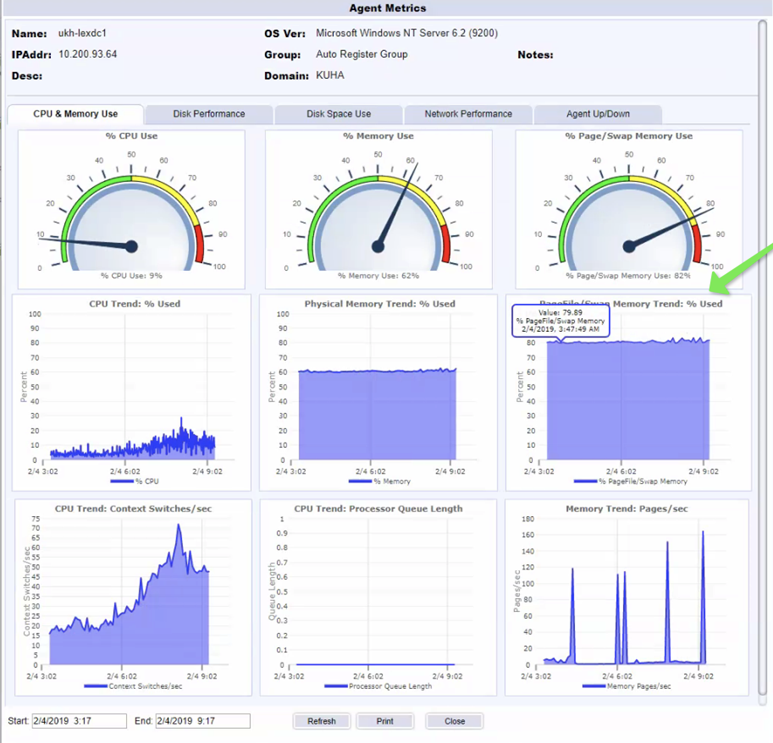
Once seeing the high process utilization, it is then suggested to drill into the server performance to ensure that the Citrix Delivery Controllers are properly resourced. In the screenshot example below (see Figure 4), our customer was easily able to see that their Citrix Delivery Controllers were constantly using lot of page file memory.
Figure 4 – Snapshot Metrics
Root Cause
In the case demonstrated above, reviewing the logon duration metric trends resulted in identifying high brokering times. With deeper investigation, the root cause of the high logon times was a result of an under-resourced Citrix Delivery Controller.


