Faster Insights with Data Visualization
Goliath Technologies correlates performance and usage metrics from end user experiences, Citrix and VMware Horizon stacks, and supporting infrastructure. Organizations can then share, integrate, and enhance this data to gain end-to-end visibility and collaborate with other IT departments, management, vendors, and end users.
With Goliath, customers can also leverage third-party reporting platforms, such as Microsoft Power BI, Tableau, and Microsoft Excel, to further enhance data around end user experiences and the delivery infrastructure (Citrix, VMware Horizon). Goliath offers pre-built templates to simplify the integration with Microsoft Power BI.
Sample Templates for Microsoft Power BI
Example Power BI Templates Available
Goliath Performance Monitor includes pre-built templates that can be easily enabled to generate your own reports in Microsoft’s Power BI in minutes. Here is a sample of some of the pre-built report templates that are included:
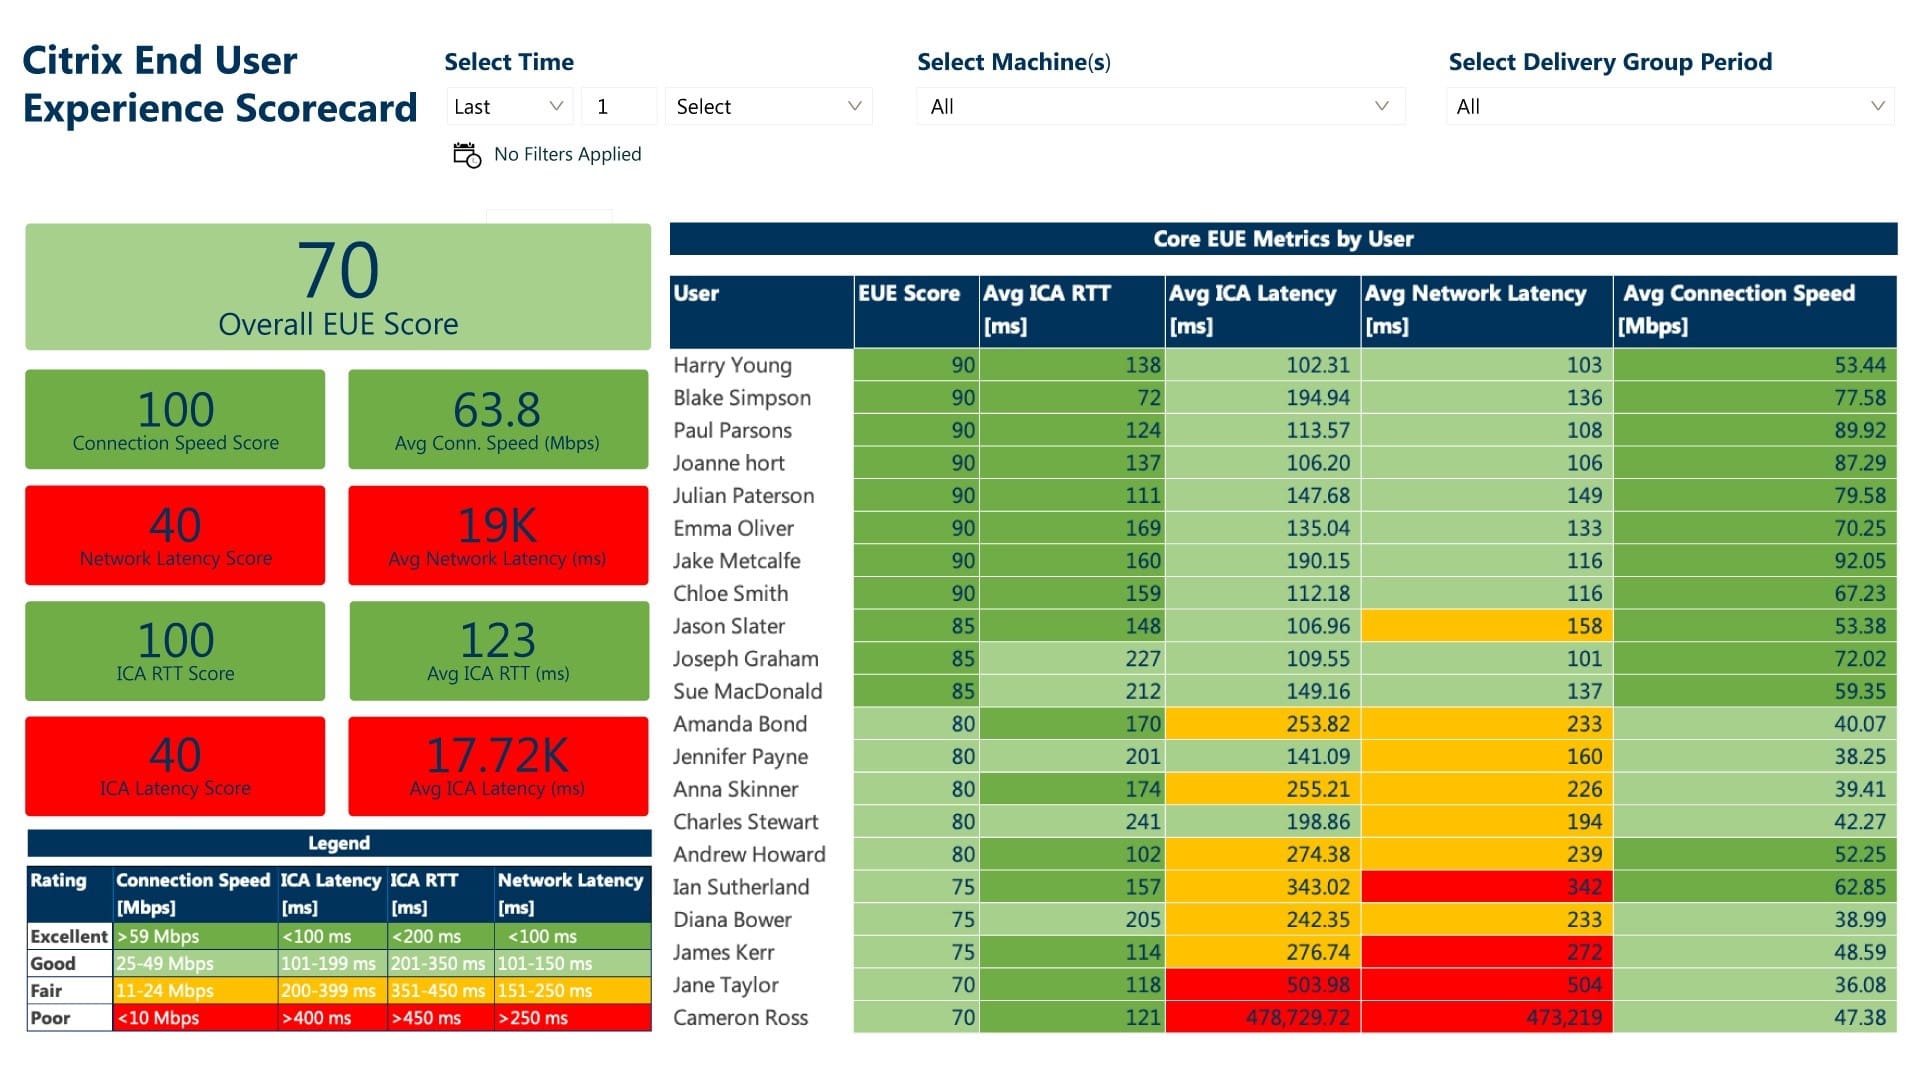
- Citrix End User Experience Scorecard: This report provides a holistic view of Citrix end user experience across all users, and automatically compares performance against internal SLAs and and benchmarks against industry best practices. Data can be filtered by time period, groups, users, or specific machines.
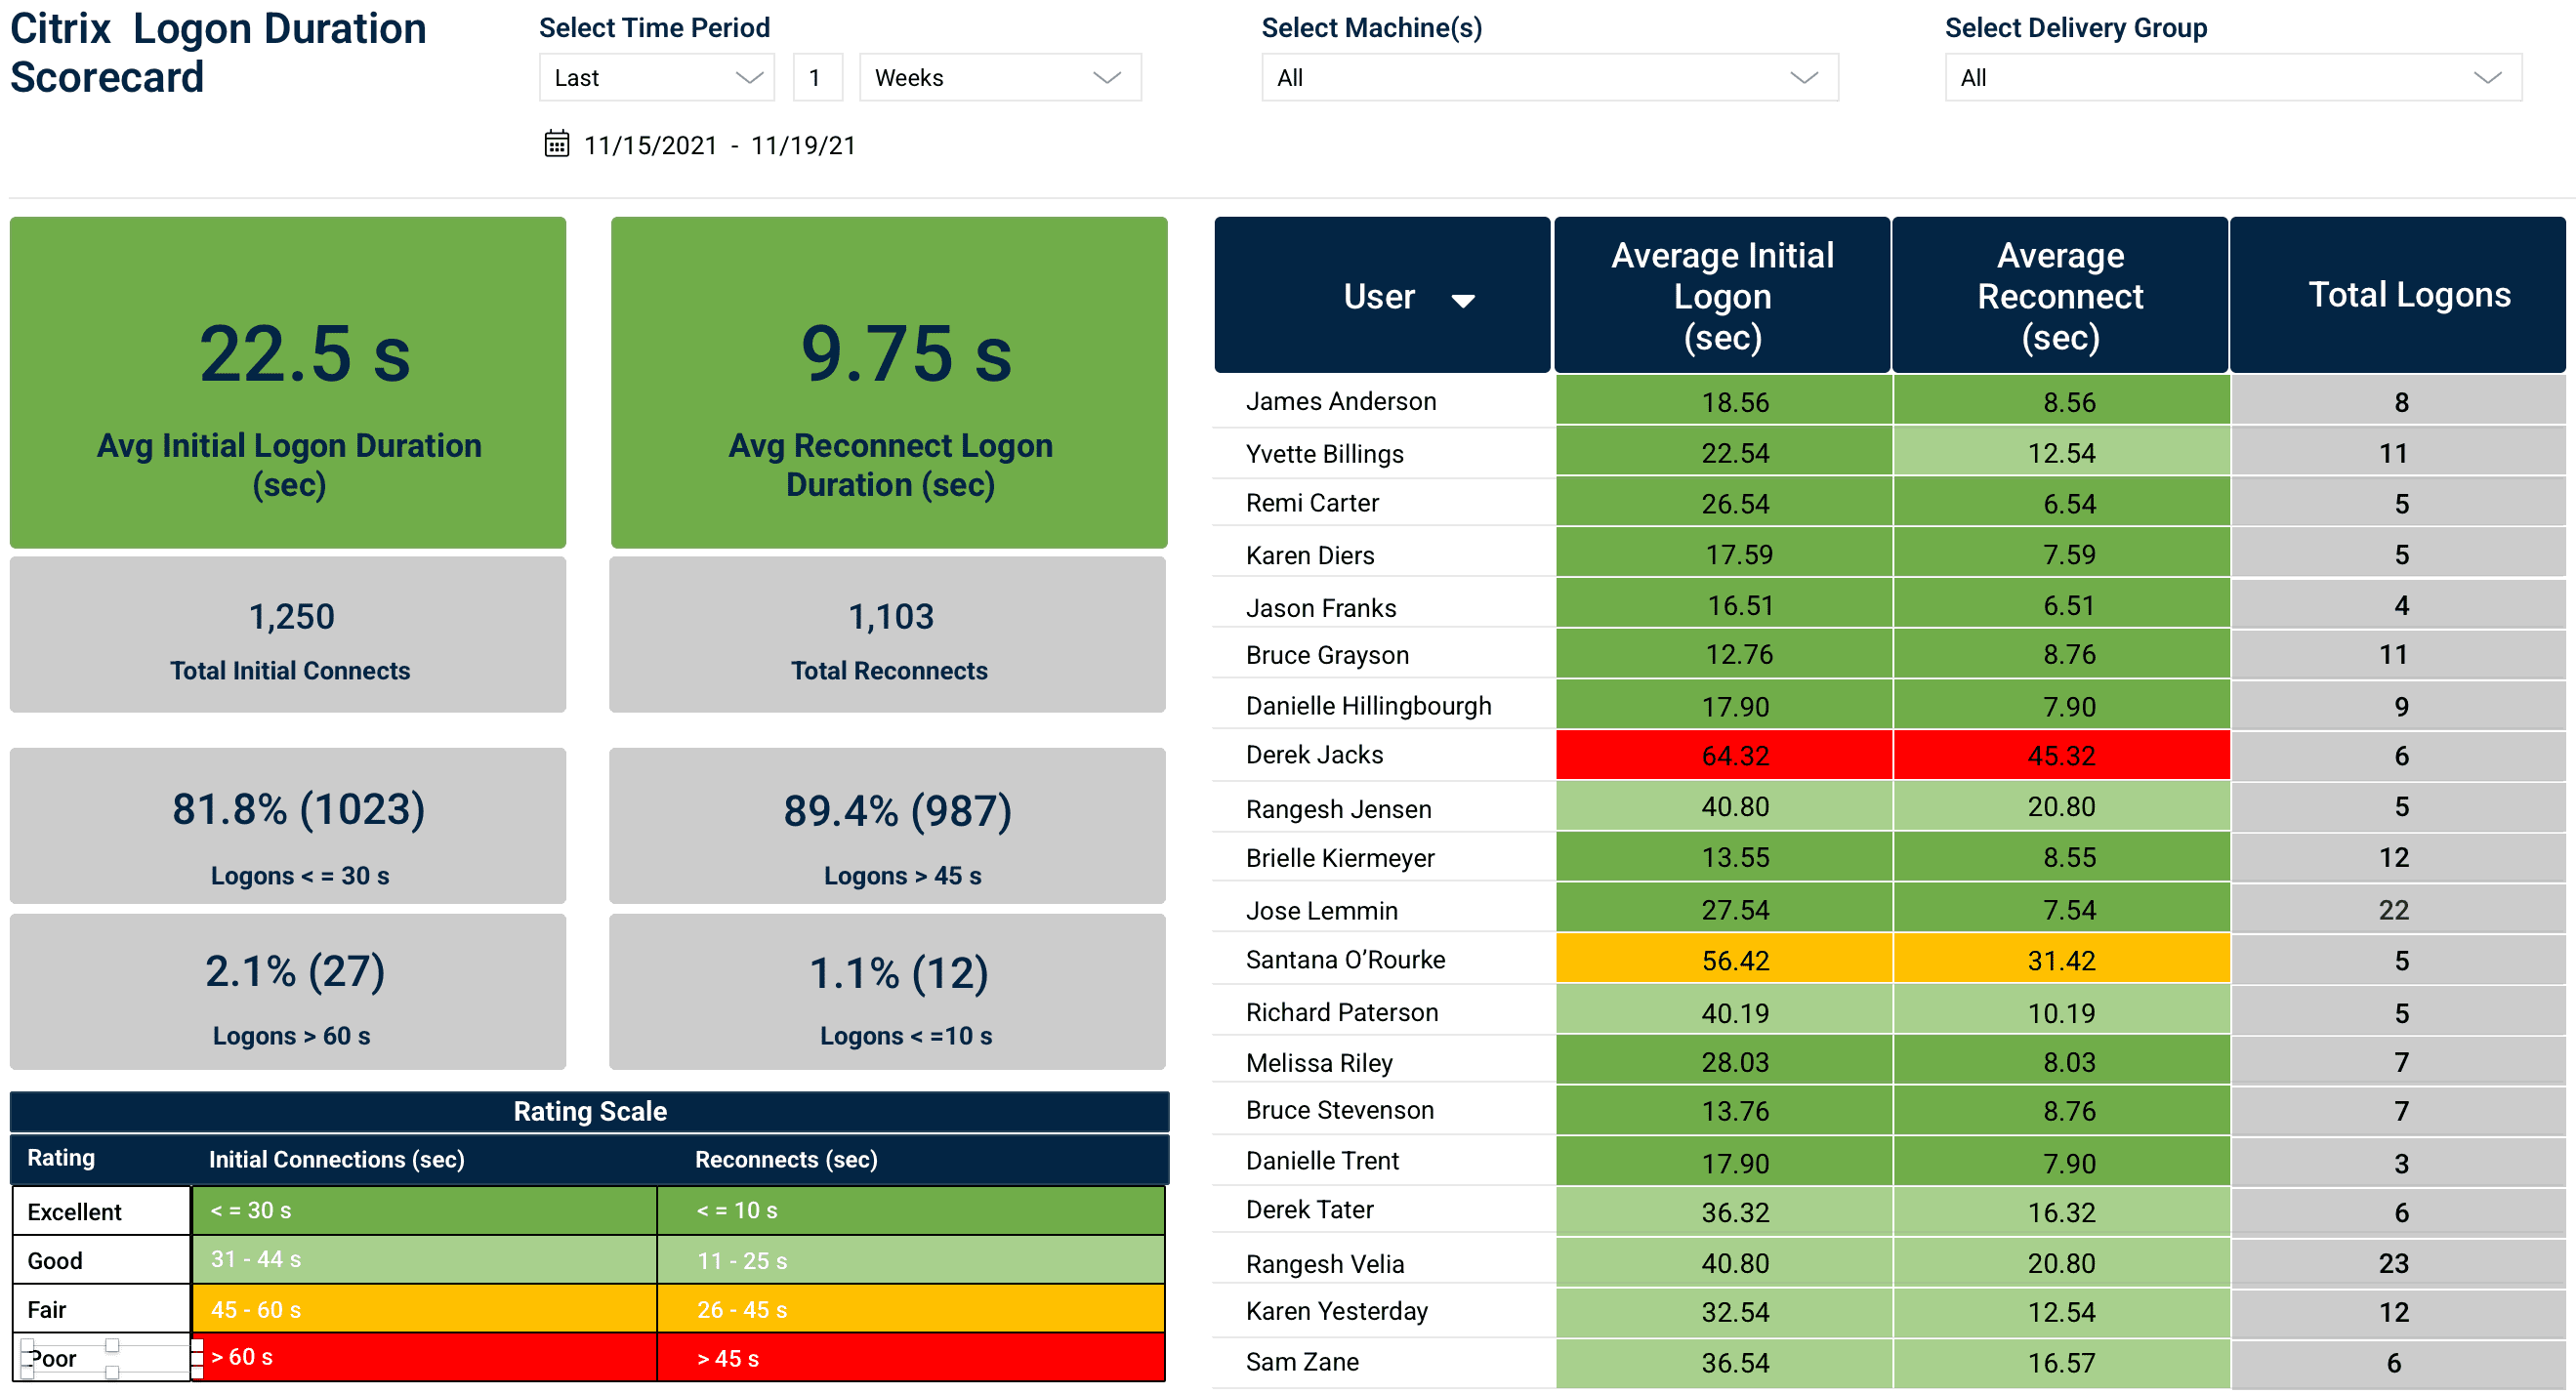
- Citrix Logon Duration Scorecard: This report provides a holistic view of Citrix logon times and experience across the organization, and automatically compares performance against internal SLAs and industry best practices. Data can be filtered by time period, groups, users, or specific machines.
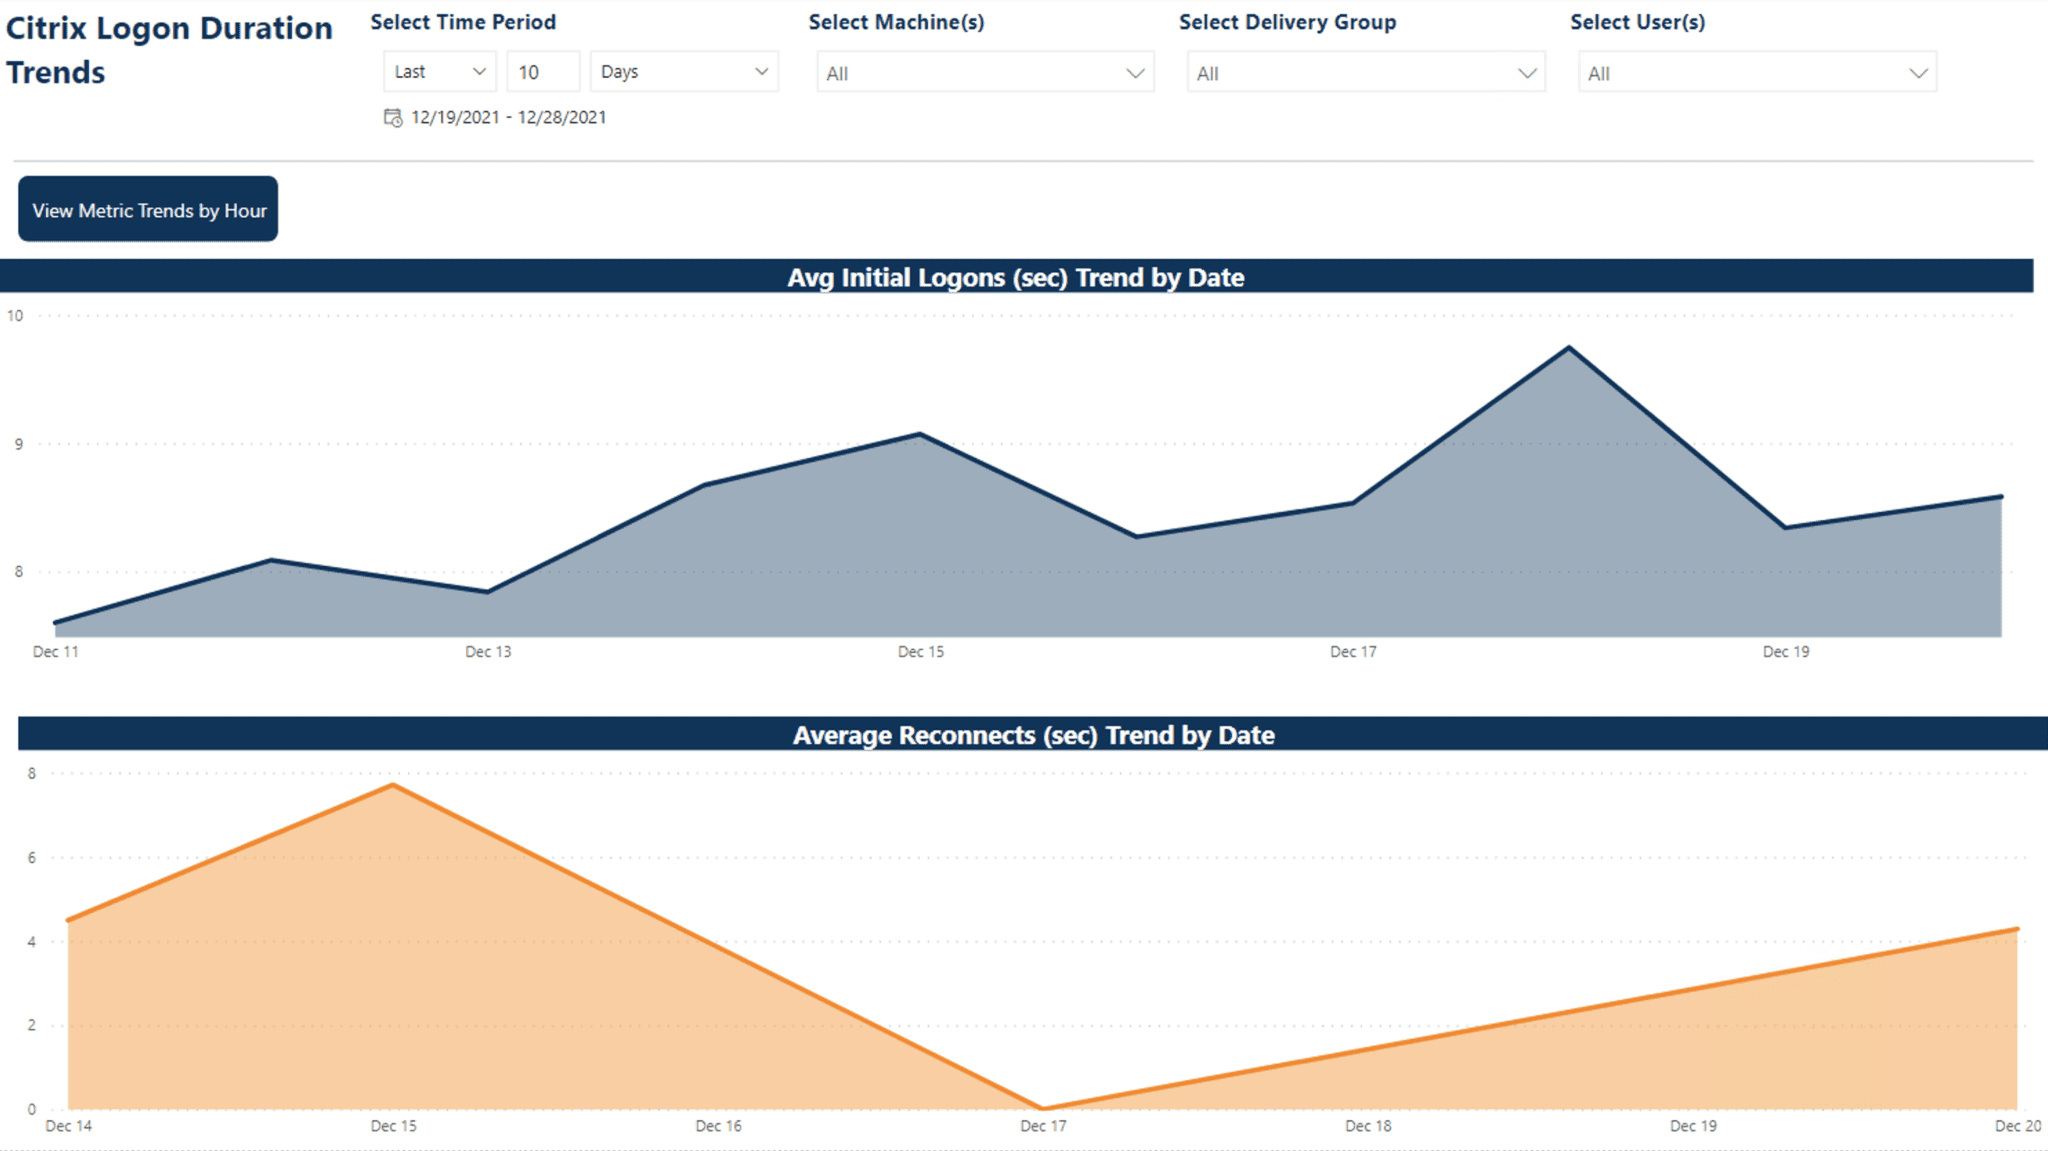
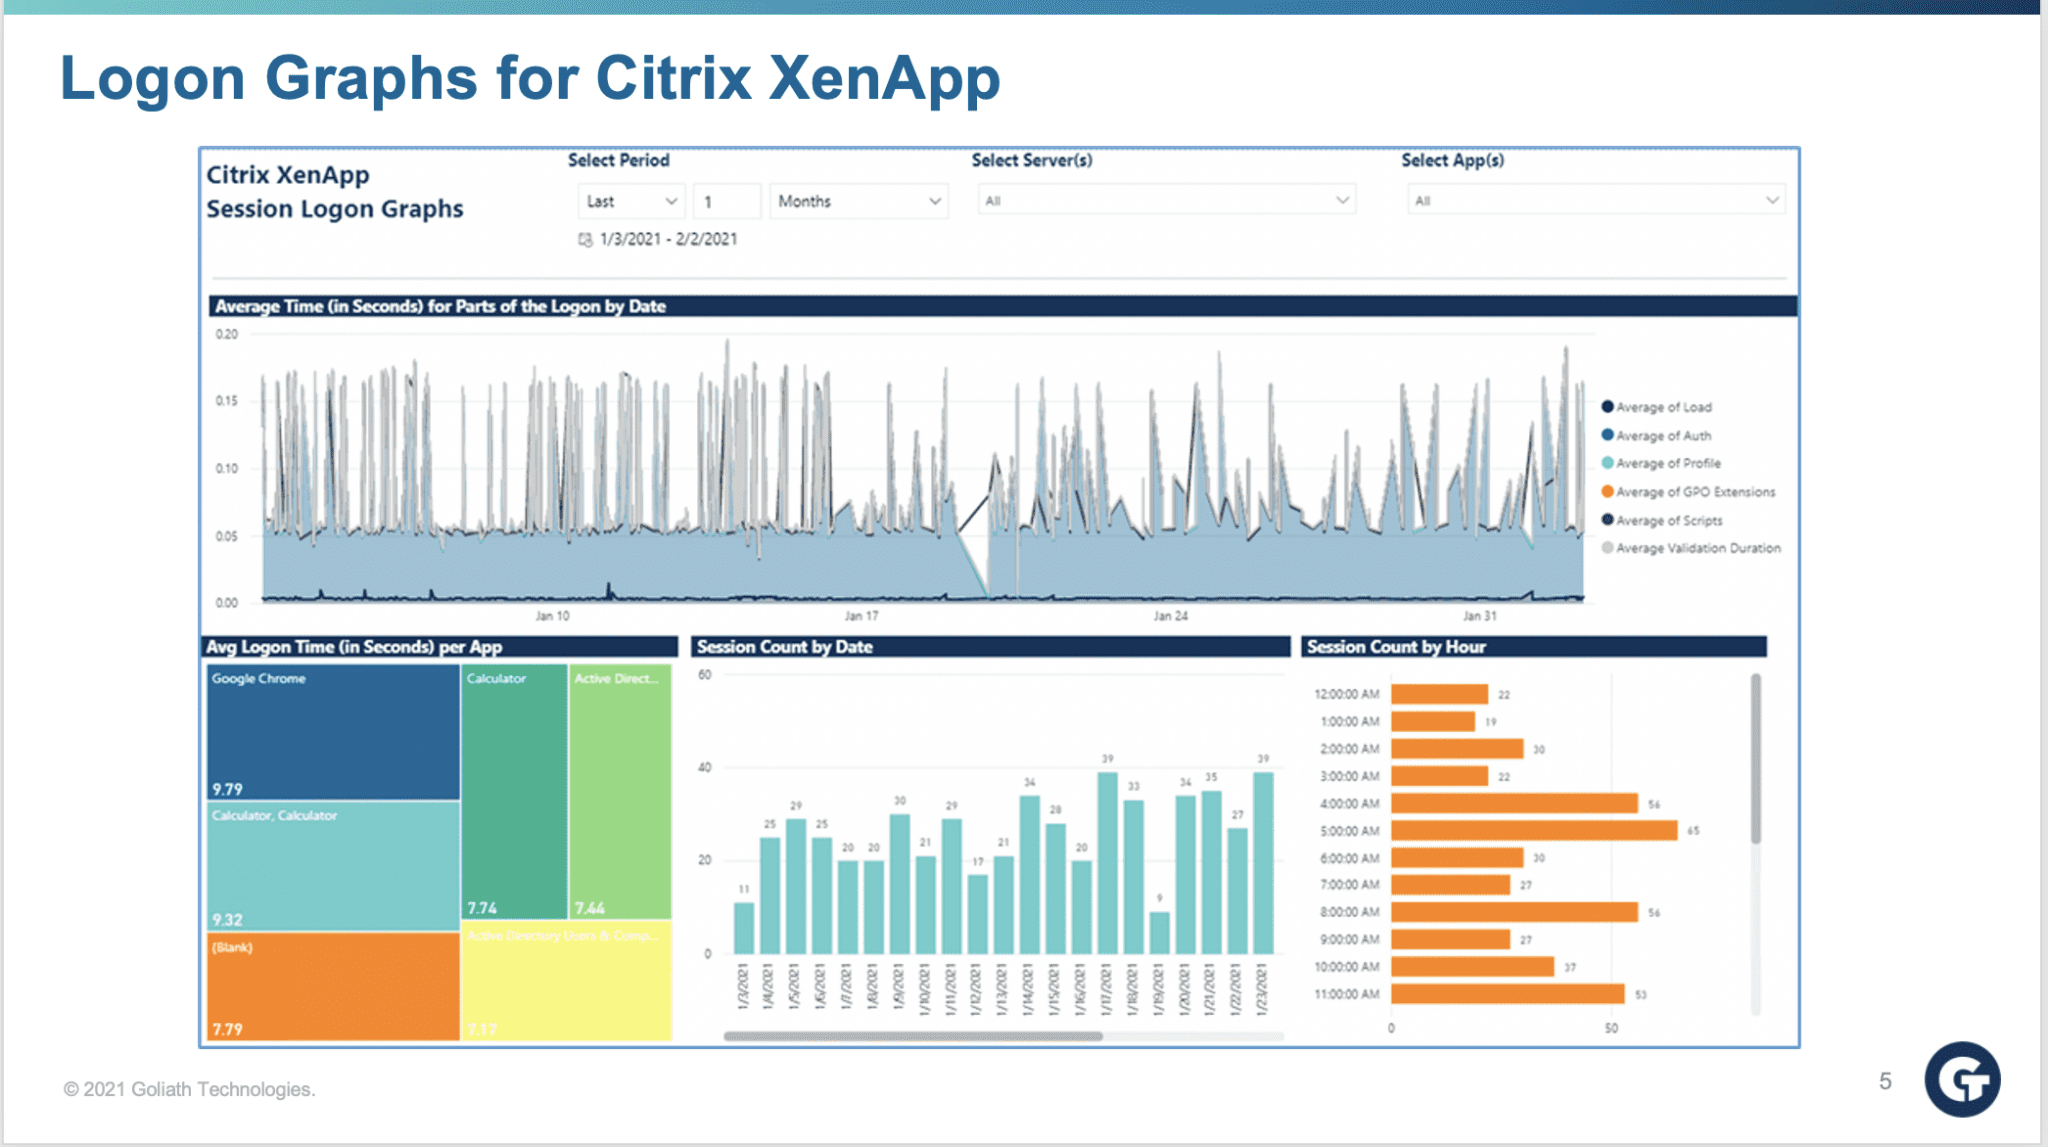
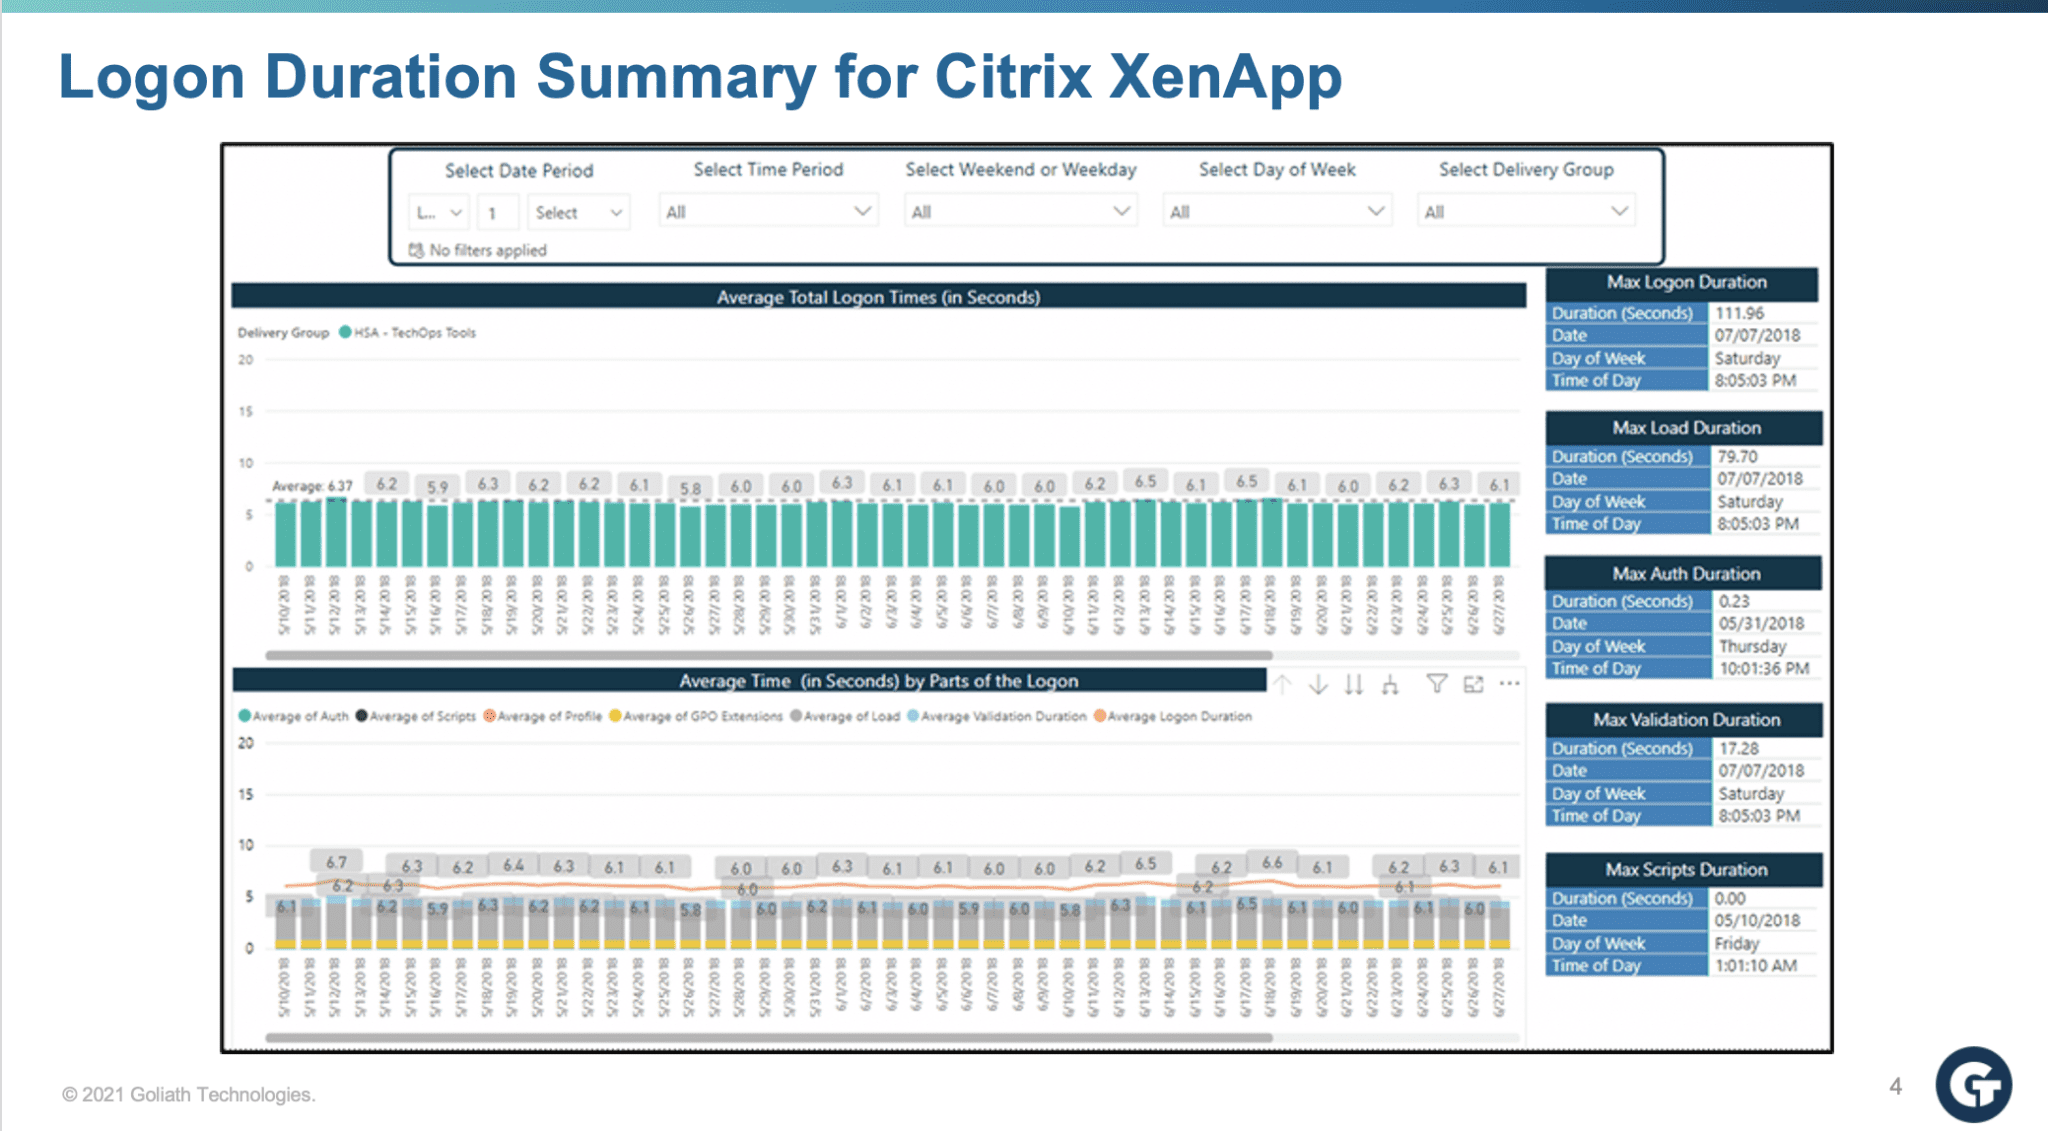
- Logon Duration for Citrix XenApp: Several templates exist reporting average logon times and breakdown per stage over time by delivery group. One template represents logon times graphically with the ability to filter by date, server, and application.
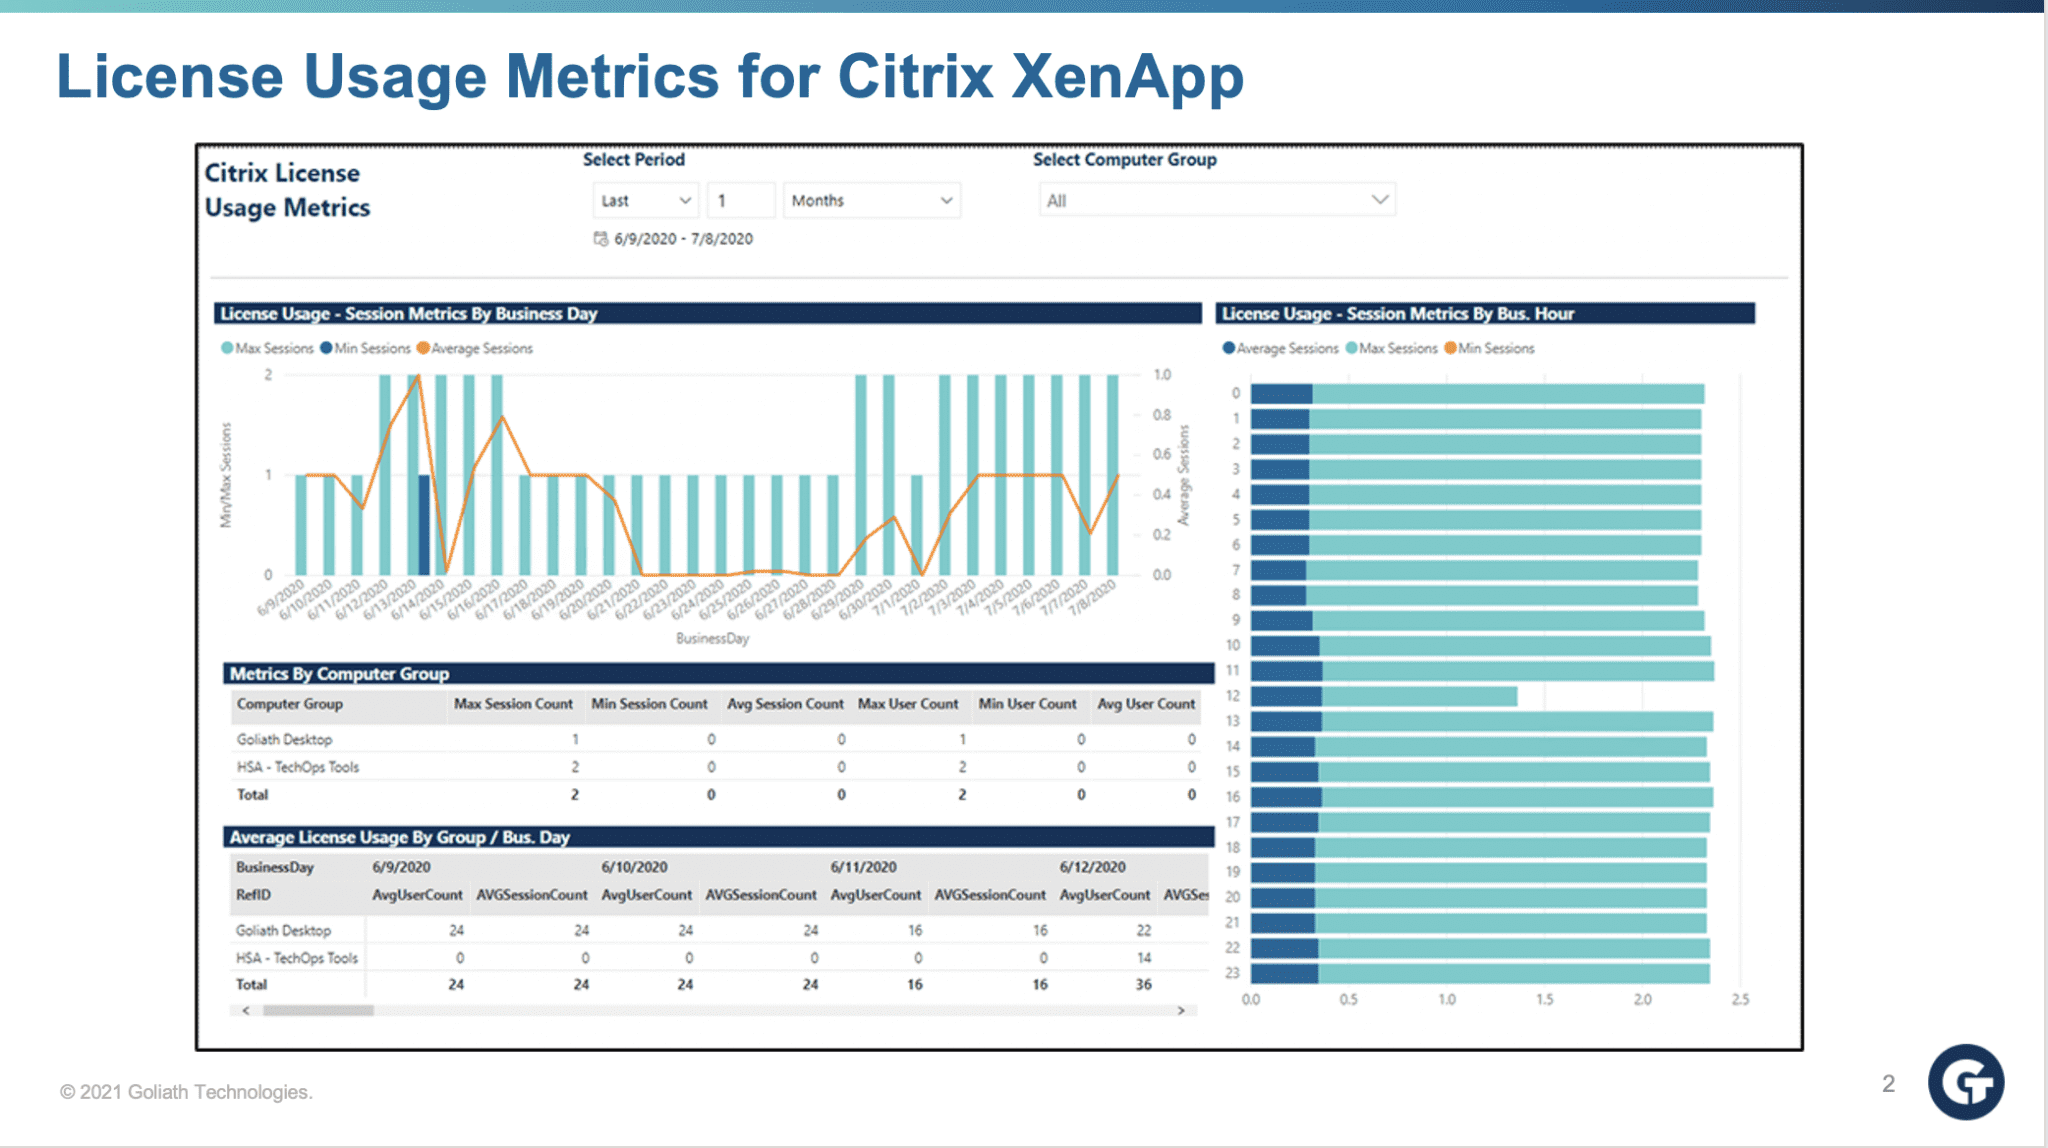
- License Usage Metrics for Citrix XenApp: This report displays license usage by group or time period, with adjustable filters for data ranges and groups.
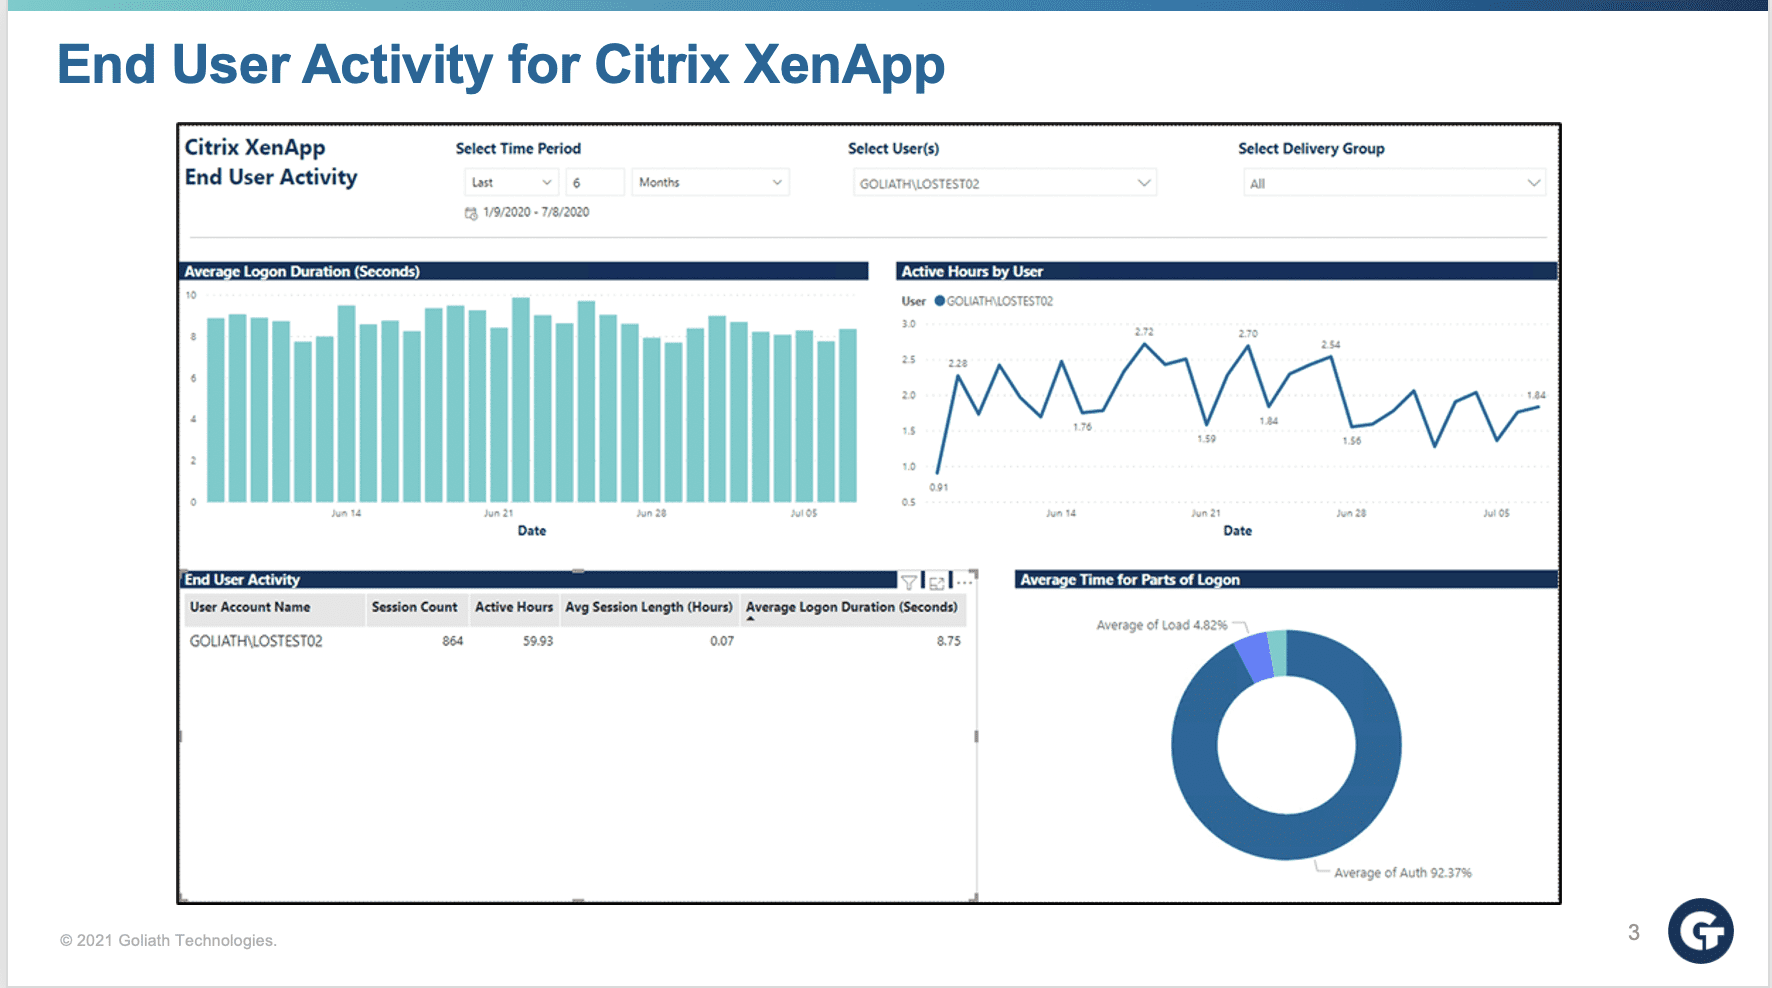
- End User Activity for Citrix XenApp: This report displays end user activity at an individual level identifying over a period of time total active hours, average logon speed, and average time of logon broken down by logon stages.
- Infrastructure Details for Citrix XenDesktop: This report displays information related to performance of the infrastructure supporting Citrix. In this visual report, you can obtain key performance metrics around Delivery Controllers, Delivery Groups, and Storefront Servers. For example, you can report to see if you have had any spikes around CPU Utilization or Memory in your Delivery Controllers over the past 7 days which may have impacted performance.
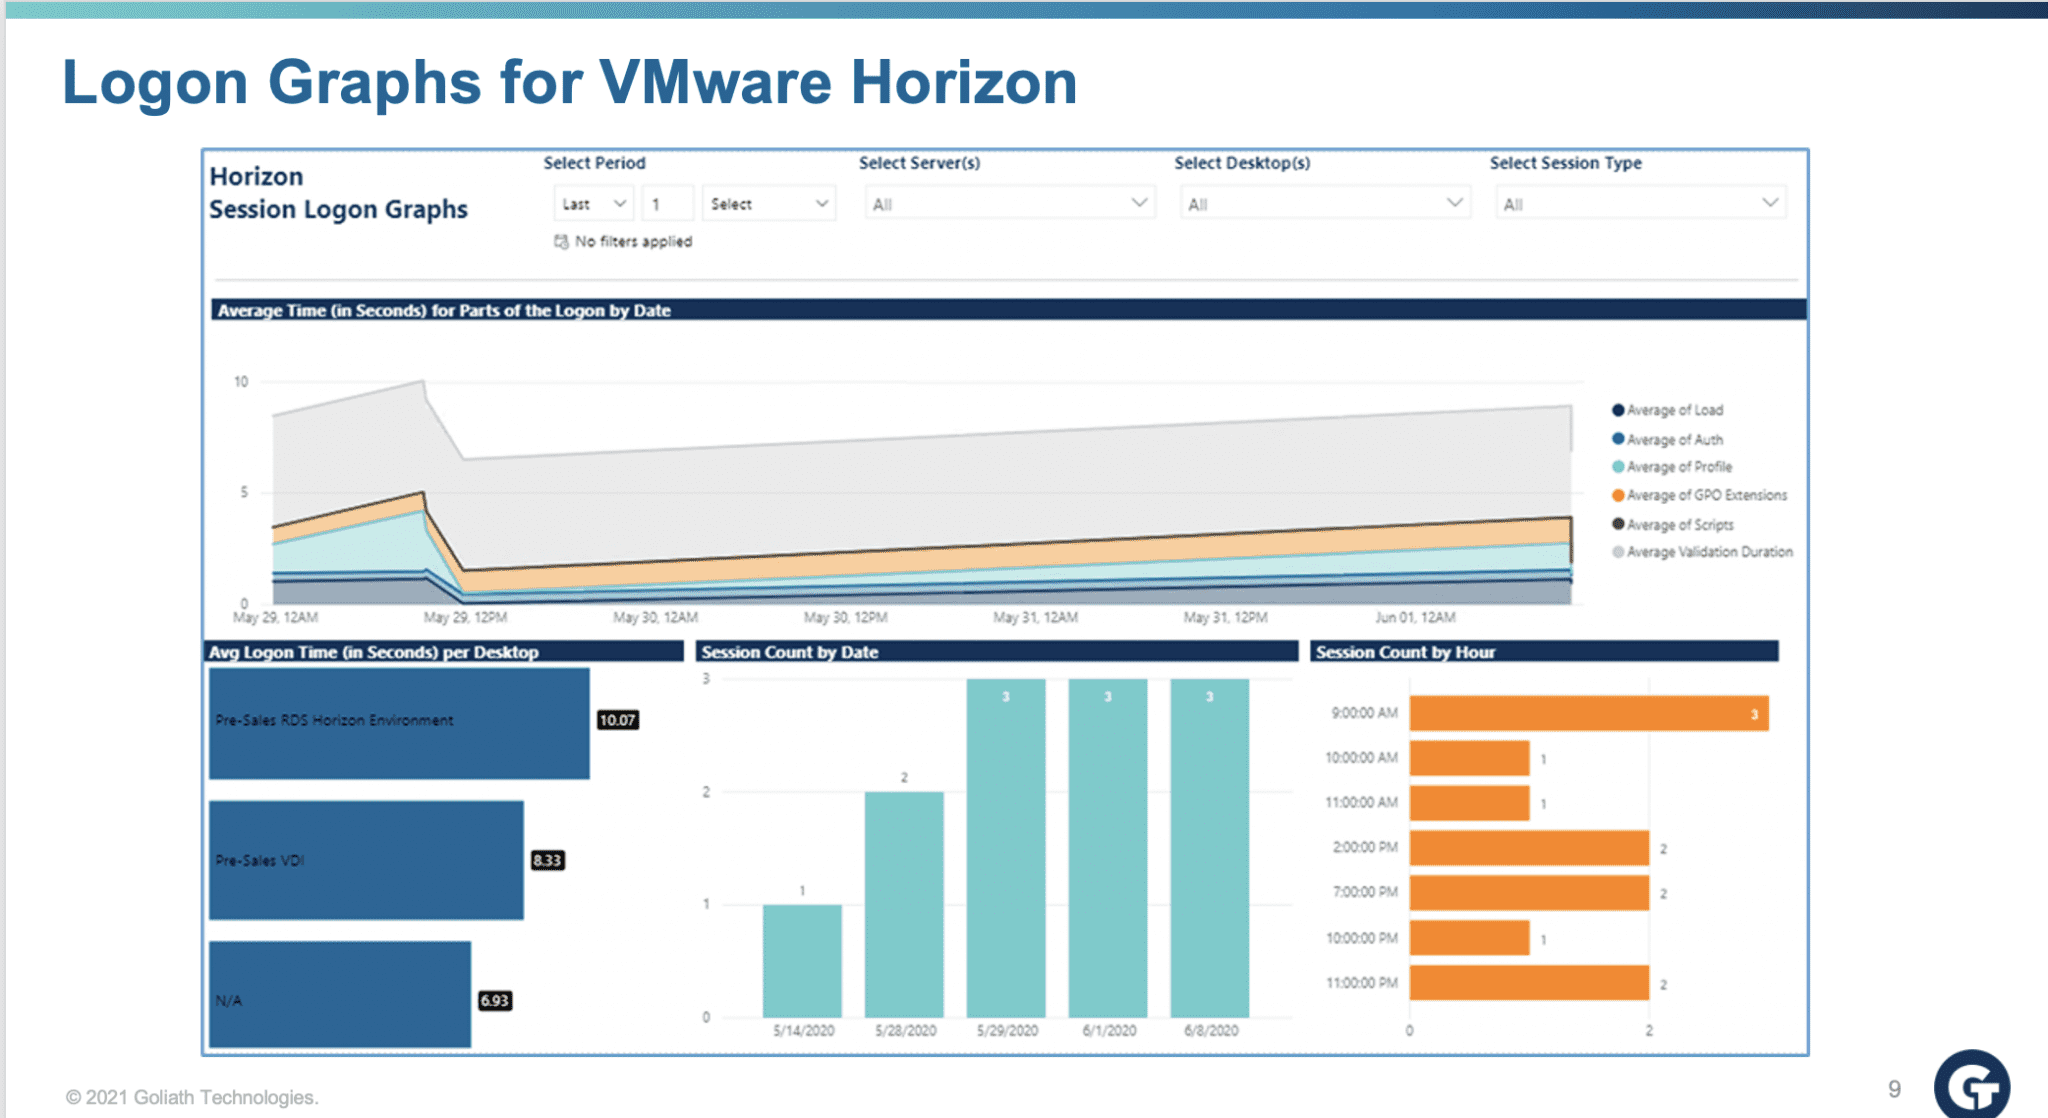
- Logon Graphs for VMware Horizon: This report displays average time by logon process part, average time per desktop, and session counts by date and by hour, all for a selected time frame, servers, desktops, and session types.
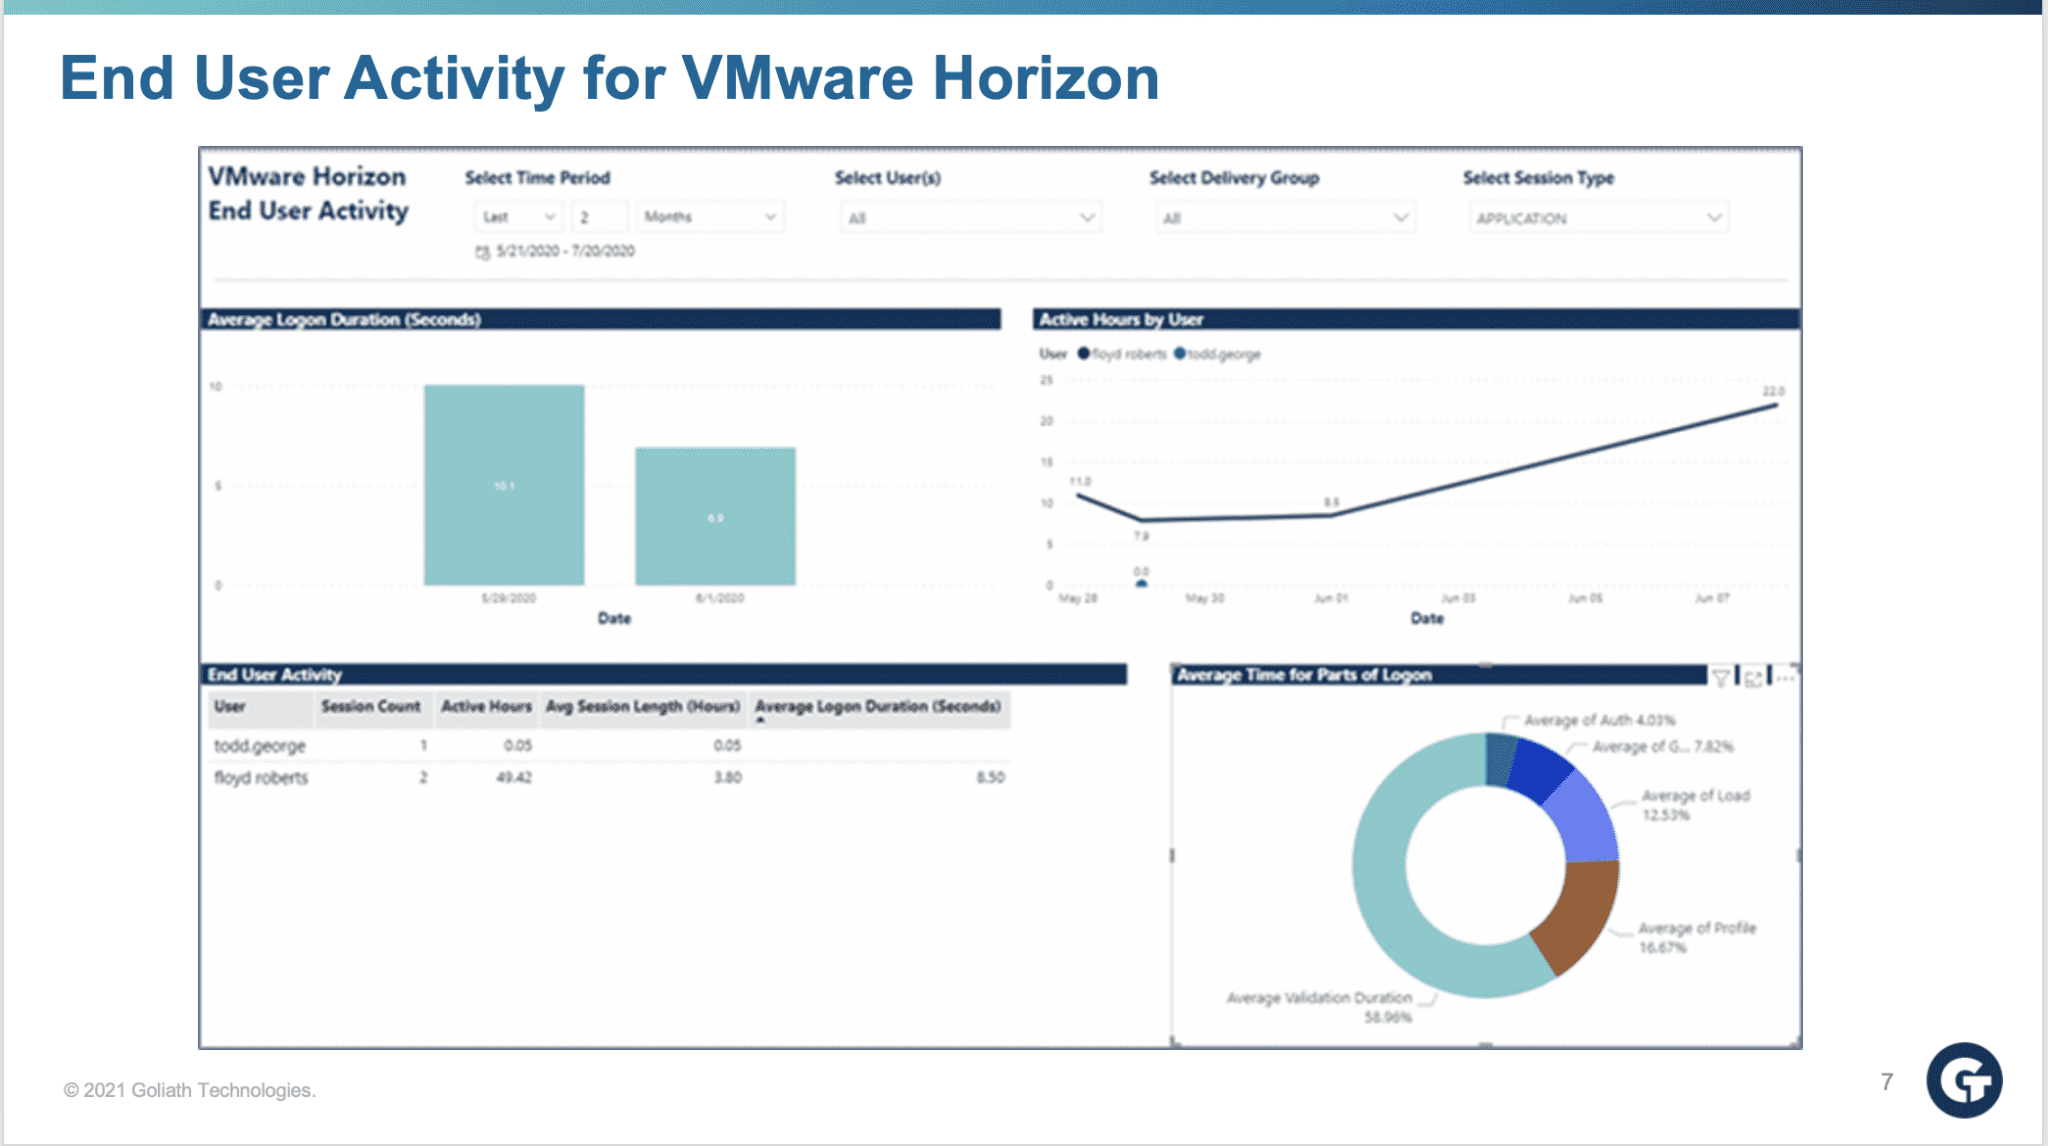
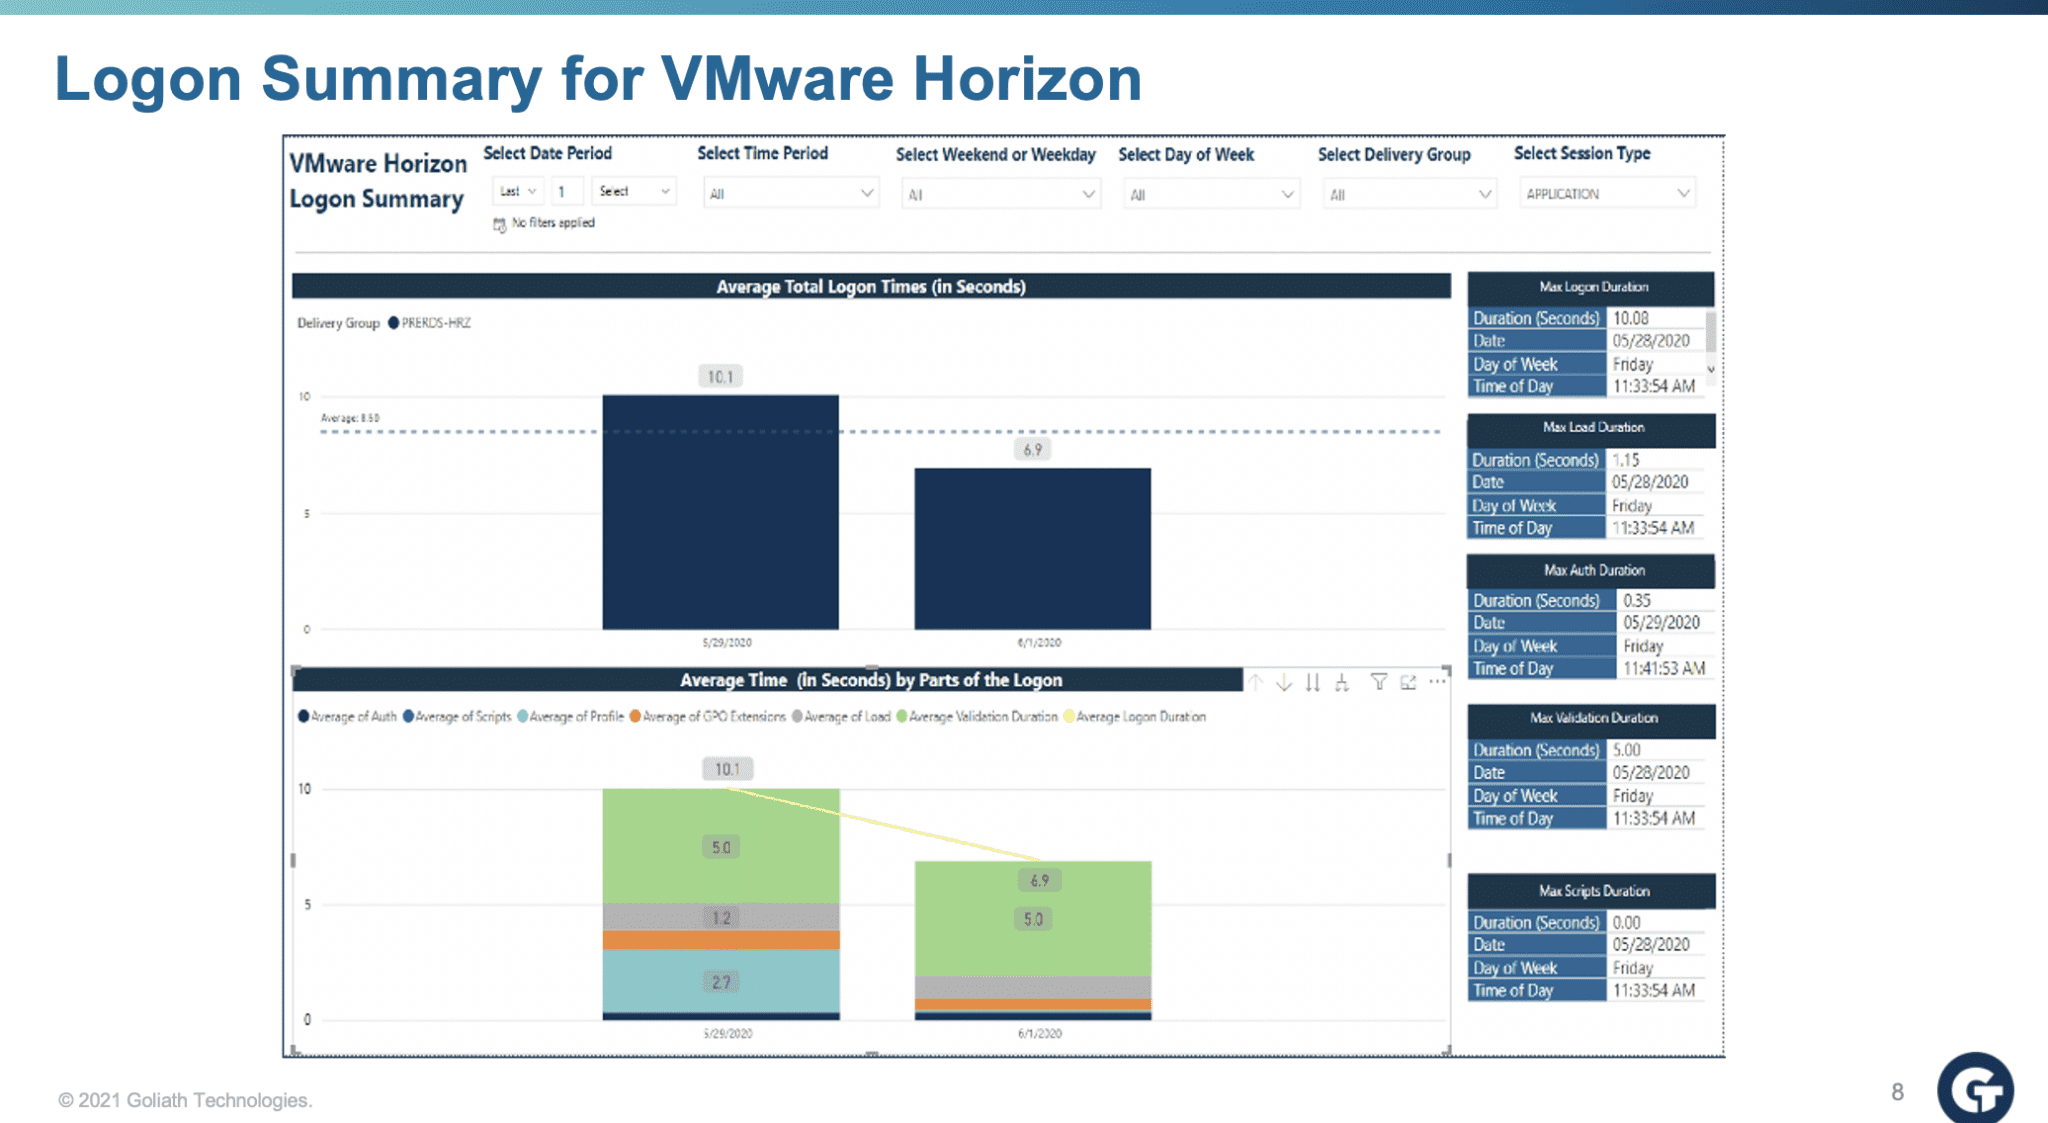
- End User Activity for VMware Horizon: This report displays average logon duration, active hours by users, session counts, average session length, and logon process breakdown. Each of these can be displayed, all available for a selected time period, certain users, delivery groups, or session types.
