by Benjamin Crill, Citrix CTP
“Why is everything down?”
Nod your head if you’ve had this experience. No changes were made, yet suddenly everything is down. Where do you start looking? If you’ve been in the EUC world long enough, you probably have a good idea. But what about those junior admins you are mentoring so that you can get some time back in your day?
Here’s another fun situation – an end user calls in to the help desk and says they can’t get into Citrix. Help desk personnel do exactly what they are trained to do, and they send the ticket to the Citrix team. The only problem is, the real issue is that the VMware infrastructure is experiencing an outage. Although Citrix performance is being impacted, the Citrix team isn’t actually the team needed to fix the issue.
These are just two examples out of many where Citrix issues are the symptom, not the cause, of end-user experience issues. For level one admins, it can be confusing how all the solutions in their infrastructure come together and interact, making it difficult to pinpoint root cause of issues and leading to extended resolution times. A tool that visualizes all these components and guides you to areas of concern is a huge help, which is precisely what Goliath Performance Monitor provides.
Automatic Citrix Discovery and Dependency Map
Think about how much easier day-to-day administration would be if you could have a bird’s eye view of everything that went into the Citrix infrastructure. A lot of companies have gone to great lengths building dashboards to approximate their environment, but to do so takes a lot of effort and upkeep.
Or, think about things from a consultant’s point of view. They come in to help with an issue and ask to see the documentation on the environment or ask for an overview of the environment from the customer. Those conversations can be lengthy to effectively provide the consultant with all the information they need to know. Conversely, consider the documentation itself. Who enjoys documenting the environment, particularly an EUC environment? It changes so frequently that by the time you put everything together, it’s already out of date.
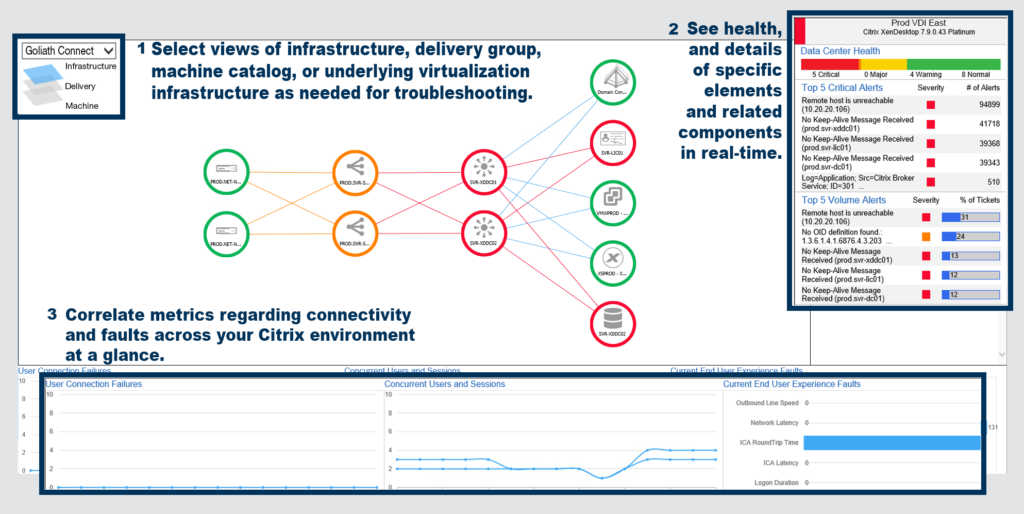
Goliath’s Automatic Citrix Discovery and Dependency Map intelligently creates a dependency map of your entire Citrix infrastructure and updates it automatically. This single view can be used as a real-time NOC display of your Citrix environment, allowing administrators to monitor, manage, and troubleshoot issues whether the root cause is the Citrix infrastructure or the supporting IT elements. It shows the overall health of your environment and provides context-sensitive supporting metrics and details as you select each element. You can drill down, dynamically examine your environment, and troubleshoot issues more easily since everything is logically broken down. Now you can prove when it isn’t really a Citrix issue (it’s the network, it’s always the network).
Infrastructure Layer

Show me a Citrix admin that doesn’t enjoy being able to show their management that the Citrix infrastructure is working properly. You can’t – they simply don’t exist. Giving visibility to the full infrastructure and letting you pinpoint the correct area of concern is invaluable. Sure, Citrix Director will get you some basics about your hosting connections, but to get more detail you must go with a more robust tool. Plus, having information aggregated in a single tool allows for quicker troubleshooting and assists non-Citrix admins in understanding all the connecting points in the infrastructure.
The dependency map is built automatically using Citrix APIs, allowing administrators to view their infrastructure fully, how the components interact, and their status. Administrators can quickly move between views, getting metrics specific to that data center or resource location. This allows for diagnosing and determining the root cause of issues. By understanding the underlying infrastructure, administrators can quickly diagnose resource and hosting issues that may arise.
Delivery Layer

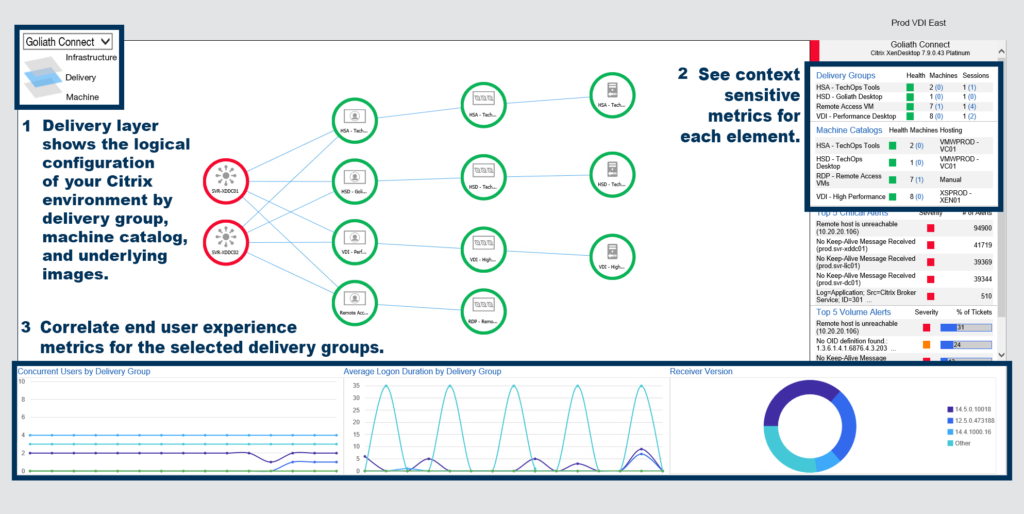
The delivery layer allows you to understand the resources being accessed by end users. Support teams can correlate user experience metrics with a particular delivery group to help target troubleshooting efforts. Support teams can also see what goes into making those resources available, expediting time to resolution.
Machine Layer

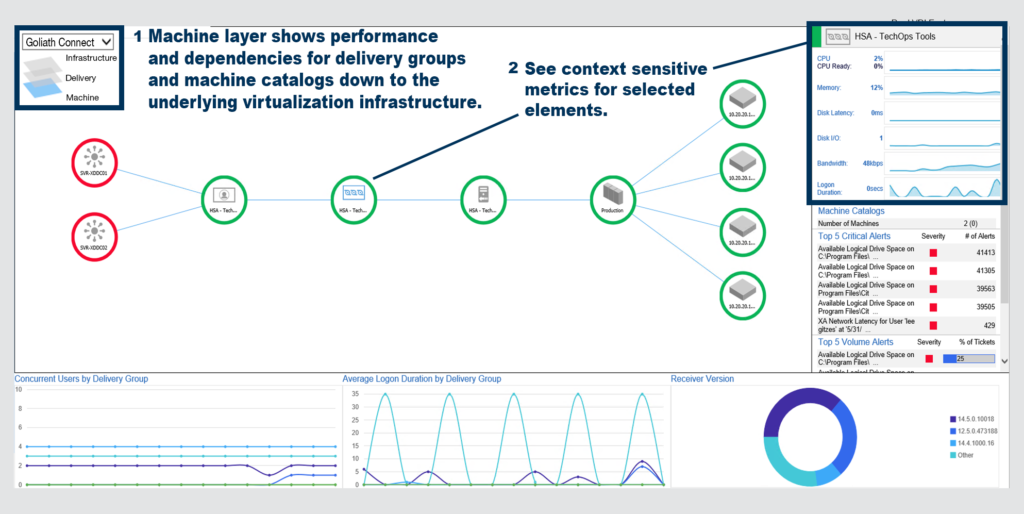
In addition to understanding the brokering infrastructure, the dependency map allows administrators to drill into specific machines and the hosting infrastructure. By clicking on any resource, the relevant metrics and alerts show up.
Summary
The ability to have an overall view of your environment and drill into the specifics results in increased control of your environment. And since it leverages the existing Goliath infrastructure, coupled with Citrix APIs, there is nothing extra the administrator needs to do. No custom scripting or additional deployments to get things working as desired. Goliath does the work for you, allowing administrators to focus on more strategic initiatives or, even better, get some rest.
Try Goliath For Free
Experience true end user experience monitoring and troubleshooting free for 30 days.