Problem: A number of users were complaining of slow session performance. IT needed to find the root cause of the end-user experience issues.
Goliath Performance Monitor can help you isolate the root cause quickly so you can troubleshoot and resolve with permanent fix solutions. When trying to identify the root cause of a Citrix end-user experience issue, the main display where you can view all of the Citrix user sessions is the Virtual Apps & Virtual Desktops display. To access the XenApp & XenDesktop session display, click on View then Citrix Virtual Apps and Desktops. This page is divided into three areas: App Servers, Published App & Desktops (for Citrix Virtual Apps, formerly XenApp, environments), and Virtual Desktops (for Citrix Virtual Desktop, formerly XenDesktop, environments). You’ll want to navigate to the applicable section for your environment (Published App & Desktop or Virtual Desktops) in order to troubleshoot further.
These pages include user session data (both past and present), and allow you to track the complete user experience through the environment – from the login at the endpoint, all the way through the environment, and back to the underlying infrastructure – and present these data points over the course of the session so you can troubleshoot any issue that takes place during a user’s session. Since the display shows past and present data, you can use the search button at the top of the page to filter the page to match a certain time period to analyze, a specific set of users, applications, etc.
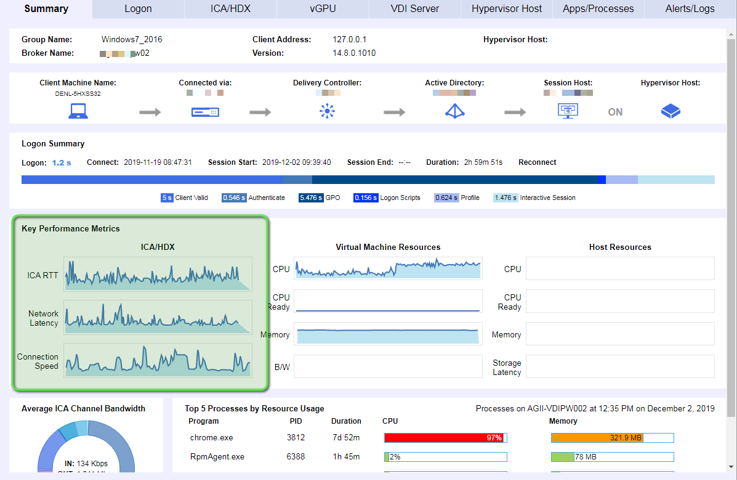
On the display, click on a user session to drill down into the session and analyze the session details. When troubleshooting slowness, the primary question you’ll usually need to answer is whether the slowness is due to network/connectivity or resource utilization. The quickest way to make that determination is by reviewing the user’s Network Latency, ICA RTT, and Connection Speed which can be found under the “Summary” tab, the first tab of the drill down.
Figure 1 – Session Dialog – Summary Tab

The network latency that is displayed is not your common ICMP/Ping based network latency, but rather a measurement through a unique integration into the Citrix ICA protocol. As a result of that we can measure the true network latency in real-time, which is the foundation for ICA performance. With that said, if network latency is persistently high, your users are not going to have a better ICA RTT or ICA Latency.
Additionally, the connection speed displayed in the technology is a measurement of how much bandwidth the end user has on their endpoint for Citrix. This is important because if your user is on a laptop, Citrix must share bandwidth with Windows, other applications, Windows updates, etc. and does not get a complete share to the full bandwidth available to the endpoint. By reviewing how much connection speed the end user is using you can quickly identify low bandwidth as being the issue.
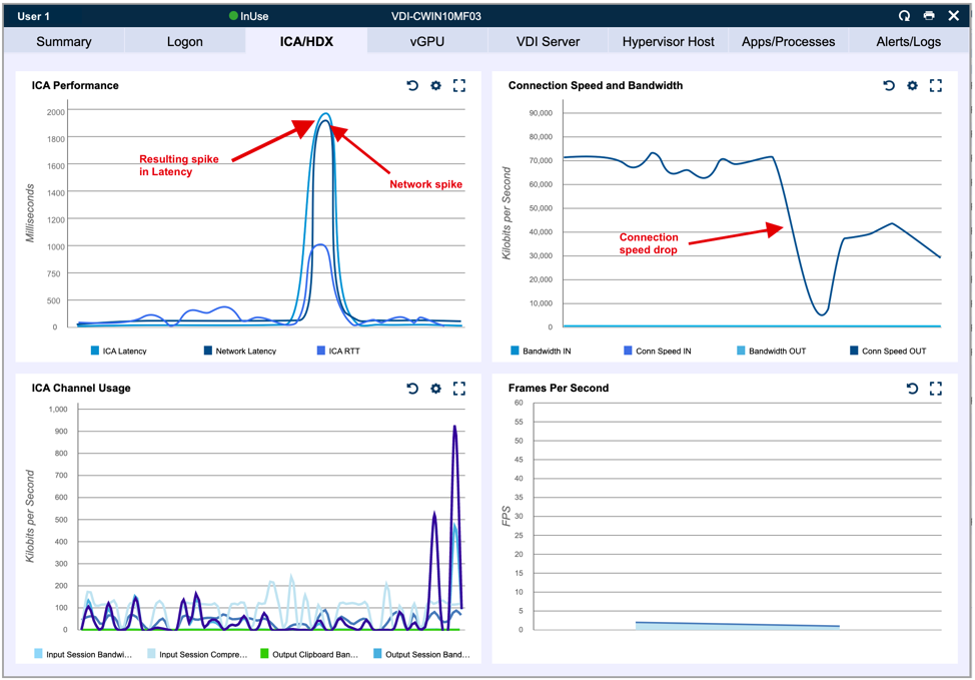
To drill down deeper into these metrics for additional correlations, navigate to the “ICA/HDX” tab. In the example figure below, you can see how the connection speed dropping from 70mbps to about 6-8mbps caused the network latency to spike to 1900ms and caused overall ICA latency.
Figure 2 – Session Dialog – ICA/HDX Tab – Example 1

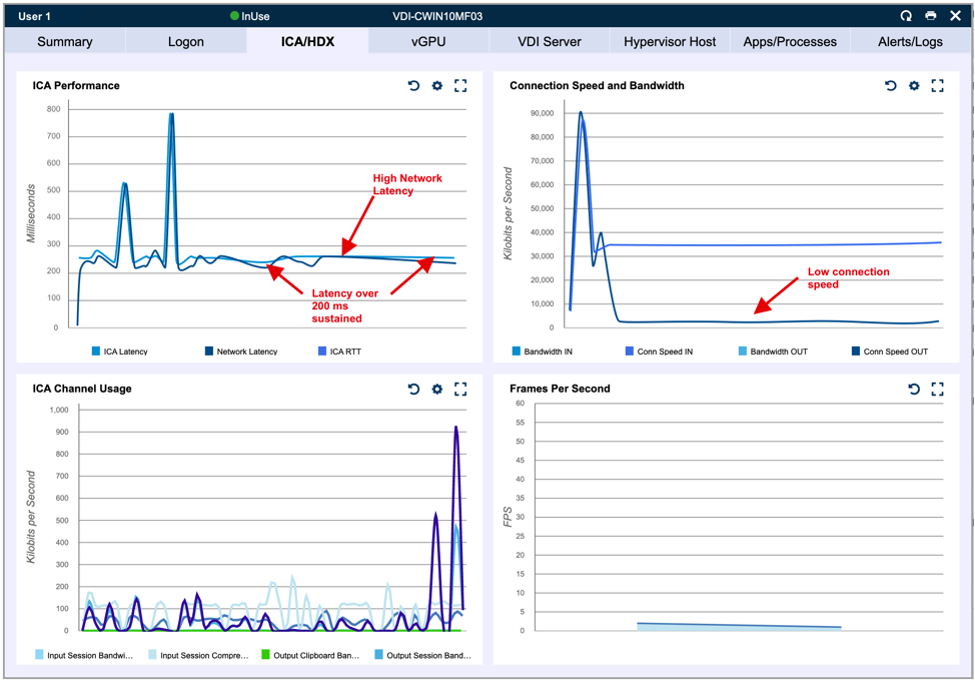
Often, users that are accessing Citrix delivered resources from certain regions of the world, especially in Asia, but also in Europe or North America, will experience ICA Latency of at least 180-220ms due to routing and network latency. In the screenshot below you can see how ICA Latency is sustained at about 200ms for the entire session. You can also see network latency showing the same, and the connection speed is mostly above 4mbps of bandwidth.
Figure 3 – Session Dialog – ICA/HDX Tab – Example 2

Root Cause
As mentioned previously, when troubleshooting session slowness issues often you’ll need to determine if network or server resources are the root cause. The quickest and easiest way to make that determination is by reviewing the user’s Network Latency, ICA RTT, and Connection Speed – all metrics are displayed within the Connection Performance tab of the end-user drill down dialog. The above scenarios demonstrate how network latency and connection speed can have an impact on ICA Latency and overall session performance.