Citrix Blog
How to Identify Poor Drive Mapping to GPO is Root Cause of Slow Logons

Problem
End users are complaining of slow logons and IT cannot quickly identify root cause.
How to Identify Root Cause
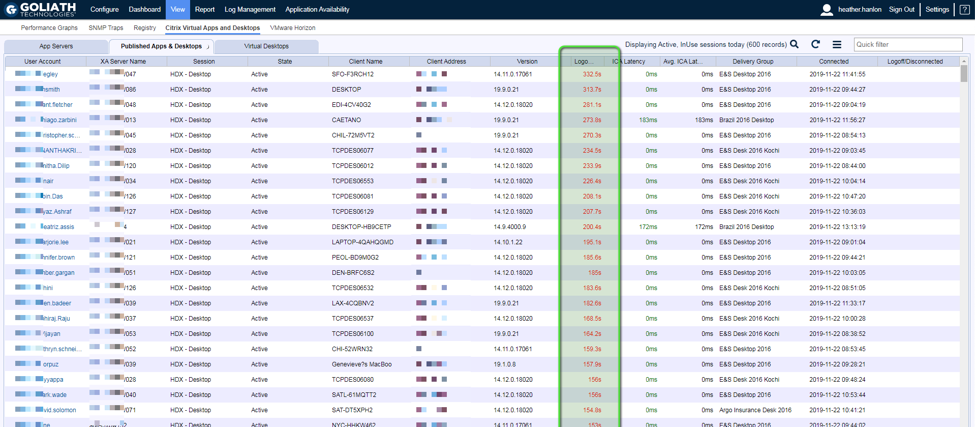
When trying to identify the root cause of a Citrix end-user experience issue, the main display to view all of the Citrix user sessions is the Goliath’s Citrix Virtual Apps & Desktops session display. The display is key because it includes user session data (both past and present), allowing you to track the complete user experience through the environment, from the login at the endpoint all the way through the environment back to the underlying infrastructure, while presenting these data points over the course of the session so you can troubleshoot any issue that takes place during a user’s session.
To access this display, click View then Citrix Virtual Apps & Desktops (Figure 1). This page is divided into three areas: App Servers and Published App & Desktops (for Virtual App environments) and Virtual Desktops (for Virtual Desktop environments). You’ll want to navigate to the applicable section for your environment (Published App & Desktop or Virtual Desktops) to troubleshoot further.
To view the sessions with high logons, sort the page by the Logon column or use the Search feature at the top of the page. Some of the key metrics of the page include Machine Name, Username, Group Name, and Start Time, which help confirm whether any patterns can be identified outside of high logon duration for the end users. For example, when widespread issues are occurring, it can be useful to note the client address to identify if all the users are connecting from the same location.
Figure 1 – Citrix Virtual Apps & Desktops Tab Sorted by Logon Times
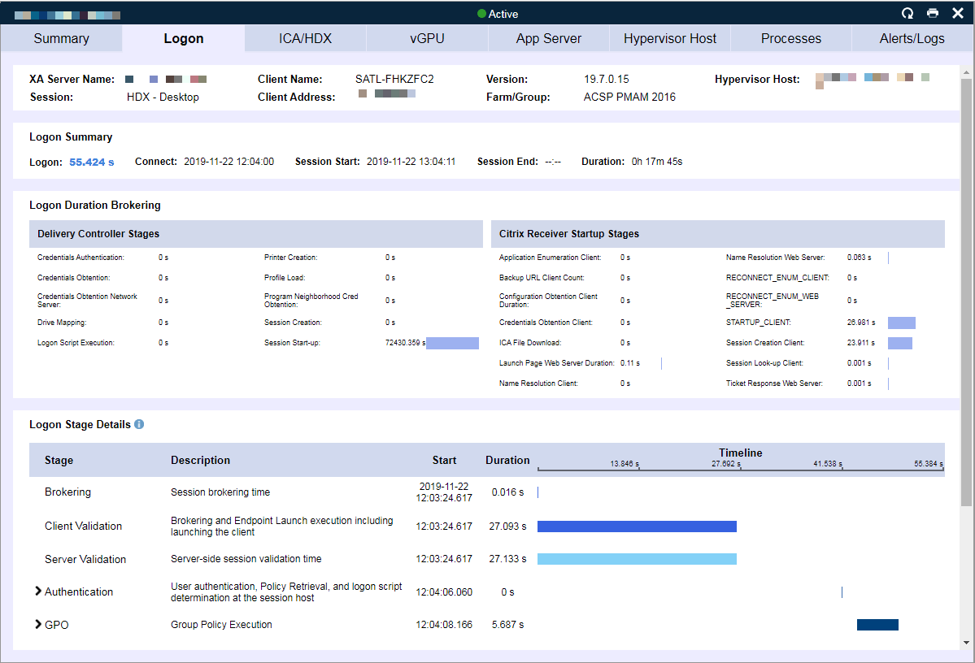
To analyze the 33+ stages of the user’s logon process, you can click on any user session to drill into the session metrics. Once you’ve drilled down, navigate to the logon duration tab (Figure 2). This tab is divided into two sections. The top sections break down the details of what is happening in the brokering stages and the bottom sections detail the high-level metrics of the launch on the App Server or VDI.
The brokering stages enable you to identify slowness due to Citrix Delivery Controller brokering issues such as Authentication, Logon Script, Profile Load time, and/or delays in Windows session creation on the session host. On the client side, you can identify delays in establishing the micro-VPN connection, receiver launch, ICA file download, and more.
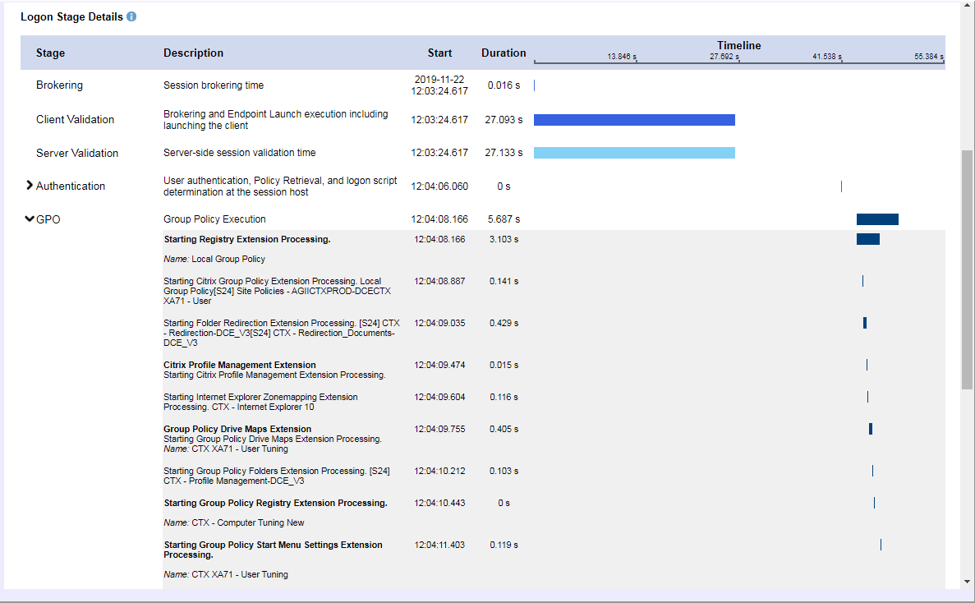
At the bottom of the dialog (Figure 2.A), each stage of the logon process at the session host process is displayed, including authentication at the domain controller, determining how long it took to copy over the policy files to the session host, logon script execution, drive mapping, printer mapping, and folder redirection. Each policy and script which is executed is included in this stage.
Figure 2: Session dialog – Logon Duration Tab
Figure 2.A: Session Dialog – Logon Duration Tab Drill Down
When you have many users in the environment complaining about the same issue (in this case logon duration), finding patterns can be key to isolating root cause and identifying a permanent solution.
Example Scenario
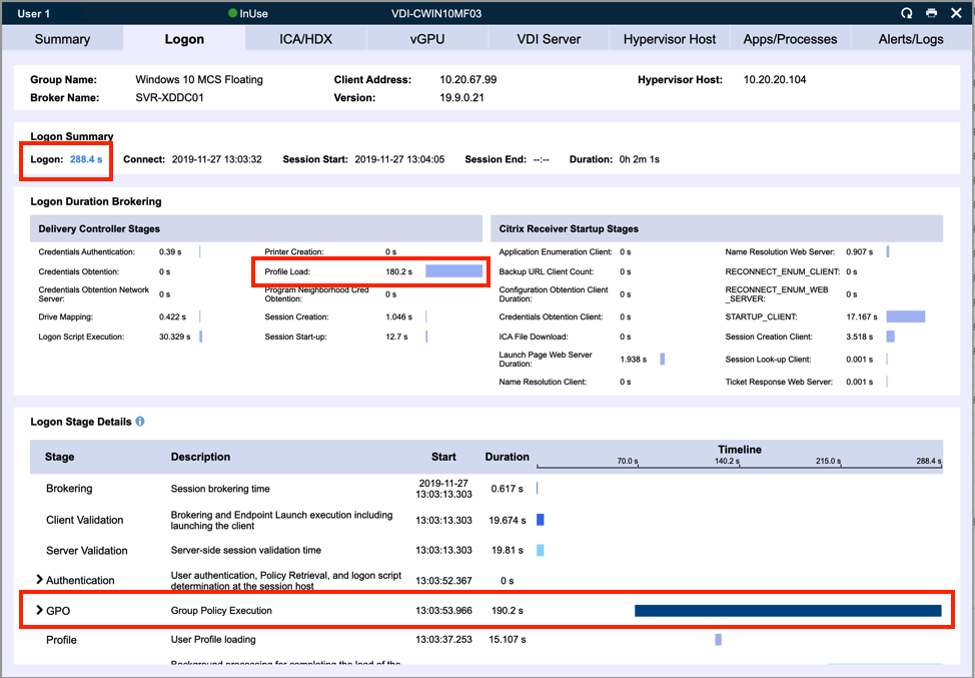
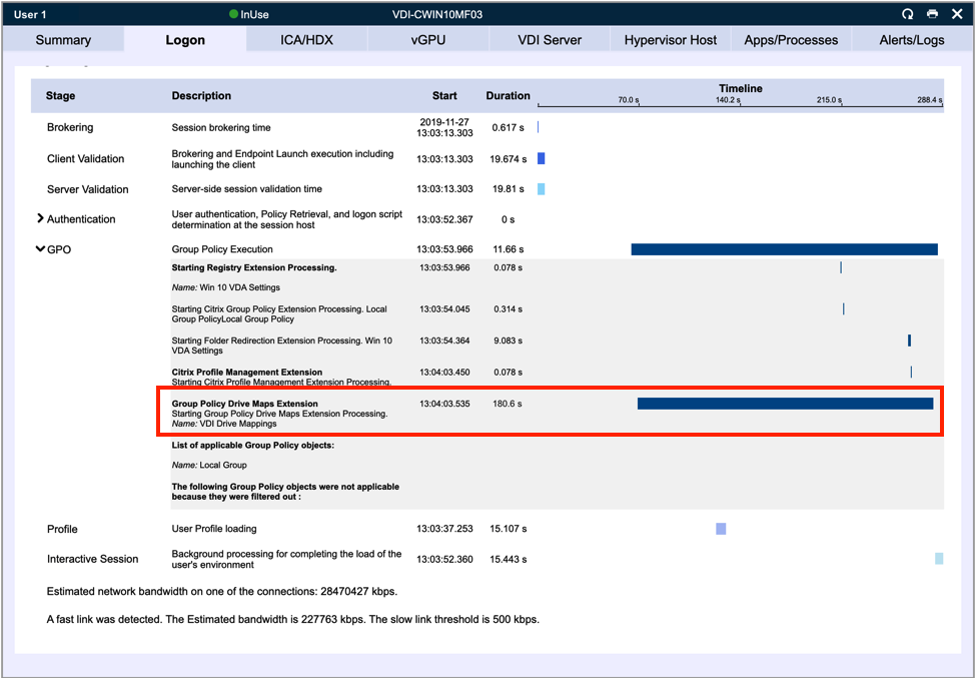
Using the Logon Duration details, a system admin can determine that the widespread delays in logon duration stemmed from drive mapping (logon) scripts. This was discovered by tracking high GPO times in the top level (Figure 3) of the logon duration breakdown, then down to the brokering stage of PLSD (the time spent on the server loading the user’s profile), and then down to the bottom section of the page, specifically Group Policy Drive Maps Extension (Figure 3.A).
Figure 3: Logon Duration Tab
Figure 3.A: Logon Duration Tab Drill Down
Root Cause
In the example scenario described above, reviewing the logon duration metric trends resulted in identifying high group policy drive mapping. By identifying the exact policies that were associated with the drive mapping extensions, further investigation of those policies could take place. Ultimately, the system admin discovered that the scripts were mapping 30+ errant drives to the user’s profile. The IT Pro was able to reduce the number of logon scripts down to a single script and removed the problematic, incorrectly linked GPOs. By determining the root cause and applying the aforementioned actions in their environment, the system engineers were able to reduce logon times and solve the end-user performance issues.
