Editor’s note: this review is from Bilal Hashmi, an accomplished and respected VMware vExpert. Bilal also holds specialized certifications like ISA, MSCITP-SA and VCP-3/4/5. You can connect with Bilal on Twitter.
This unique monitoring solution allows you to be proactive in the management of VMware vSphere infrastructure while at the same time simplifying operations. In this review I will talk about how you can leverage the functionality and unique architecture to accomplish this dual purpose.
Just recently, I had the pleasure to work with the good folks at Goliath Technologies and review their solution, Goliath Performance Monitor (GPM).
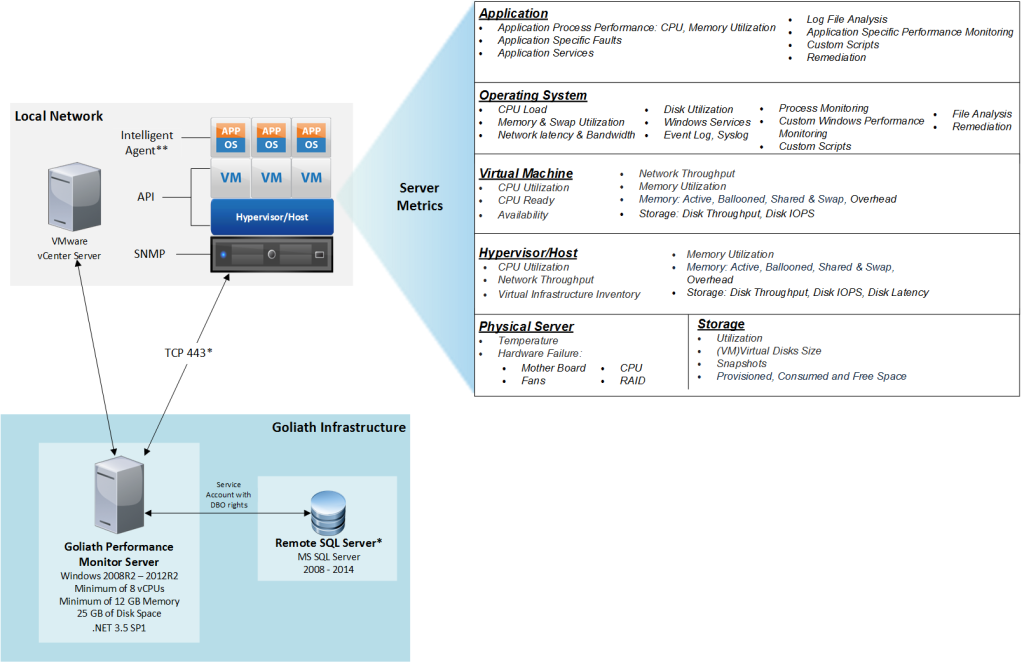
My first impressions of GPM were pretty positive. If you’re unfamiliar with GPM, for VMware vSphere it’s a single solution for providing monitoring across the 5 layers of the virtual stack including Application, OS, VM,Hypervisor and Hardware. So it’s a single pane of glass to monitor your entire stack. The version of GPM I am reviewing is 11.6.0.6.
The GPM Installation Process – Up & Running within Minutes
Goliath does an excellent job in creating an installation guide for the tool so I won’t go into detail about that. I just glanced over it and my deployment may have taken about 30 minutes or so.
Within minutes, I was playing with the monitoring tool’s consoles. One thing I would like to point out from the installation guide is the pre-requisites. You will need a VM or Physical Machine with the following settings:
- Windows Server 2008 R2 – 2012 R2
- At least 8 vCPUs and 12GB RAM (these are soft limits but probably a good idea to follow these when deploying in production)
- .NET 3.5 SP1 installed on the Virtual Server or Physical Machine
- Internet Explorer Enhanced Security disabled
- TCP ports 80 & 82 opened inbound
- Download the Goliath Performance Monitor software
- Proper credentials for the environments you would like to add to inventory (vCenter, XenServer, ZDC, DDC, etc.)
Goliath Performance Monitor vs vCOPs/vRealize Operations
Why XenServer credentials? Unlike some other popular tools in the space like vCOPs/vRealize Operations, GPM supports VMware vSphere and also XenServer, Hyper-V along with XenDesktop, XenApp and Horizon View.
So remember what I said about simplifying IT operations? You can use Goliath’s product to monitor VMware vSphere and everything else too. Not to mention you don’t have to fall prey to licensing that limits your functionality. Basically, you get full functionality with Performance Monitor on the base product, unlike some of its direct and indirect competitors.
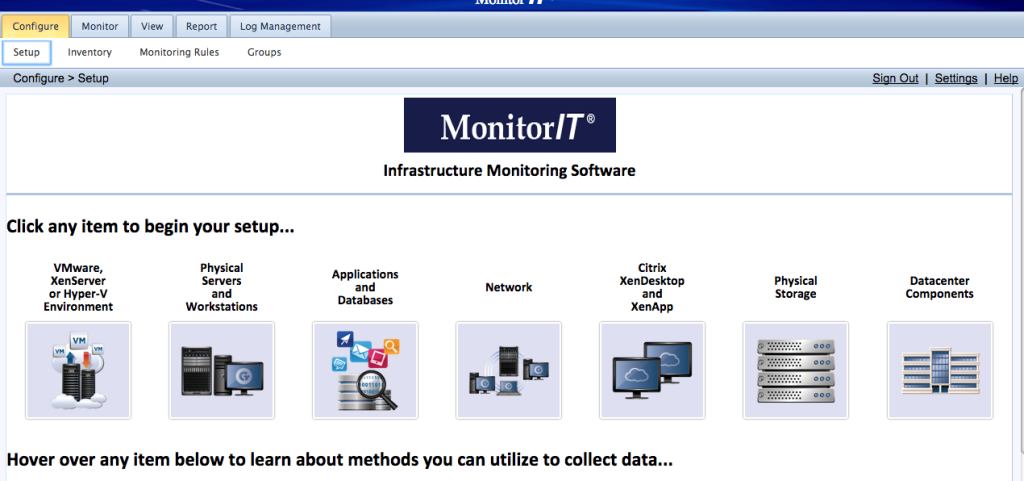
As soon as the installation was complete, I pointed my browser to the IP address of the server the tool was installed on and this is where I landed.

From here on, it was pretty straight forward. I selected the first obvious choice, provided credentials for vCenter, and within seconds my whole lab was presented before me.

About GPMs vCenter Plugin & Impressive “Intelligent Agent”
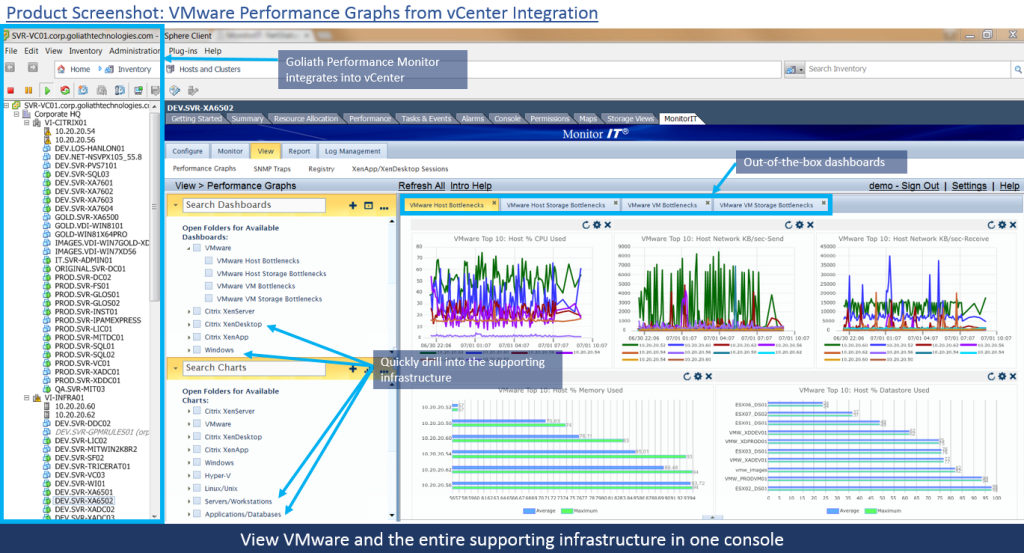
The tool has a vCenter plugin that provides a single dashboard to monitor both physical and virtual infrastructure in vCenter. If you are not a VMware only shop, you will be happy to know that GPM has API integration with both ESXi and XenServer that captures key metrics about the host, virtual machines and storage agentlessly.
So what exactly does the agent do?
First of all, this is by far the most impressive agent deployment process I have witnessed. They call it the “Intelligent Agent” and I think for good reason.
It literally takes seconds for the Intelligent Agent to be deployed and communicating back to the mother ship. It is able to capture deep diagnostic metrics with little resource utilization, typically less than 0.1% of CPU & Memory utilization, and a 1.5 MB footprint.
GPM Can Monitor any Application
Once I deployed the agent on one of my windows machines, I started seeing this tool’s true potential apart from being hardware/hypervisor agnostic. You can literally tune it to monitor any application.
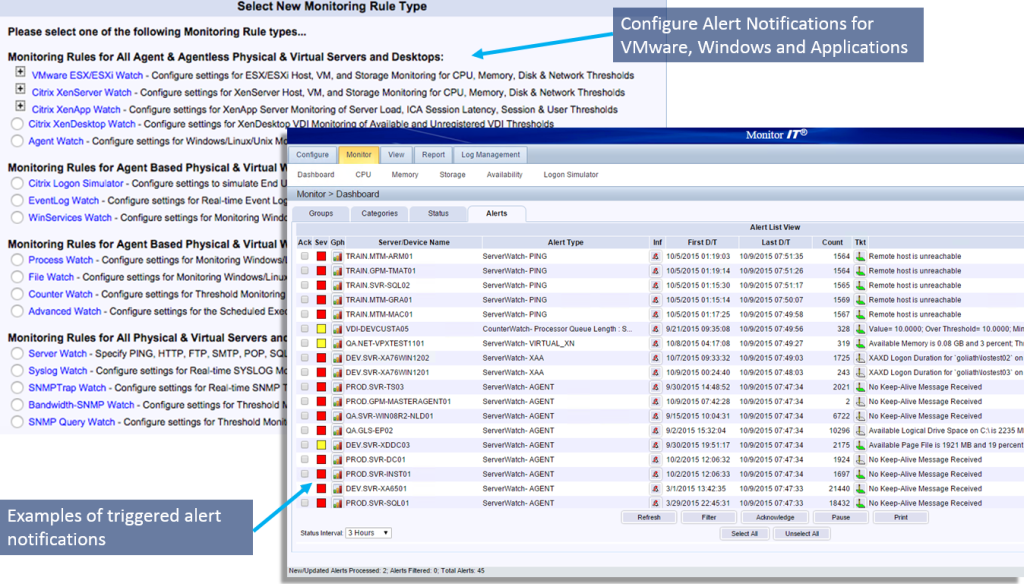
Take a look at the types of monitoring rules and alerts that can be set and think of your current gaps in monitoring. This is what I gathered; as long as the individual understands what the application does, Goliath Performance Monitor can monitor it effectively.
Needless to say, the agent provides a new level of monitoring that enables you to monitor services that are critical to your business, not just VMs and OSs, etc. And yes, it can be deployed from within the console as long as proper credentials are provided. The agent can get deployed on both Windows and *nix machines.

Some of the metrics that are captured are detailed and useful. The key is that they use both agentless (API) and agent based approaches to get all of the below metrics in one product. Also, each agent has log management capability built in for troubleshooting.
GPMs Metrics Will Help You Keep Your Sanity
This is the 5 layers of visibility:

Those are some critical metrics to monitor your infrastructure which will eventually help you keep your sanity. But what makes these even more valuable is the way they are reported.
Not only does it give you a detailed view of what’s happening with your environment at the moment, you can also get some real-time trending on the data and historically go back as far as you wish, or at least to the point where data began to be collected.

All the hypervisor metrics mentioned above can be retrieved in similar fashion. Apart from that, there are some canned reports that come with the solution and there is the option of creating more.
But it’s information like this across multiple aspects of your infrastructure that makes this tool stand out. You are able to run these types of reports for your entire stack.

If you have multiple sites or hybrid clouds in play, you will love the “Master Agent” functionality. I think this is the part that I really liked due to its simplicity.
GPM makes it Easy to Monitor & Manage Remote Sites
The Goliath Performance Monitor Intelligent Agents make it easy to proactively monitor and manage customer sites remotely. Any agent can be designated as a “Master Agent” at a remote site, behind a firewall, and configured to proactively reach out to the central Goliath Performance Monitor server if a condition is met and trigger an alert.
There is no need to deploy a separate server or proxy at a remote location. Note: Intelligent Agents are less than 0.1% CPU/ 30 MB Memory, click to deploy and easy to use. So basically the agent we talked about earlier is all that is needed to make one of the boxes at any of the remote sites serve as the proxy for communicating with the GPM server.
Obviously because of its tiny footprint, performance should not be a big concern. But what if this remote server goes down? Well I would imagine GPM would trigger an alert as soon as that happens.
Also, there are notification capabilities that will allow you to integrate these alerts with most ticketing solutions. These are configurable at the alert level so each alert can follow a different notification method if need be.
A Few Areas of Needed Improvement
With all its greatness, the solution does have some areas of improvement. The Goliath team was very interested in hearing my feedback on this. They were keen to know how to make this tool even better.
In all honesty, I have been pretty impressed with what GPM offers. However, its GUI can use a little help. The navigation is not the most straightforward like many other monitoring tools. But it does solve an extremely complex problem; allowing you to monitor your entire infrastructure through a single pane of glass, the ultimate fantasy for most people in IT.
The Goliath team was very receptive about my comment on how I keep forgetting how I got to a certain screen because of the confusing navigation. They quickly acknowledged that and pointed out they are currently working on revamping their GUI to address those issues and will continue to come back to the community for further enhancements to the product. Look for my blog post later on the new UI when it is released.
The Verdict about Goliath Performance Monitor
In conclusion, I think Goliath Performance Monitor is a true winner. I can’t seem to pinpoint a tool that does everything it does. There are tools that compete with it in certain areas obviously, but I am not sure if there is any that delivers everything it does, the way it does.
It should appeal to businesses of all sizes. The support I got from the Goliath team in getting me familiar with the tool was phenomenal. If their actual support team has the same attitude, then you cannot go wrong with making an investment in them.
Speaking of investments, here is a link that will give you an idea on how much it will cost you to run this tool in your environment. But before you do that, I suggest you download a fully supported 30-day free trial of GPM and let the technology do the talking.