Epic Health System
Epic Health System Troubleshoots ‘Citrix is Slow’

Infrastructure
Citrix XenApp, Epic Hyperspace
Challenge
Surgeon reports Citrix slowness, IT identifies and resolves the root cause immediately
The below screen shots were provided by a large non-profit healthcare organization that includes 4 acute care hospitals, over 20 clinics and 5,000 Citrix users. The Healthcare IT team received an urgent call from a surgeon who reported slowness in his EPIC EHR applications while delivering patient care. This document describes how the Citrix engineer used Goliath to quickly identify and troubleshoot the “Citrix is Slow” complaint and prove conclusively that the root cause wasn’t actually Citrix or the Epic Hyperspace Application at all.
Solution
Troubleshooting Session Slowness and Proving it isn’t Citrix or Epic Hyperspace
When the Citrix engineer received a call from his manager (because surgeons don’t open tickets) about Citrix performance issues, he needed to get to the root cause quickly. The surgeon’s complaint focused on session slowness. The engineer located, in real time, the specific session while the surgeon was still logged in to Citrix.
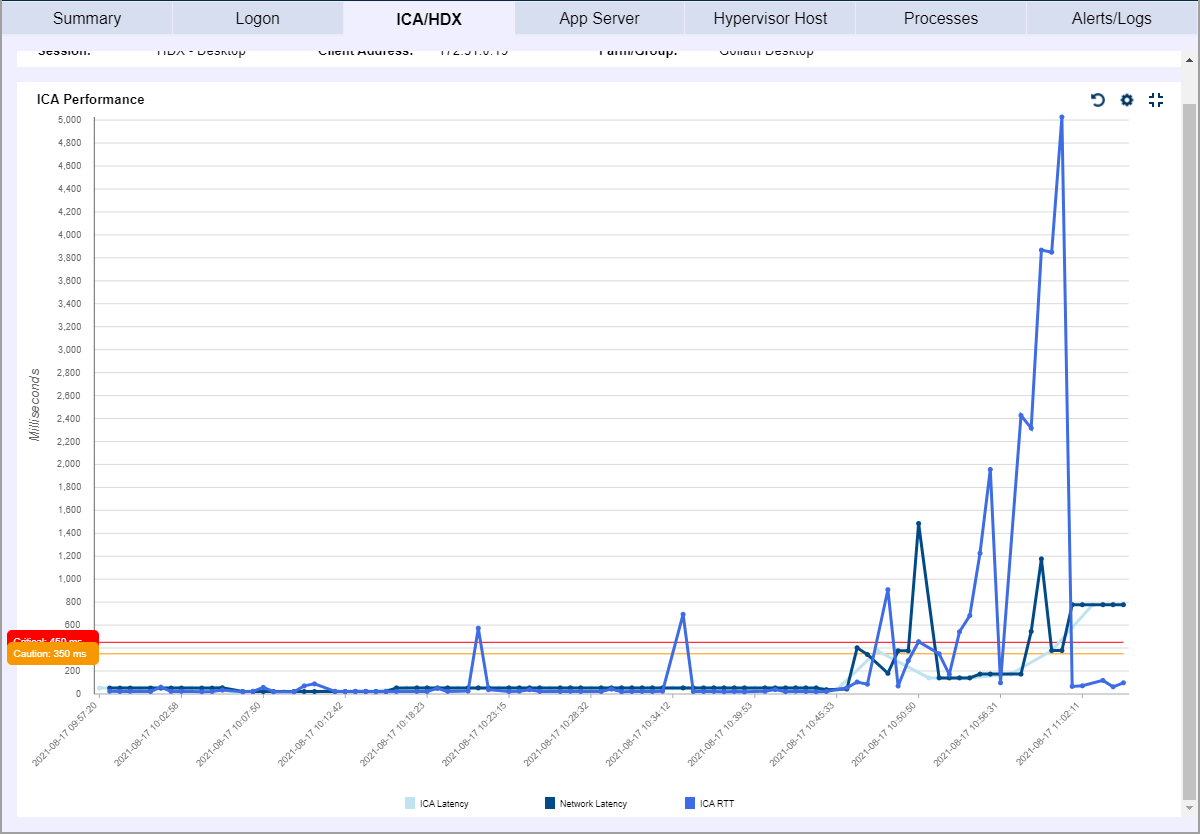
The Citrix engineer noticed that the connection from the remote hospital site to the hospital data center showed particularly high spikes in ICA RTT, ICA Latency, and Network Latency at the same time during the session (figure 2-1). Many tools can show ICA RTT, but these spikes could be caused by network issues, server/application resource issues, or even end user behavior, which can make this difficult to troubleshoot. This visibility limitation often results in unproductive finger pointing between teams.
Figure 1: Goliath’s Citrix session display screen shows server name, user, logon duration, ICA latency and connection date among other details. Historical sessions are stored for weeks or months in full detail, without being averaged out or rolled-up
Figure 2: Time of network latency spike correlates directly to ICA & ICA RTT latency spikes.
However, Goliath includes a unique metric Network Latency, which measures the actual ICA network latency that is being experienced by the user. The network team might be right and there is plenty of bandwidth to the location overall, but the end user might still not have enough bandwidth for Citrix operations – especially when working with graphic-intensive applications. The spike in Network Latency here immediately indicates a network performance issue is to blame.
In two clicks, the Citrix engineer was able to both confirm the issue and pinpoint root cause – network performance issues. The engineer showed the objective evidence provided by the technology to his manager and the network team, proving that, while overall bandwidth is fine between the sites, the actual bandwidth available to the Citrix session is too low to support this physician’s use of graphic-intensive patient files, and deliver more bandwidth allocated in the future.
Results
Being Proactive – A New Health IT Paradigm
Without any quantitative measurement and tracking of end user experience metrics, IT professionals are forced to rely on anecdotal comments from the end users themselves. These reports are driven by frustration and are inconsistent, inaccurate and unreliable indicators of the size and scope of any actual issue. Now, IT professionals proactively track detailed end user experience metrics and automatically monitor those metrics for events, conditions and thresholds. This broad visibility correlates end user issues directly to the specific underlying elements of the complex virtual application and desktop delivery infrastructure that is the source of the problem. Then, IT administrators leverage the uniquely detailed metrics, including Network Latency, to pinpoint the specific root cause and resolve the issue.
*Epic, Hyperspace, Hyperdrive, and System Pulse are trademarks of Epic Systems Corporation
*Epic, Hyperspace, Hyperdrive, and System Pulse are trademarks of Epic Systems Corporation


