How We Did IT
Memorial Health System Troubleshooting Citrix & MEDITECH End User Experience Issues

“Before we had Goliath’s XenApp Monitoring & Troubleshooting MEDITECH module, Citrix XenApp was very challenging. With Goliath, we can identify the ‘who, what and where’ of performance issues. We even use the data in the product to open up support tasks with MEDITECH and they, in turn, are able to work with the support staff to determine root cause.” – Derek Seiber, Systems Administrator at Memorial Health System
This user success story comes from Memorial Health System, a non-profit organization with 2 hospitals, 15 outpatient sites and provider clinics, and more than 5,000 end users. They came to us looking for an end-to-end monitoring and troubleshooting solution for their virtual desktop infrastructure. Particularly visibility into Citrix XenApp and MEDITECH related end user experience issues that they could deploy at all of their sites. With over 5,000 end users, the need to ensure that they always had access to mission-critical applications like MEDITECH was a top priority. Specifically, a solution that gave them the ability to troubleshoot and resolve these issues with only a few mouse clicks.
Infrastructure
Citrix XenApp, Citrix NetScaler, VMware & MEDITECH
The Organization’s Troubleshooting Products:
Goliath Performance Monitor & Goliath Performance Monitoring Module for MEDITECH
Challenge
Find Solution To Troubleshoot Citrix XenApp & MEDITECH End User Experience Issues
Derek Seiber, a Systems Administrator overseeing IT Operations for Memorial Health System, and employed by CareTech Solutions, had been experiencing Citrix XenApp and MEDITECH end user experience issues since he joined the team in 2010. Specifically, printer crashes, which would happen on average a hundred times a day because they lacked visibility into what was happening in their Citrix XenApp and MEDITECH environment.
Derek was using VMware’s vCOPs with Enterprise Plus licensing to monitor his environment. With this solution, he only had visibility into the VMware hypervisor level and not Citrix XenApp or MEDITECH. Derek knew that to permanently resolve these issues, he would need a comprehensive monitoring and troubleshooting software that offered broad and deep visibility into the entire virtual desktop infrastructure, not just parts of it. So they deployed the Goliath Automatic Citrix Discovery and Dependency map (see below). This is now their NOC view which enables them to see at a glance the health of the entire environment.
Solution
Pinpoint Root Cause with Deep Visibility into the Citrix-MEDITECH Environment
Derek decided to run a proof of concept on two solutions, SolarWinds XenApp Monitoring and Goliath Technologies XenApp Monitoring. He admitted that SolarWinds was a great network monitoring tool, but it didn’t have any visibility into key Citrix metrics like ICA/HDX Channel and logon duration breakdowns. In addition, there was no support for MEDITECH. Goliath’s XenApp Monitoring technology was purpose built to monitor and troubleshoot Citrix XenApp, and the Goliath MEDITECH Module is an industry only technology.
The technical decision by Derek was approved by management largely because Goliath offered a MEDITECH EMR/EHR performance monitoring module. It is the only software in the market that correlates end user experience metrics with MEDITECH and Citrix XenApp performance monitoring data to give IT professionals a single view into the root cause of MEDITECH performance issues. This allows IT professionals to troubleshoot and resolve issues in only a few mouse clicks regardless of what part of the infrastructure the issue took place in.
The below screenshot shows the real-time performance graph from the Goliath MEDITECH Module server performance. This perfectly illustrates the troubleshooting value of the Goliath MEDITECH Module.
Derek further explained the Goliath MEDITECH Module’s value. “We are now able to send reports and log files from your product to MEDITECH, and they, in turn, are able to work with the support staff to determine what, in the user’s work routine, is kicking off some type of issue. This is a great use case and value.”
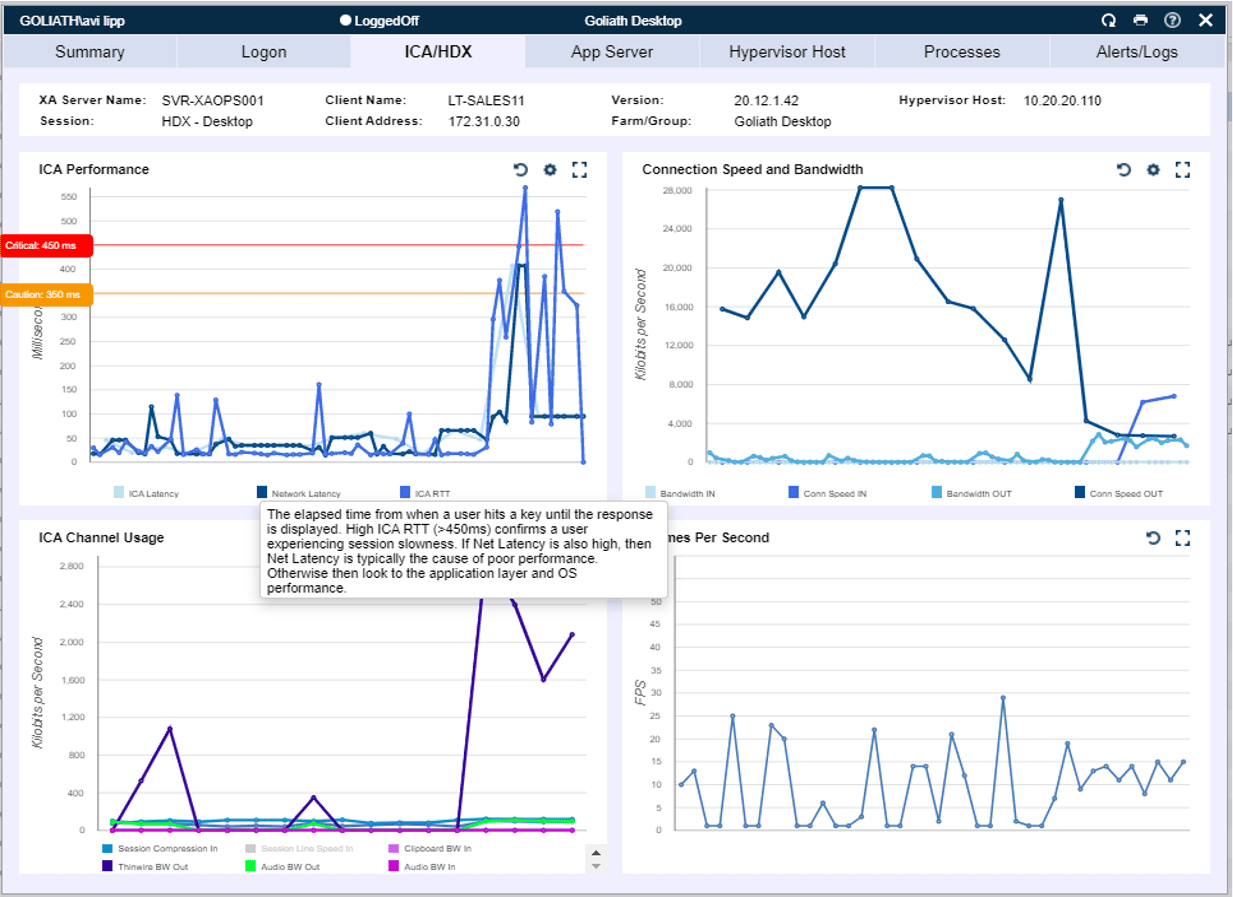
The Citrix XenApp performance, as well as end user experience, can be tracked as seen below. Again, in real time and per user, one can easily drill down into user connection performance, ICA Latency, ICA RTT, Network Latency and bandwidth to see where the issue truly persists.
The ICA/HDX tab details the ICA channel usage to and from the user’s endpoint to the user’s virtual machine or session host server. This is often a key metric in a user’s experience as most help desk calls are related to some form of latency. This tab can often be the determining factor in distinguishing if the problem exists on the network or the desktop\server.
Results
End-To-End Visibility
Pertaining to the print driver issues mentioned earlier, Derek and his team were able to see that there had been a change in how the print drivers were mapped through the Citrix policies. They changed one setting and the result was reduced printer failures from hundreds per day to less than ten.
With the help of their service provider, IntraSystems, and MEDITECH, Derek was able to put remediation actions in place that reduced printer failures from driver and MEDITECH crashes. Today, Memorial Health works to resolve issues and offer the hospital staff a positive Citrix end user experience while, at the same time, managing and monitoring the entire Citrix XenApp infrastructure proactively, including mission-critical MEDITECH.

