VMware Horizon Monitoring & Troubleshooting
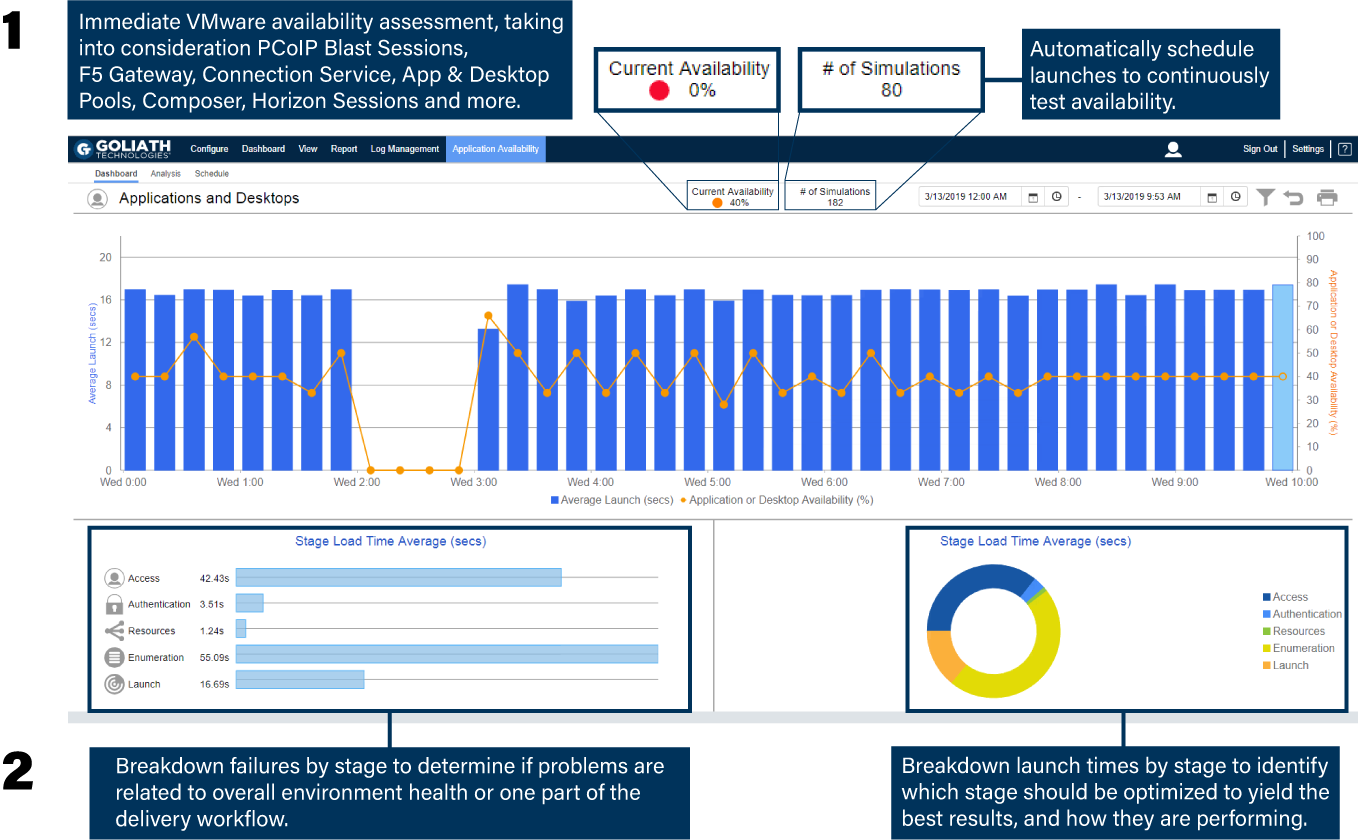
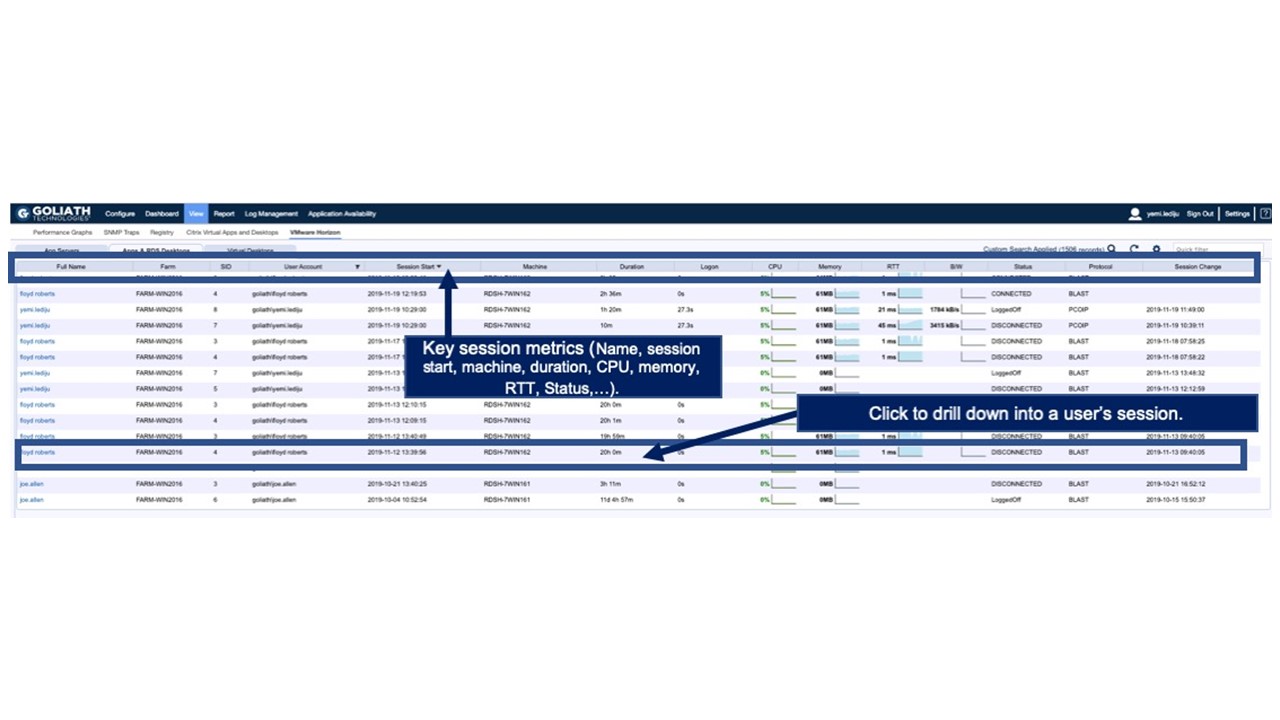
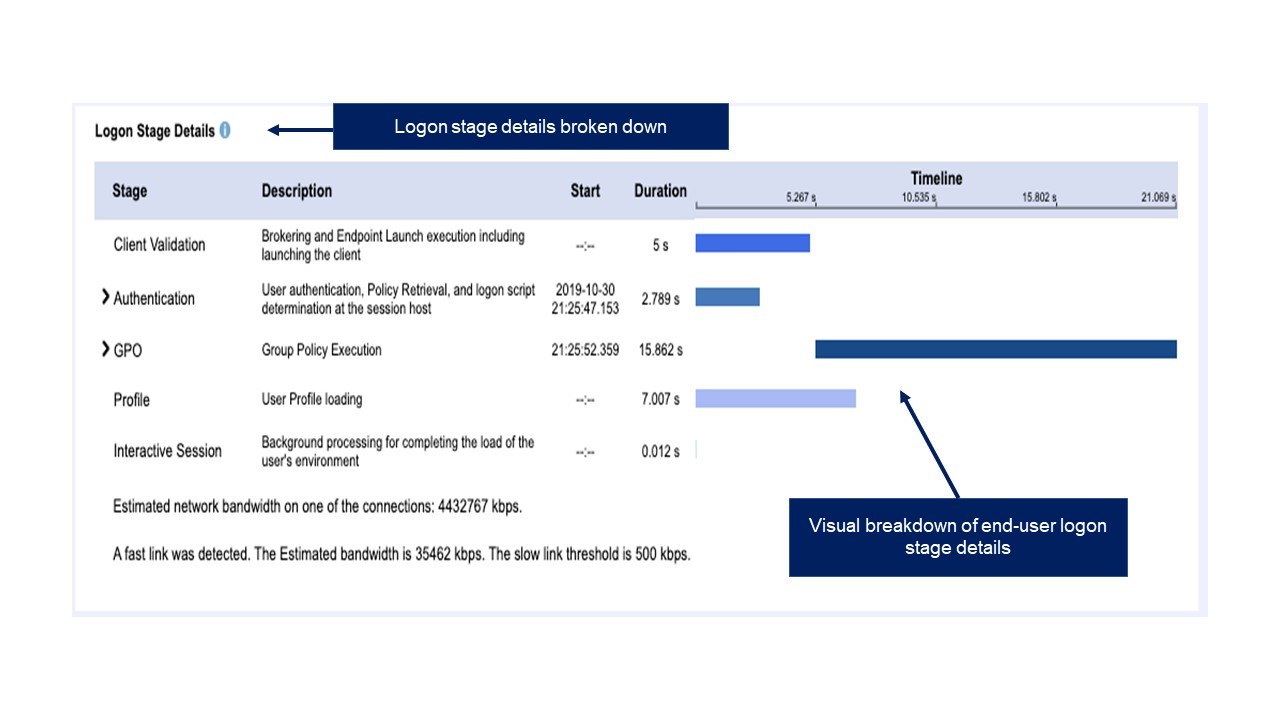
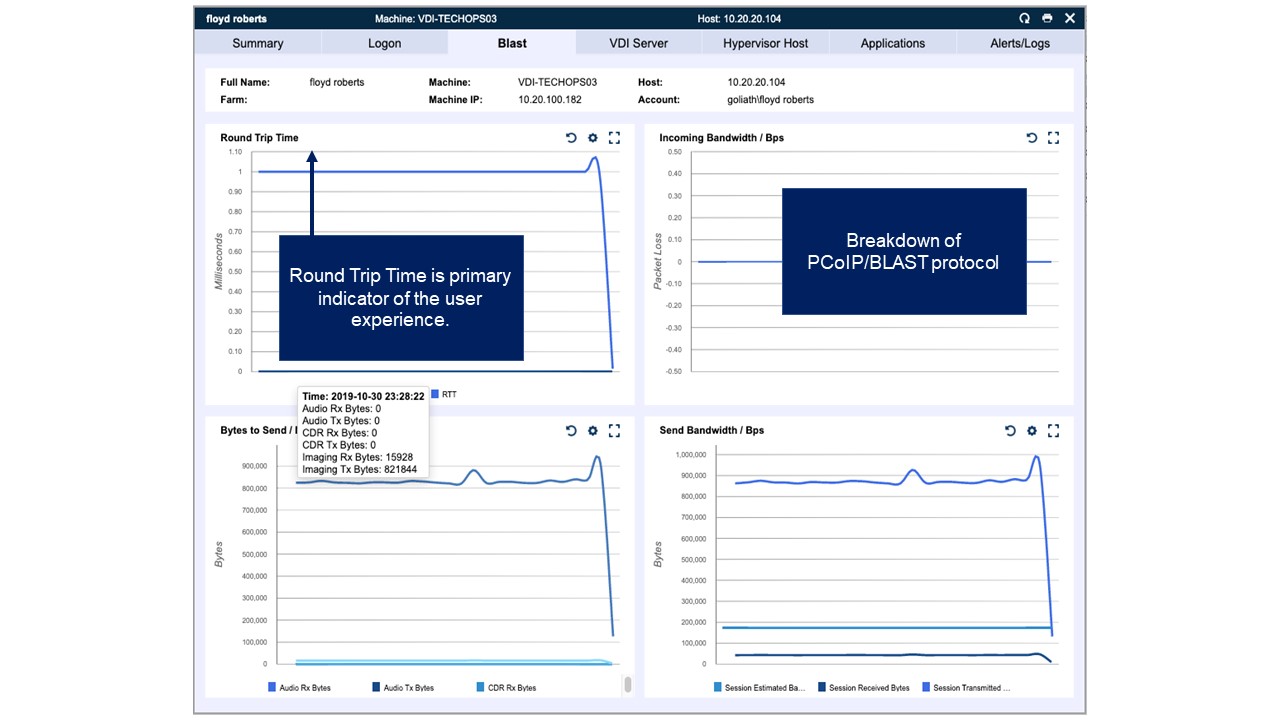
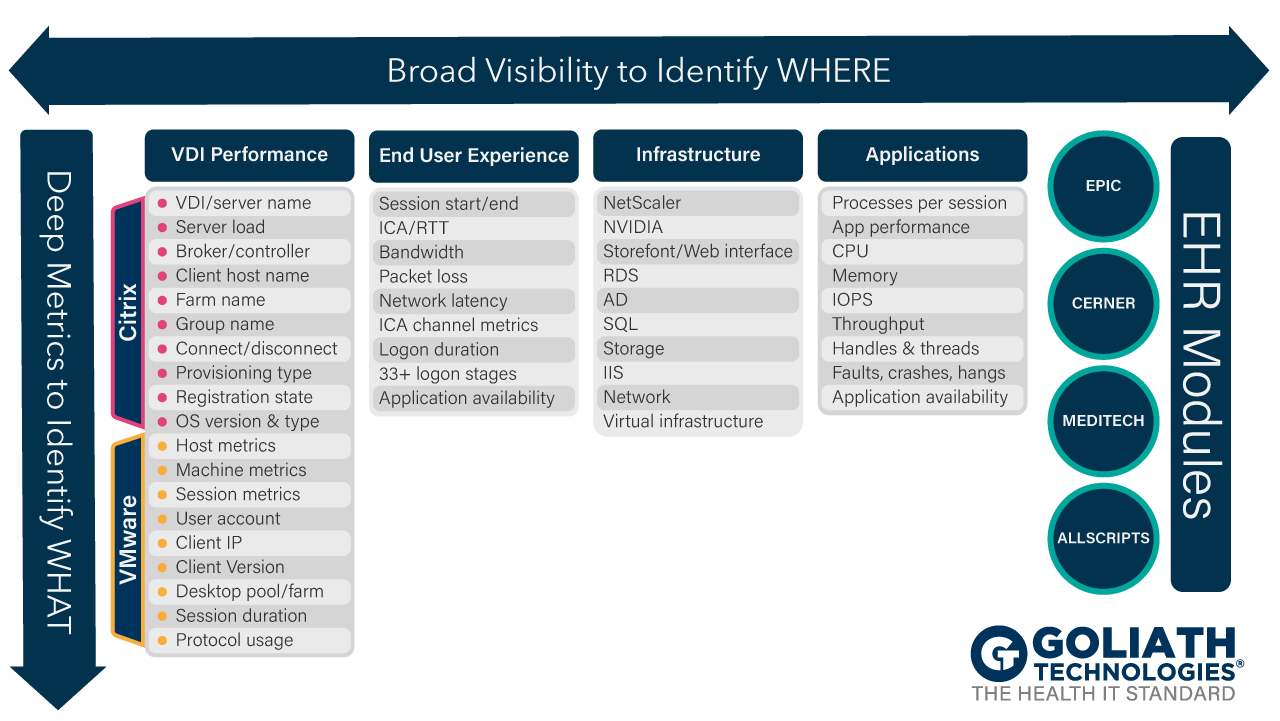
Goliath Performance Monitor for VMware Horizon brings together VMware Horizon session data, end user experience, metrics from the underlying infrastructure, and proactive application availability monitoring into a single product and console. This combination of broad and deep visiblity enables proactive anticipation, troubleshooting and prevention of end user experience issues. Unlike other solutions, Goliath Performance Monitor for VMware Horizon tracks critical metrics through integration with the Blast & PCoIP protocols, logon duration, Application, Machine, and Host Performance – all in one view. The advantage of having this information in a single console and platform is that metrics are fully aligned and integrated to show correlation and isolate how performance or resource availability impacts end user experience.
* Click above for a screenshot tour of Goliath Performance Monitor for VMware Horizon
Goliath Performance Monitor is a great alternative to vRealize Operations and has great value in a VMware Horizon VDI Environment.
Troubleshooting End User Experience Issues
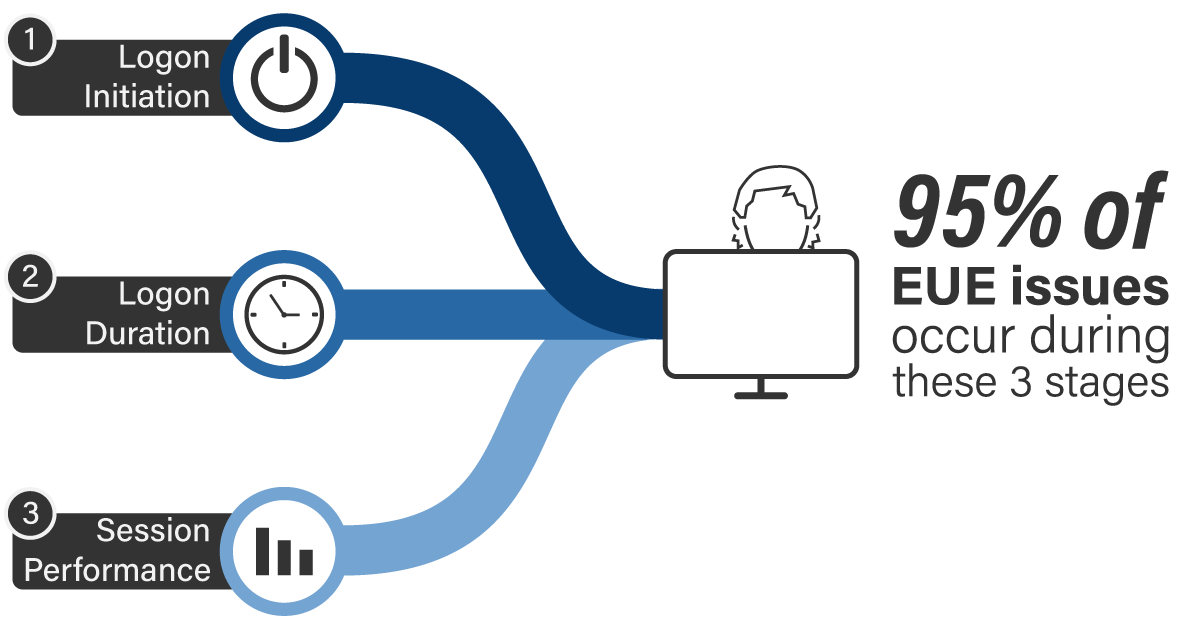
Goliath Performance Monitor provides broad and deep visibility that allows you to troubleshoot VMWare Horizon with the most comprehensive performance data available. Now, support teams and administrators can quickly identify exactly where in the delivery infrastructure a problem is occurring and what specific factors are contributing to the issue. This means specific root cause is identified more quickly and problems are resolved with minimal impact on end users. Our tools troubleshoot end user issues in many areas, but we find 95% of issues are found in three areas: session initiation, logon duration, and session performance. Goliath is built to proactively anticipate, troubleshoot and prevent the issues.
Monitoring: End To End Visibility
With Goliath Performance Monitor you get complete, proactive, end-to-end visibility into the underlying VMWare Horizon delivery infrastructure, including specific details on the end user not available to native tools. This allows you to quickly pinpoint true root cause for troubleshooting and resolution from an integrated view of the entire virtualized delivery infrastructure – not just one element of it.
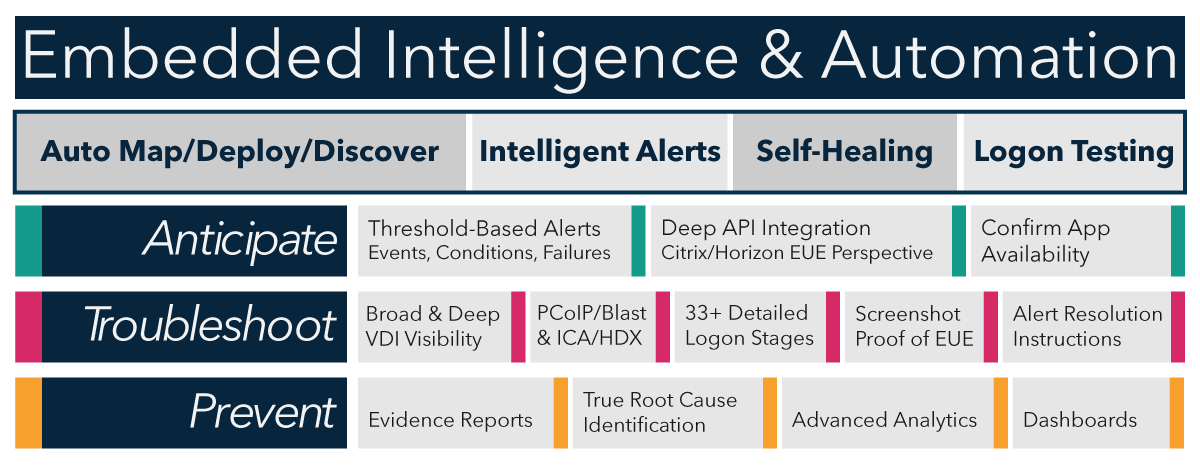
Embedded Intelligence & Automation
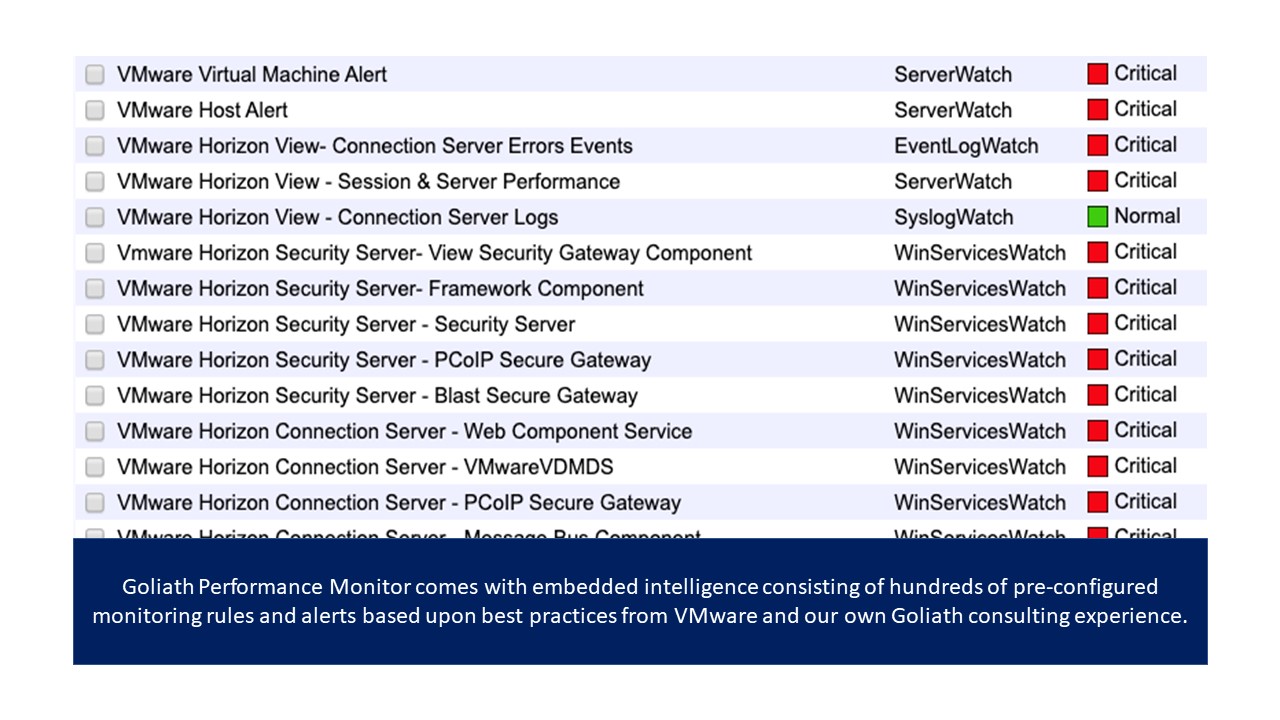
Goliath IT Operations software includes Embedded Intelligence and Automation that, out of the box, will automatically:
- Deploy to your IT Infrastructure
- Monitor over 250 key failure points
- Provide intelligent alerts on events, conditions and failures
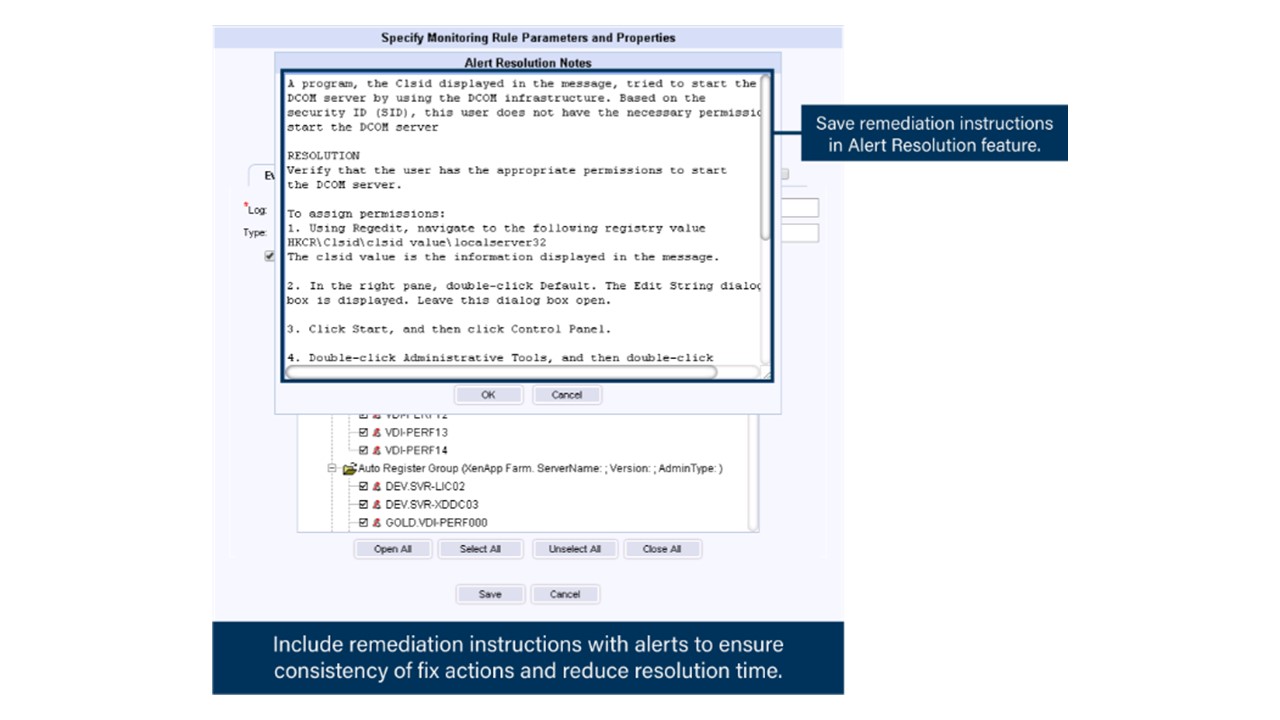
- Provide options for on-demand remediation of issues.
This embedded intelligence tells you what to monitor and how. You don’t have to be a VDI expert to to proactively anticipate, troubleshoot, resolve, and prevent performance issues in the most complex environments. Goliath Performance Monitor has the Virtualization expert included!
Advanced Reporting and Analytics Module
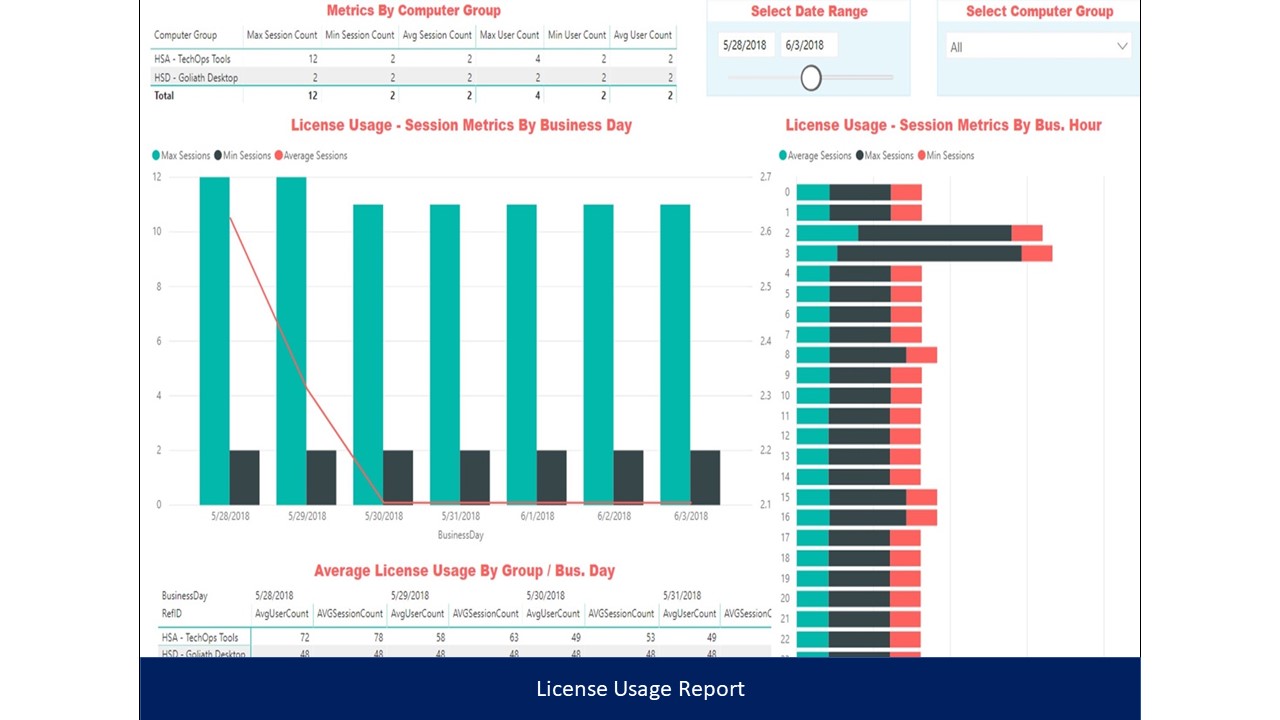
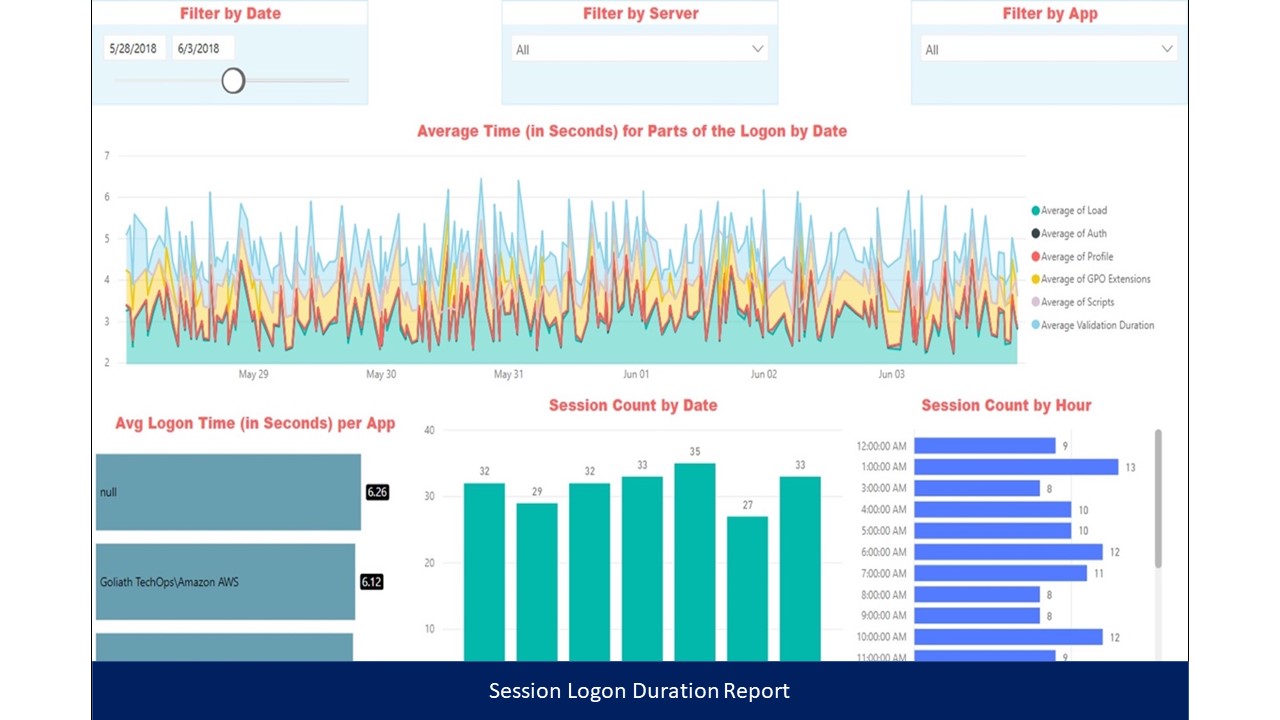
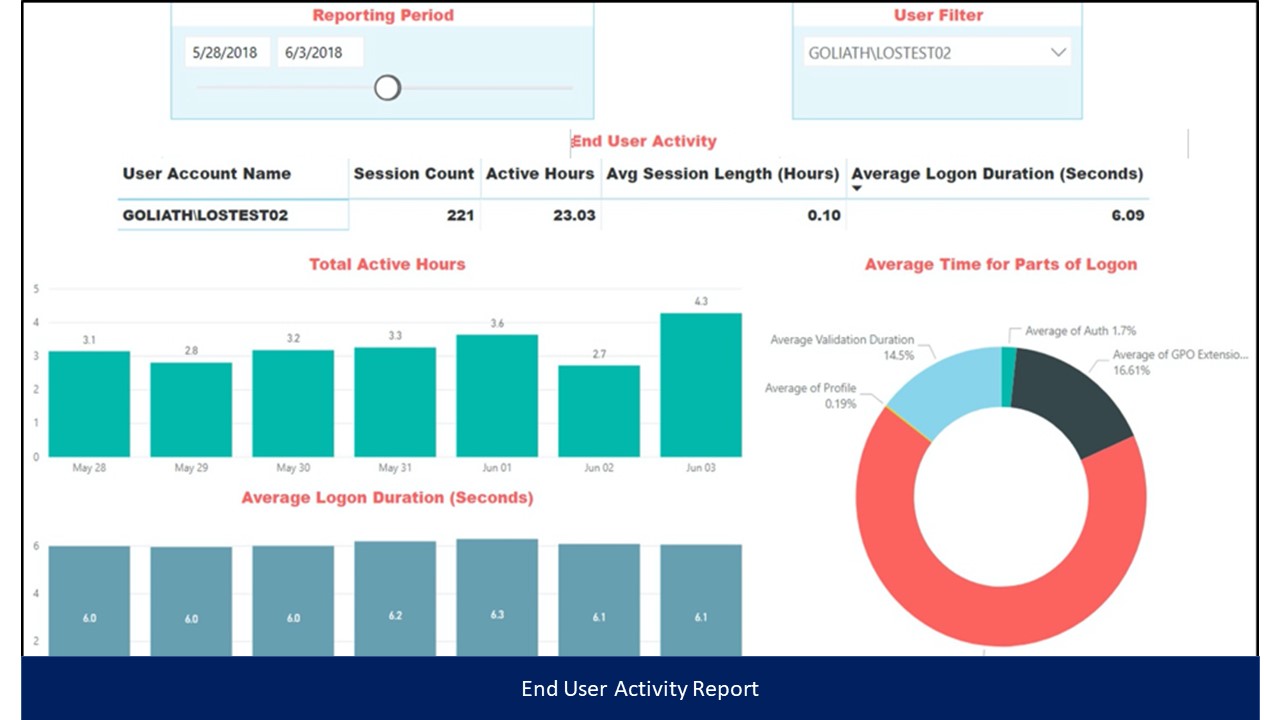
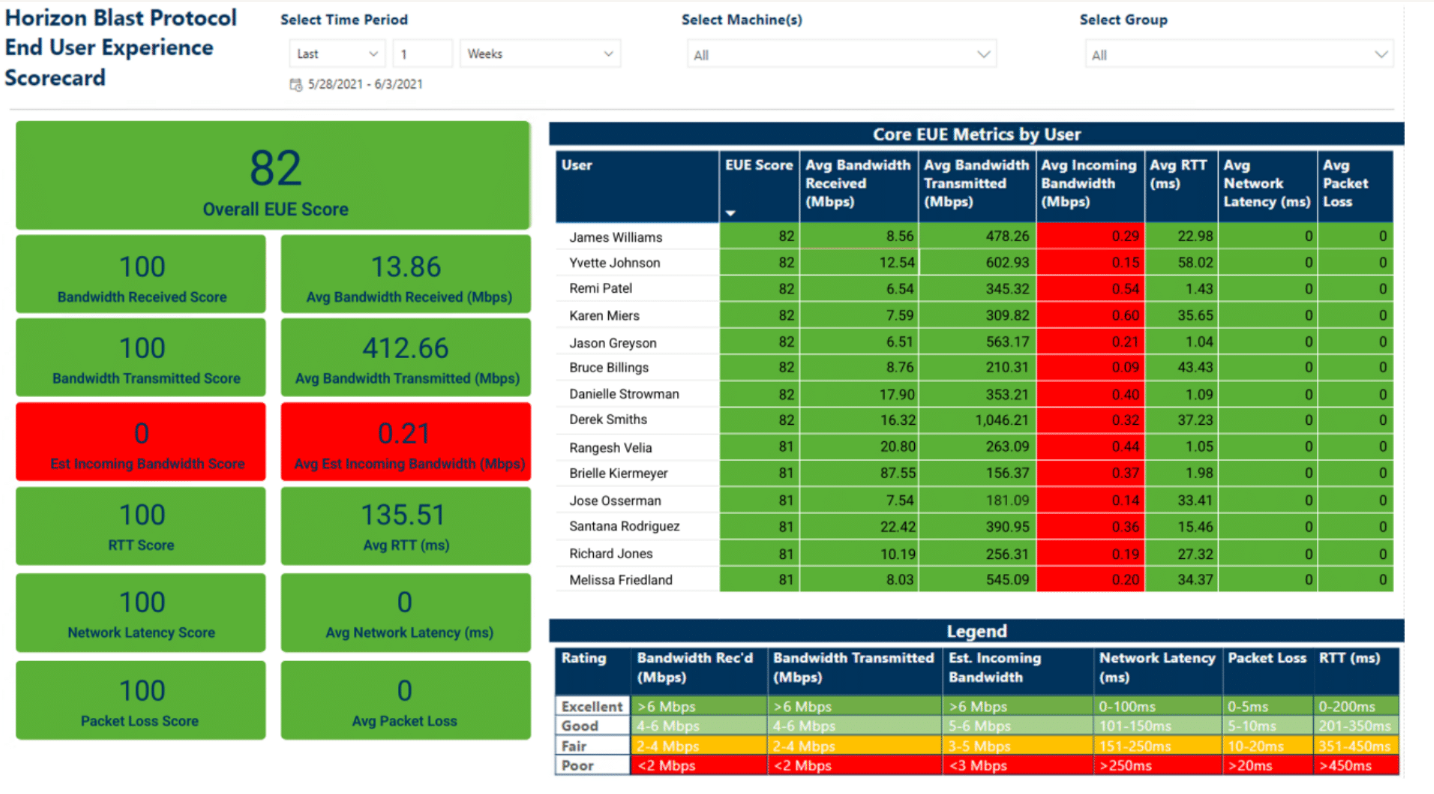
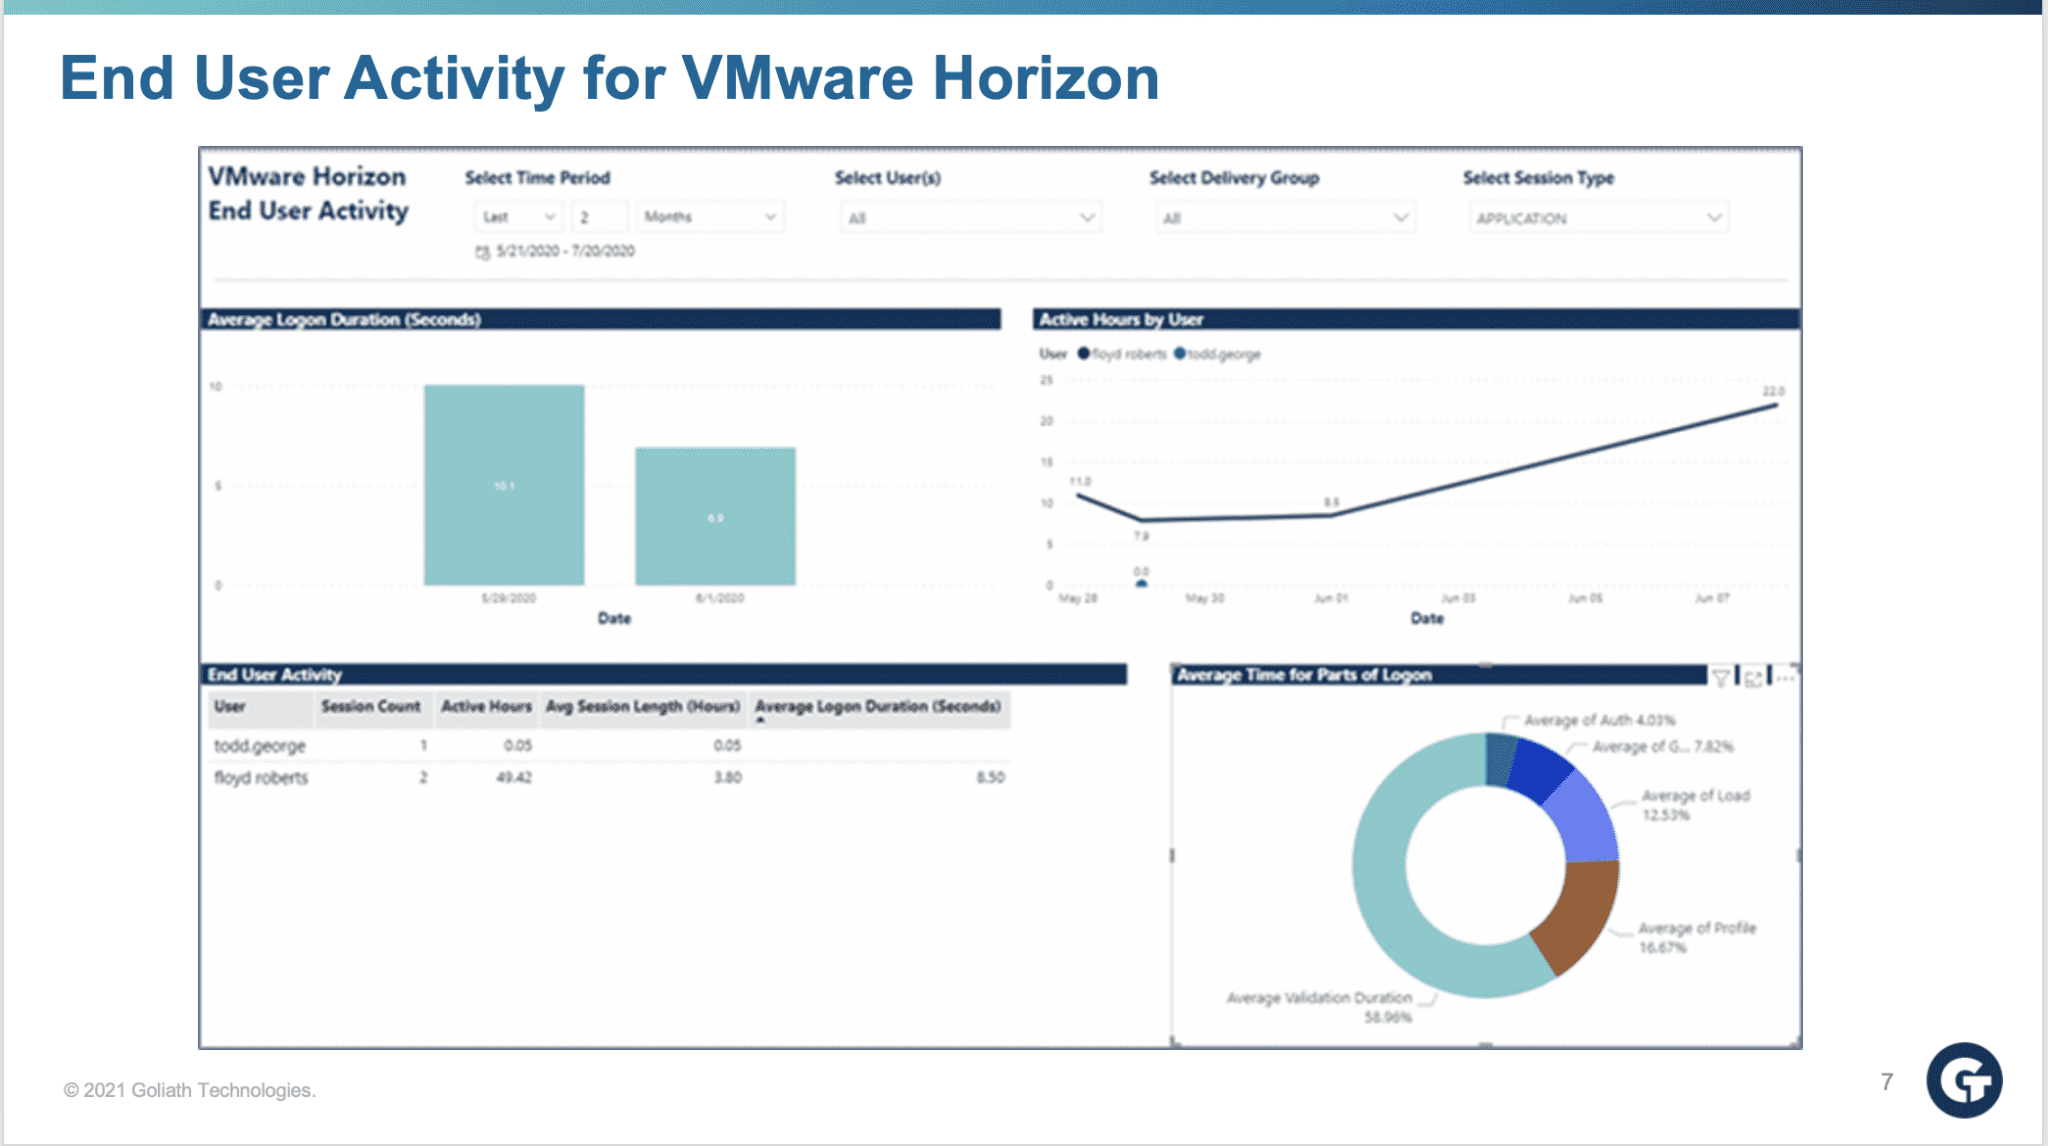
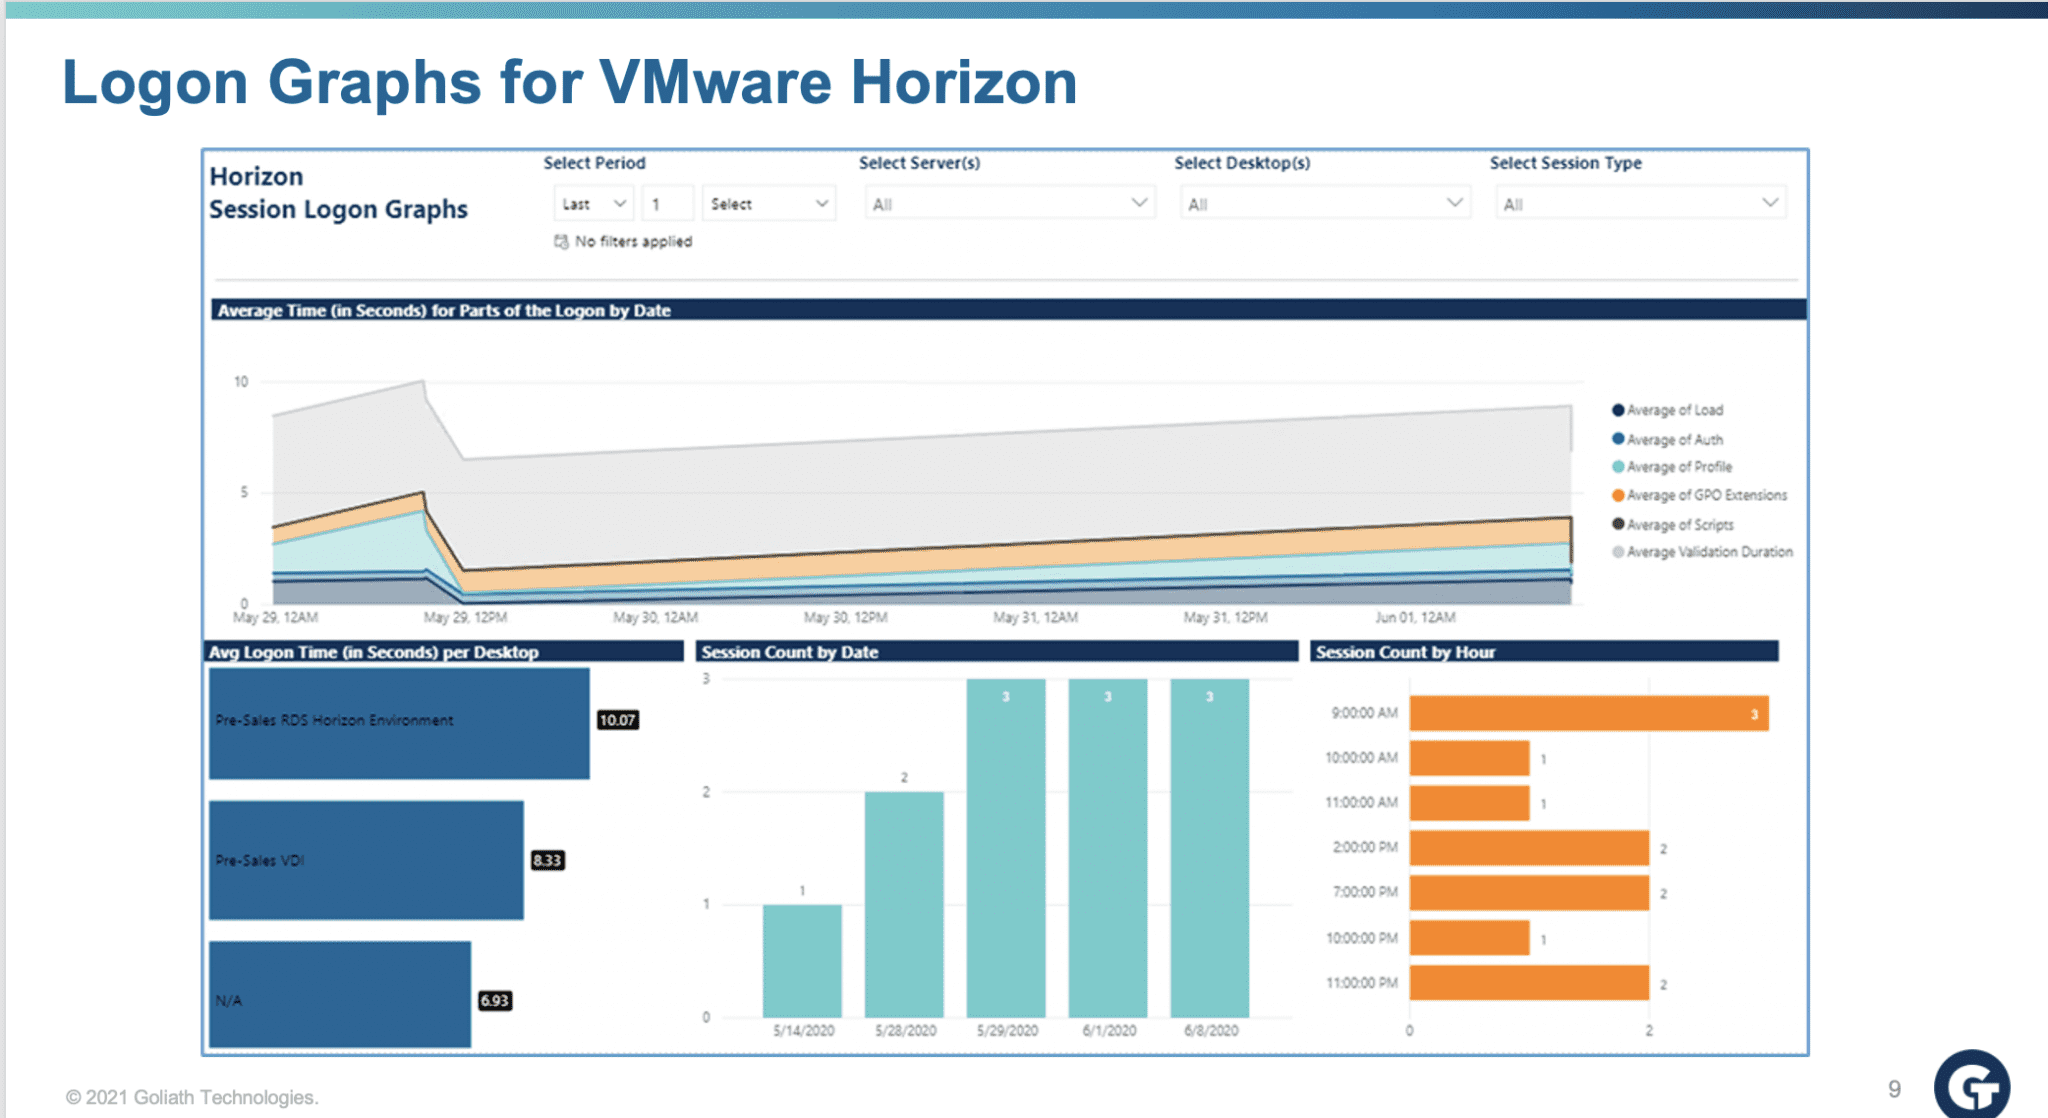
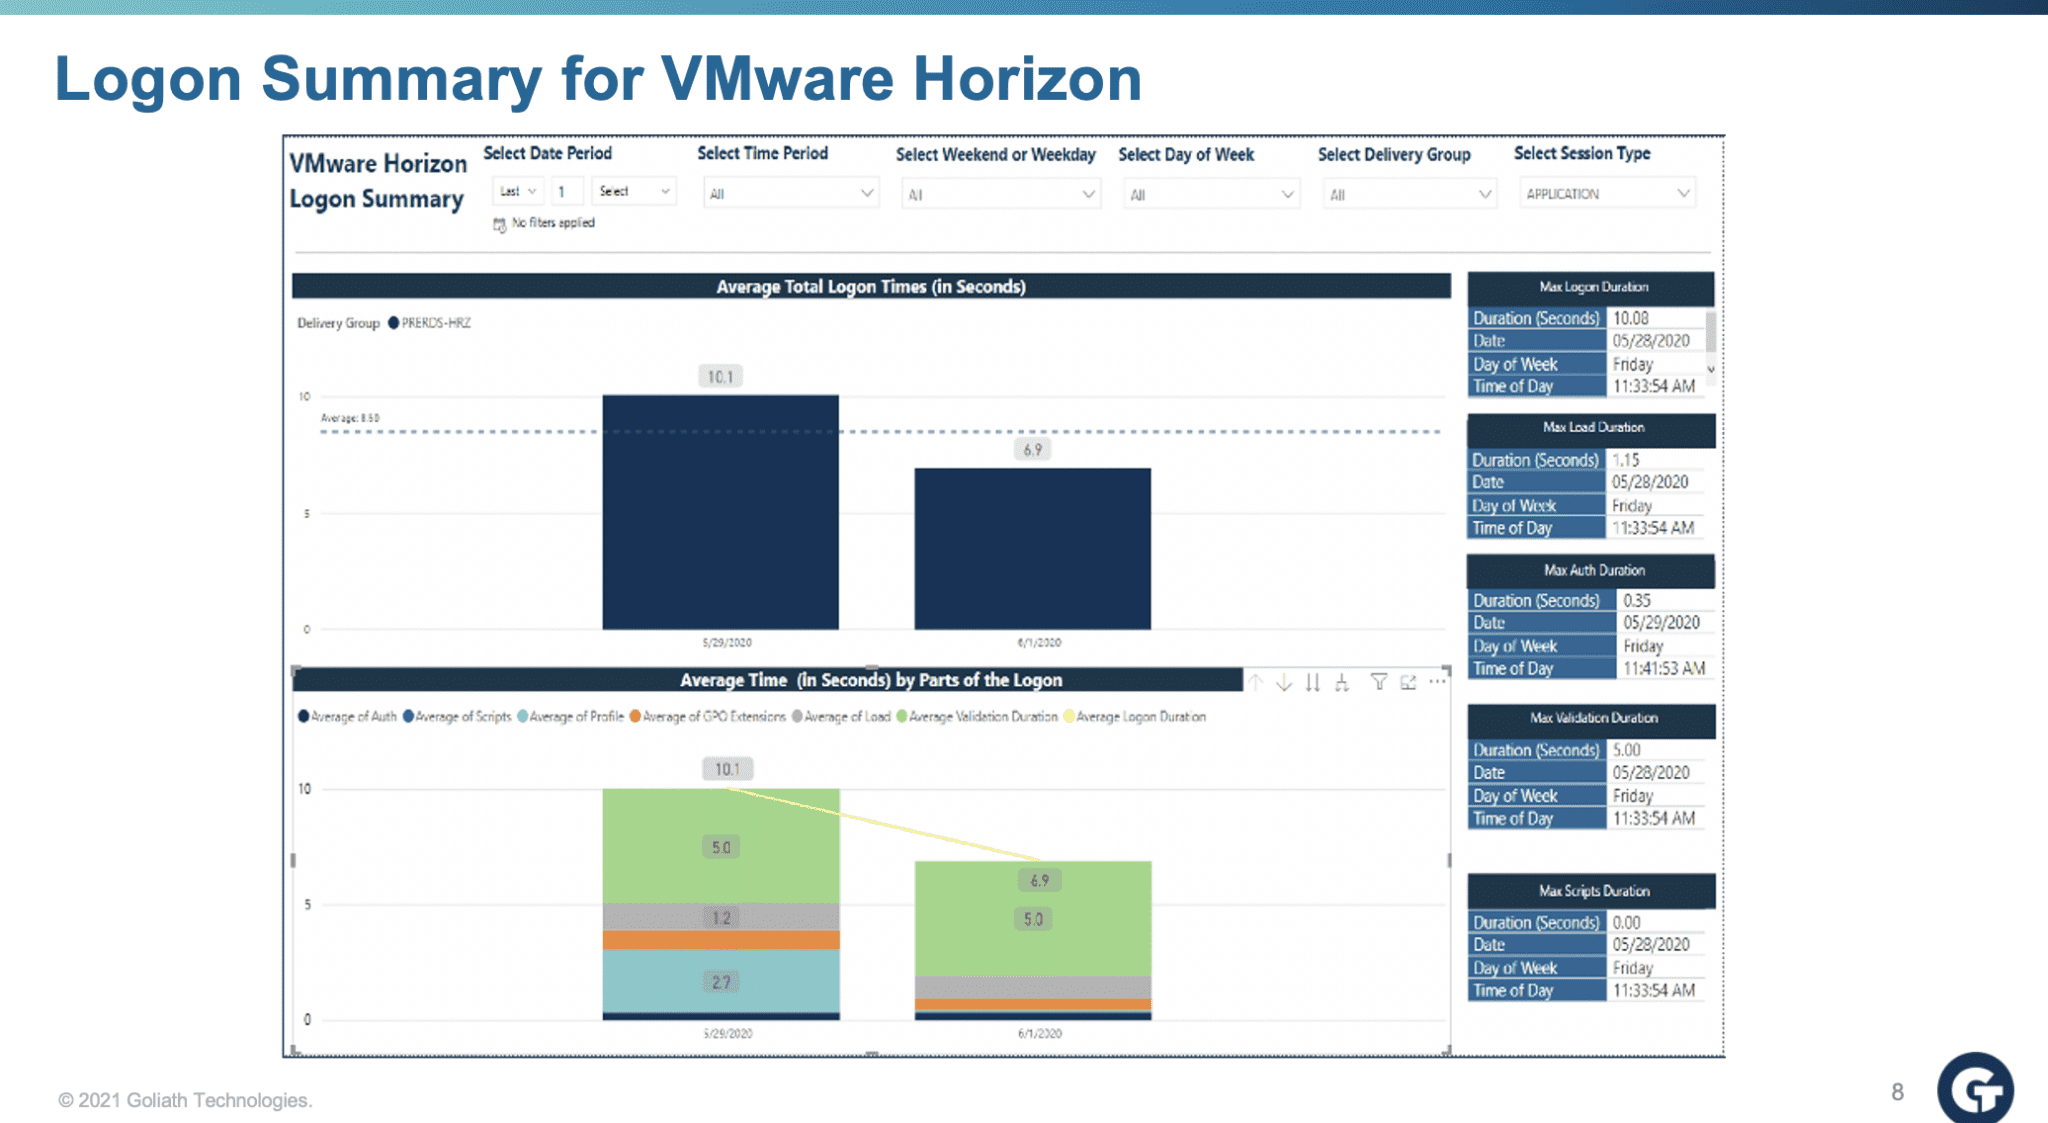
Goliath provides the metrics, details and visualization required to understand the performance and surrounding delivery infrastructure. This includes out-of-the-box reports to proactively anticipate, troubleshoot, resolve, and prevent VMWare Horizon performance issues. Customers use these reports to:
- Identify and troubleshoot end user experience issues
- Provide objective evidence of root cause to prevent future issues
- Share data with management or partners to inform business decisions
As individual customer requirements for presentation, analytics, and data correlation may vary greatly, Goliath is adding support for Microsoft PowerBI and Tableau to enable our customers to generate reports and dashboards with all of the flexibility enabled by these platforms.
Self-Healing / Remediation
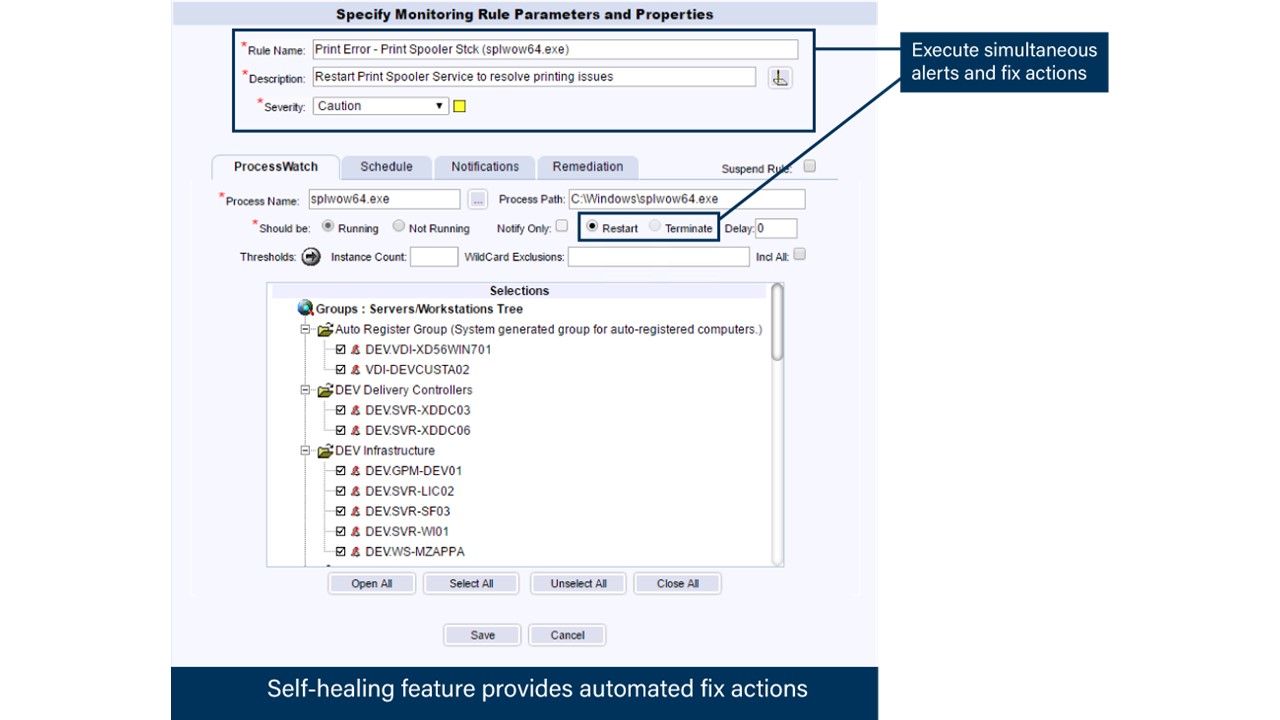
In addition to the out-of-the box monitoring rules, Goliath empowers users with self-healing and automated remediation options that can take action quickly to restart servers or services as needed when adverse conditions are detected, or thresholds are exceeded.
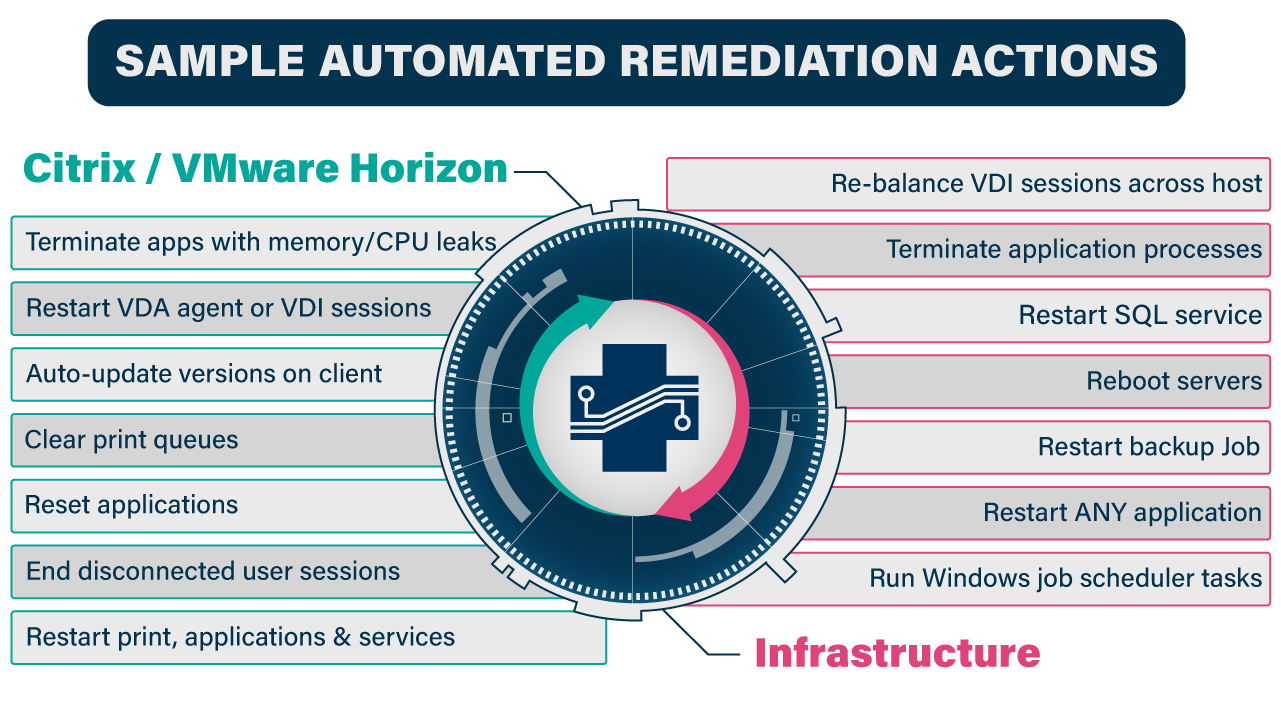
These actions are triggered by specific faults, events and conditions and execute automatically when these conditions are met to address the issue. Whether it be restarting a service, running a PowerShell script, or even rebooting a server, these are proactive “self-healing” tools that can dramatically decrease time to resolution without waiting for human intervention. Examples of available Automated Remediation actions include:
Infrastructure:
- Restart SQL service
- Unlock user account
- Rebalance VDI sessions across host
- Restart ANY application
- Terminate applications processes
- Restart backup job
- Execute Windows job scheduler tasks
- Reboot servers
