Anticipate, Troubleshoot, and Document Omnissa Horizon & VMware Issues
Goliath Performance Monitor is the only comprehensive monitoring and troubleshooting solution for Omnissa Horizon & VMware vSphere that brings together Omnissa and VMware monitoring data, end-user experience performance metrics, and all the supporting IT elements that can impact end-user experience. Goliath’s embedded intelligence and automation provide proactive alerts on any exceeded conditions, thresholds, events, or failures. This automatically alerts IT so that potential issues can be resolved before end users are impacted.
Anticipate, Troubleshoot, & Document Omnissa Horizon End User Experience Issues
Goliath monitors your environment 24/7/365 to ensure your applications and infrastructure are operational and alerts you to warning signs of failure before your users are impacted. Goliath Performance Monitor provides:
-
Proactive Proof of Application Availability
Automated end-user logons from your key locations confirm all aspects of the delivery infrastructure are working properly and applications are available.
-
Threshold Based Alerts
Our embedded intelligence monitors over 250 key failure points and automatically alerts your team to events, conditions, and failures in your environment.
-
Deep API Integration
Provides the most detailed Citrix/ VMware end-user experience metrics available so there are no blind spots that are not proactively monitored.
Goliath Performance Monitor provides broad and deep visibility across infrastructure, hypervisor, servers, operating systems, and applications to quickly identify where a problem occurs and what is causing it. We do this with:
-
Unique End-User Experience Metrics
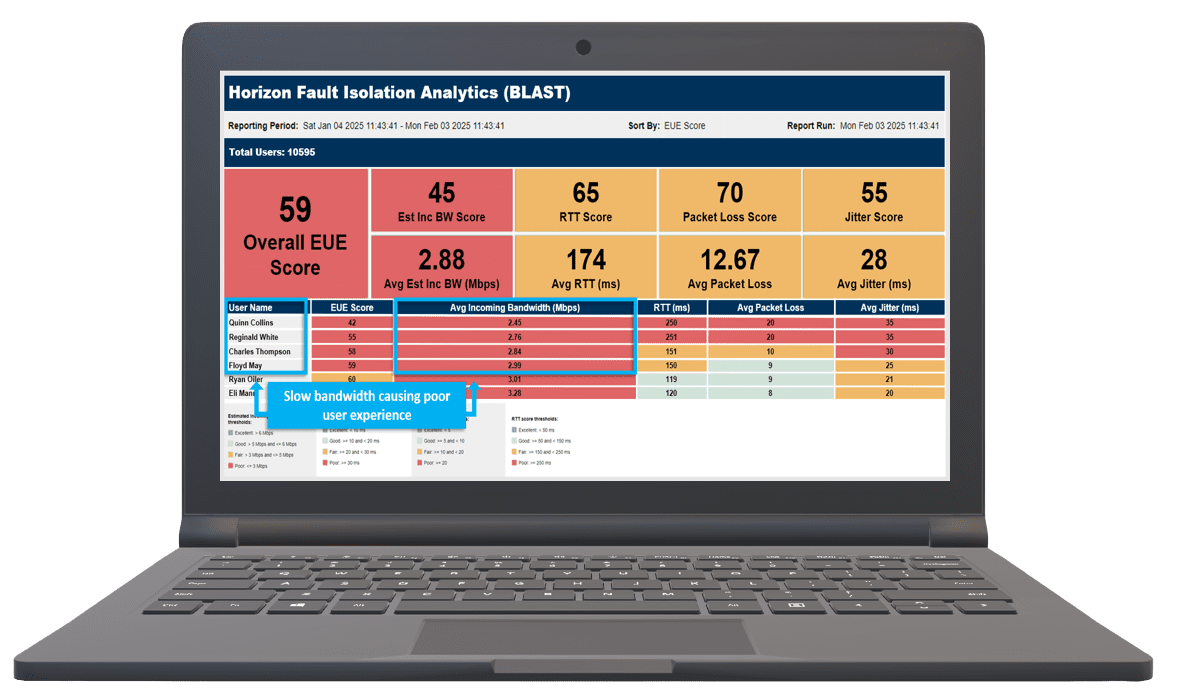
Unique metrics for ICA/HDX/PCoIP/Blast conclusively determine if networks/connectivity or server resources are the true root cause of session slowness.
-
33+ Stages of the Logon Process
Increased granular detail identifies the specific root cause of logon delays quickly – even for historical sessions.
-
Alert Resolution Instructions
GPM integrates with your existing helpdesk tools and delivers detailed remediation instructions that allow your team to fix common issues immediately without time-consuming and expensive escalations.
-
Purpose-Built EHR Modules
GPM is the only IT Operations Software with purpose-built technology that integrates metrics for EHR performance, end-user experience, and the underlying Citrix or VMware Horizon virtualization delivery infrastructure in a single view.
-
Self-Healing Remediation
GPM supports a number of “self-healing” workflows such as restarting applications or servers, logging off user sessions, restarting print services, rebalancing sessions, executing PowerShell scripts, and more.
The number-one comment we hear from IT professionals is that they want objective evidence documenting root cause so permanent fix actions can be put into place. Goliath enables this with:
-
True Root Cause Identification
Goliath’s detailed visibility means your team is able to pinpoint true root cause quickly. This ends the finger-pointing and focuses resources quickly on solving the issue.
-
Objective Screenshot Evidence
Screenshots document success or failure – including errors previously only seen from the user perspective. This allows you to collaborate efficiently with other teams, vendors, or stakeholders by showing them clear proof of the issues involved.
-
Advanced Analytics and Reporting
GPM provides 66 out-of-the-box reports that provide critical insights into the end-user experience trends in your environment. Further, we integrate with advanced analytics engines like Microsoft Power BI and Tableau, so you can create powerful visualizations to analyze and understand your specific issues and environment.
Advanced End User Experience Analytics
Goliath is the only monitoring & troubleshooting solution for Omnissa Horizon that can let you know actual end user experience – without the need for self-reporting. You’ll know, on-demand:
• Which users are impacted
• Frequency & duration of issues
• Likely root cause
vSphere Capabilities
Goliath Performance Monitor for VMware vSphere provides monitoring, analysis, reporting, and remediation for VMware vSphere. A server administrator now has the ability to monitor virtual machine performance and set threshold-based alerts to warn them if any key virtual server performance indicator like CPU, Memory and Disk is approaching a level where users can be impacted. This early warning system gives virtual server administrators the time to resolve issues before a ticket is created.
The Goliath VMware vSphere performance monitoring software provides complete visibility into the 5 layers of the VMware vSphere virtual stack– Host, VM’s, Application, OS, and Hardware.

