Citrix CTP Blog
Goliath Technologies Delivers Unmatched Troubleshooting Capabilities in New Release

Whilst Citrix Synergy 2019 was in full-flow in Atlanta, GA, Goliath Technologies were also keeping busy with the 11.7.8 release of Goliath Performance Monitor, which adds several features that were in demand by many customers.
I’ve had the chance to review this latest release, and wanted to touch on some of the features that are new to version 11.7.8, as well as cover ground on some of the features and capabilities already existing in the product today.
Troubleshooting Workflows
When an IT administrator receives alerts or calls from users reporting that their session is slow, their logon times are slow, or they cannot complete a specific workflow, often these calls are challenging to resolve because there are many components and factors at play that could be contributing to the issue.
Goliath Performance Monitor (GPM) makes such reported faults easier to resolve by presenting to the administrator essentially the components of a Citrix environment and related infrastructure that are healthy, versus those that are under stress or in a failed state. The administrator can know when issues arise in an environment before users are impacted either by the various dashboards made available by GPM, or via proactive alerts via email or common ticketing systems.
With the information provided by GPM, take for example a logon duration report, the wealth of information is powerful to an administrator, but may require additional documentation to one who is not familiar with troubleshooting at such a detailed level. Since Goliath Performance Monitor captures over 33 stages of the logon process, there will be times when one or two metrics report back with high times, and the administrator may not exactly know how best to interpret what is being called out, or how best to troubleshoot the issue.
The new Troubleshooting Workflows are designed to help administrators with all levels of troubleshooting experience use the data Goliath Performance Monitor is collecting and presenting, to their advantage. You will be able to step through common troubleshooting issues backed up by real world use cases, and how to combat them effectively. This means IT professionals will be more effective and faster when it comes to resolving end user experience issues.
Network Operations Center (NOC) View
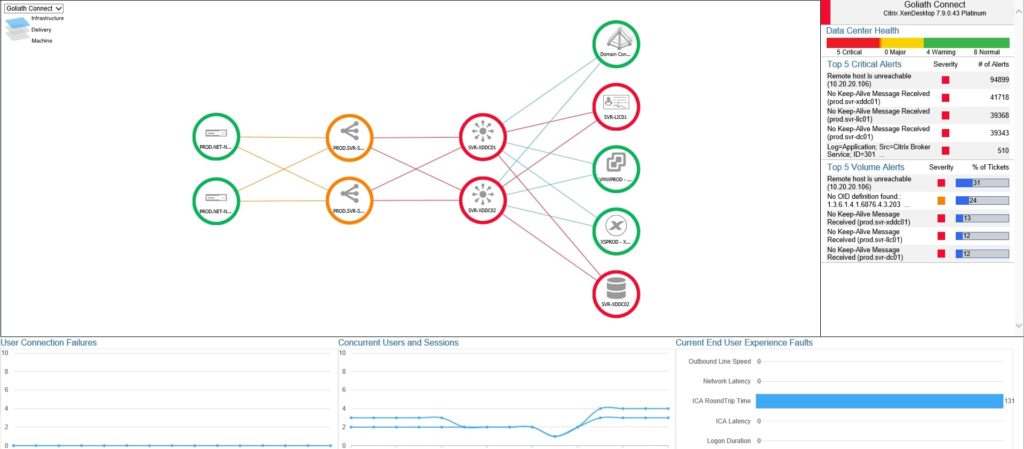
The Goliath Topology View shows you a high level view of your Citrix infrastructure, also known as the NOC view, with colour coding that represents the health of each component. This allows a Citrix administrator to very easily identify if a component is not operating as it should. You do not need to manually build out the dashboard. The system is intelligent enough to automatically map out all of your Citrix infrastructure components such as Delivery Controllers, Delivery Groups, and Machine Catalogs, and create physical and logical connections with other components in the environment.
This view is now enhanced by customised performance dashboards which provide a more detailed view of key metrics to support the overall health shown by the Topology View.
Those dashboard could be multiple datacentres, Citrix sites, or the different layers that GPM reports on. Dashboards auto-refresh at intervals configured by you, which is an existing capability of the product. With 11.7.8 these dashboards auto-refresh and auto-cycle, so you can now have multiple dashboards configured and displayed at defined intervals. With the NOC view, auto-refresh and auto-cycle functions, you can display powerful, flexible dashboards to mounted monitors or splash screens in your operations rooms or service desk centres.
Electronic Health Record Specific Modules
Goliath Performance Monitor 11.7.8 delivers unique, purpose-built modules for major EHR applications such as Epic, Cerner and MEDITECH to monitor and troubleshoot those mission critical systems. These modules, customer experience, and EHR vendor relationships establish Goliath Technologies as the Health IT Standard for monitoring and troubleshooting.
If you work in healthcare IT, you will know that a failure or simple performance degradation of an EHR system could have massive impact on patient care. Whilst we focus on our Citrix environment, it is equally as critical to monitor and troubleshoot the applications too, and the backend components that make them tick. With that in mind, you will want to support your EHR environment with products that go beyond simply UP and DOWN monitoring.
Features such as the Early Warning System from Goliath accesses these mission critical applications just like a real user would, and reports back details on logon times including screenshots if any errors exist in the logon and launch process. Resource load for virtual machines and the Citrix delivery infrastructure is constantly monitored, ICA latency is captured and so on. The information you need to ensure successful uptime and delivery of critical EHR applications on Citrix is taken care of with Goliath, and when things begin to go wrong, you can be proactive in troubleshooting before end-users are impacted.
Given that systems such as Epic are often accessible via Citrix Virtual Apps deployments, Goliath Performance Monitor can be the single platform for customers to monitor both their Citrix and EHR environments.
Intelligence and Automation
The intelligence and automation built into the product allows an organization to prevent end user experience issues by focusing on the logon initiation process, logon process, and in-session performance. These are the three most common causes of a call to the helpdesk.
With over 250 key failure points being monitored out of the box, you don’t need to be a VDI expert to configure Goliath Performance Monitor, as it self-configures for you, which allows you to get to troubleshooting the environment quicker. The product also discovers and maps out your Citrix infrastructure to a Topology View, and has the ability to auto-deploy agents out to your virtual machines.
If specific faults, events or conditions are triggered in your environment, Goliath can automatically take care of the situation by restarting services, rebooting servers, or even running PowerShell scripts without the need for human intervention. This dramatically increases the time for resolution, and reduces the chances of an issue impacting end-users, as the issues are resolved right away as soon as they are initially detected. Both the Citrix workers and related infrastructure benefits from automated remediation actions. Some examples of automated remediation actions include:
- Clearing print queues.
- Ending disconnected user sessions.
- Rebooting infrastructure servers, or services.
- Rebooting VDAs, or services.
- Terminating application processes.
As IT teams are always struggling to do more with less, it’s easy to see how these capabilities handle the monitoring and alerting tasks and speed troubleshooting and resolution – freeing team members to focus on other critical projects.
Advanced Reporting Capabilities
With every Citrix or End User Computing deployment, the user experience plays a large part in the success of the deployment. A lack of reporting capabilities prevents trends or larger issues from being discovered over time as a deployment matures, or as changes are made to the environment. It also prevents you from providing management with reports that would help justify the need for hardware upgrades, software upgrades, or new technology purchases. It also prevents you from sharing the success of a deployment or future upgrade with the business.
More than 66 reports exist out-of-the-box in Goliath Performance Monitor, allowing you to produce all sorts of thinkable reports from Citrix session activity, Virtual Apps ICA latency, user logon times, VMware ESX storage usage and much more.
The advanced reporting capabilities does not stop there. Goliath allows customers to leverage third-party reporting platforms such as Microsoft Power BI, Microsoft Excel, and Tableau to generate reports. This allows you to take advantage of the features and capabilities of these platforms to generate your reports. Goliath provides templates and view to jumpstart the use of these reporting platforms.
Summary
The Troubleshooting Workflows, which gives customers real world troubleshooting scenarios including how to solve them, and the ability to auto-cycle NOC view dashboards are my top picks out of this new release. These two features alone help Citrix administrators with various levels of experience troubleshoot issues more effectively, and more proactively monitor their environment(s).
That said, these features continue to enhance an already powerful feature set. Having over 66 reports available out-of-the-box is a great help for an IT administrator, as most likely there will be a report that suits the needs of the business without having to create a custom one. If in the event a custom report is needed, there is helper documentation online and linked to the product itself that can assist with creating your own reports.
The intelligence and automated remediation capabilities are also powerful functions of the product, and allow specific issues to be automatically resolved without a Citrix administrator taking time out of their other important tasks to get involved with troubleshooting.
About the Author: Goliath Tech Team
The team members collaborated to bring together this blog post by calling on their past Customer Experiences and Expert Knowledge of Citrix Troubleshooting. Beyond writing technical documents this team supports Goliath Customers and provides product feature and function guidance to development.


