Dieter Sumerauer – Rady Childrens – How They Did IT – March 2026

Dieter Sumerauer – Rady Childrens – How They Did IT – March 2026

How They Did IT

Rady Children’s: Improved Oracle Stability and Clinician Satisfaction by 13% with Evidence-Based Decision Making

“What mattered was that none of our remediation actions were shots in the dark. We were not just upgrading infrastructure and hoping something improved. Each action was targeted and justified by the data. That is an important distinction, because IT budgets are finite and you cannot afford to make blanket investments hoping you hit the right issue.”

-Dieter Sumerauer

Want to learn more? Request to speak with a healthcare IT consultant.

Thomas Charlton:

Dr. Sumerauer, can you start by telling us a little about your background and your current role at Rady Children’s Health?

Dr. Dieter Sumerauer:

I’m the Associate Chief Health Information Officer at Rady Children’s Health in Orange County, which was previously known as CHOC, Children’s Hospital of Orange County. I joined about two years ago after serving as Medical Director of Ambulatory Healthcare Informatics for Pediatrics at University Hospitals of Cleveland. I started out in private practice, and early on I was doing things like wiring my own office and building wireless networks. That curiosity about the intersection of technology and care delivery has defined my career path ever since.

Thomas Charlton:

Let’s frame up what was happening at Rady’s before Goliath became part of the picture. What were you hearing from your clinicians, and what did your data actually tell you at the time?

Dr. Dieter Sumerauer:

The honest answer is that we didn’t know what we didn’t know. What we did know was that our frontline clinicians were complaining about long login times, overall system slowness, and the system not completing tasks, and ultimately crashing. And yet on the technical side, the prevailing view was that we were delivering good system stability and good speed to our end users.

There was a real disconnect. The people providing care on the front line were suffering, and the technical people were saying they couldn’t understand why, because everything looked fine on their end. The problem was that we had data on what we thought we were providing, but not on what was actually being delivered. It’s a bit like your internet service provider promising speeds up to 1 gigabit, while that may be the specification, it’s not necessarily what you’re getting at your device.

To borrow a phrase from Dr. Peter Pronovost at University Hospitals: “Waiting is suffering”. And I feel strongly that my real customer is the patient. Our clinicians are a conduit to that customer. When they are waiting for data, waiting for the system to respond, the patient is the one who suffers, waiting longer for answers, waiting longer for their physician to walk through the door. That is what was at stake.

Thomas Charlton:

How were you gathering feedback from clinicians before you had objective performance data? What channels were available to you, and where were the gaps?

Dr. Dieter Sumerauer:

We had multiple avenues via email, Microsoft Teams, the help desk, and a KLAS survey. We were working hard to collect as much input as we could. But you can only “round” so much, and there are only so many hours in the day. What you really need is the evidence to back up what your end users are telling you. Without that, you end up in a frustrating standoff: clinicians are saying something is wrong, and the technical team is pointing to infrastructure metrics that look healthy. Everyone is entrenched in what they think they know.

Thomas Charlton:

Your CHIO, Dr. Steve Martel had been advocating to bring Goliath in for two years before it finally happened. What was the tipping point? And when we eventually engaged together, you took a leadership role in pulling all the right parties into the room – Oracle, the internal IT team, the application team. Can you walk us through how that came together?

Dr. Dieter Sumerauer:

At the same time you and I connected, which happened when we met at the KLAS summit in Salt Lake City, I had already been in conversations with Oracle about why some of these performance issues were occurring. The responses we kept getting were, essentially, “it’s not on our end.” I was not convinced.

So, it became about relationship-building and getting the right people at the table. We were post-pandemic, and people were not coming on site. I pushed to get Oracle’s team to actually come in and experience what our frontline physicians were experiencing firsthand. And while we had them here, it made sense to also have Goliath present to test the connections and look at how the product was actually being delivered to end users.

The data turned out to be illuminating for everyone, our internal technical team and the Oracle team alike. We found problems on both sides, though more of the issues ultimately traced back to our environment. That was important. It moved the conversation from defensiveness to shared accountability.

Thomas Charlton:

Once the data was in hand, what specific actions came out of it? I’m thinking about the targeted investments that were made based on what Goliath surfaced.

Dr. Dieter Sumerauer:

The data was genuinely eye-opening. It showed us that we really did not know what we thought we did. We ended up replacing laptops at specific locations where the data showed slowdowns, devices that had exceeded their replacement lifecycle but had not been flagged through our normal processes. We increased bandwidth to affected sites. We replaced network switches that were limiting throughput. We also identified end-of-life servers in our server farm that were contributing to the problem.

What mattered was that none of these were shots in the dark. We were not just upgrading infrastructure and hoping something improved. Each action was targeted and justified by the data. That is an important distinction, because IT budgets are finite and you cannot afford to make blanket investments hoping you hit the right issue.

Thomas Charlton:

Going forward, you’ve mentioned using this data not just retrospectively but proactively. How are you thinking about the ongoing role of performance visibility at Rady’s?

Dr. Dieter Sumerauer:

The data is only valuable if you act on it, and ideally if you act on it before users start complaining. If we are actively monitoring trends, we should be able to use the data predictively, identifying when a system is trending toward a problem before it surfaces as a clinical disruption.

On the transparency side, I plan to publish performance metrics through our monthly clinician newsletter, essentially speed dials that tell our end users how the system is performing, whether login times are improving, and where we are relative to where we were. Transparency builds trust. When clinicians see that you are measuring and responding to the same things they care about, the relationship between IT and the clinical side changes.

Thomas Charlton:

You have a clear point of view on the evolving role of the CHIO. Can you share how you think that role is changing, particularly in relation to the technical side of delivery?

Dr. Dieter Sumerauer:

I think the separation between clinical informatics and the technical infrastructure world is artificial, and we are recognizing that more and more. You are seeing more clinicians move into CIO roles, and I believe that is because the field has finally acknowledged that you cannot have a good product if it is not delivered efficiently.

The CHIO used to be focused almost exclusively on the clinical tools within the EHR, like the order sets, the documentation templates, and decision support. And those things matter. But if the system crashes when a physician tries to access it, or if it takes 90 seconds to log in, none of that other work matters. The delivery mechanism is part of the product. To not give me visibility into the technical delivery side of things is to hamstring me in my ability to serve my end users and, ultimately, the patients.

That is why you are increasingly seeing CMIOs and CTOs working together more directly, and why the conversations at health system leadership level are starting to bridge those two worlds.

Thomas Charlton:

Final question: for CMIOs and CHIOs who find themselves in a situation similar to where you were with clinicians complaining and technical teams confident everything looks fine, what would you tell them?

Dr. Dieter Sumerauer:

Get the data. To best advocate for your clinicians, you need evidence to support the claims they are making. Without that evidence, it is very hard to move anything, because people get entrenched in what they think they know.

We practice evidence-based medicine on the clinical side. There is no reason we should not be practicing evidence-based decision-making in IT as well. Once you have that evidence, once you can show where the problem actually exists in the delivery chain, the case becomes clear-cut. Without it, you are guessing. And in healthcare, guessing costs people time, and time costs patients.
To learn more about how Goliath helps health systems surface and resolve clinician EHR experience issues, reach out directly at techinfo@goliathtechnologies.com or request to speak with a healthcare IT consultant.


Dieter Sumerauer – Rady Childrens – How They Did IT – March 2026

New Digital Experience Data Isolated the Cause of Epic Hyperdrive Slowness

New Digital Experience Data Isolated the Cause of Epic Hyperdrive Slowness

This is the second post in the two part blog post that tells the story of how we engaged with the second largest nonprofit health system in the US to improve clinician experience with Epic Hyperdrive.

In the first post of this two-part series, we started the Epic Speed & Reliability Improvement Program by establishing a baseline of the clinicians’ actual experience when using Epic Hyperdrive. We use technology to collect and correlate this data across 100% of the users, so it is not a survey or in any way subjective. We are looking at the digital footprint of every clinician to frame up the size of the problems, whether loud and/or broad, isolate root cause, and determine remediation plan based on the findings.

Want to learn more? Request to speak with a healthcare IT consultant.

The Analysis

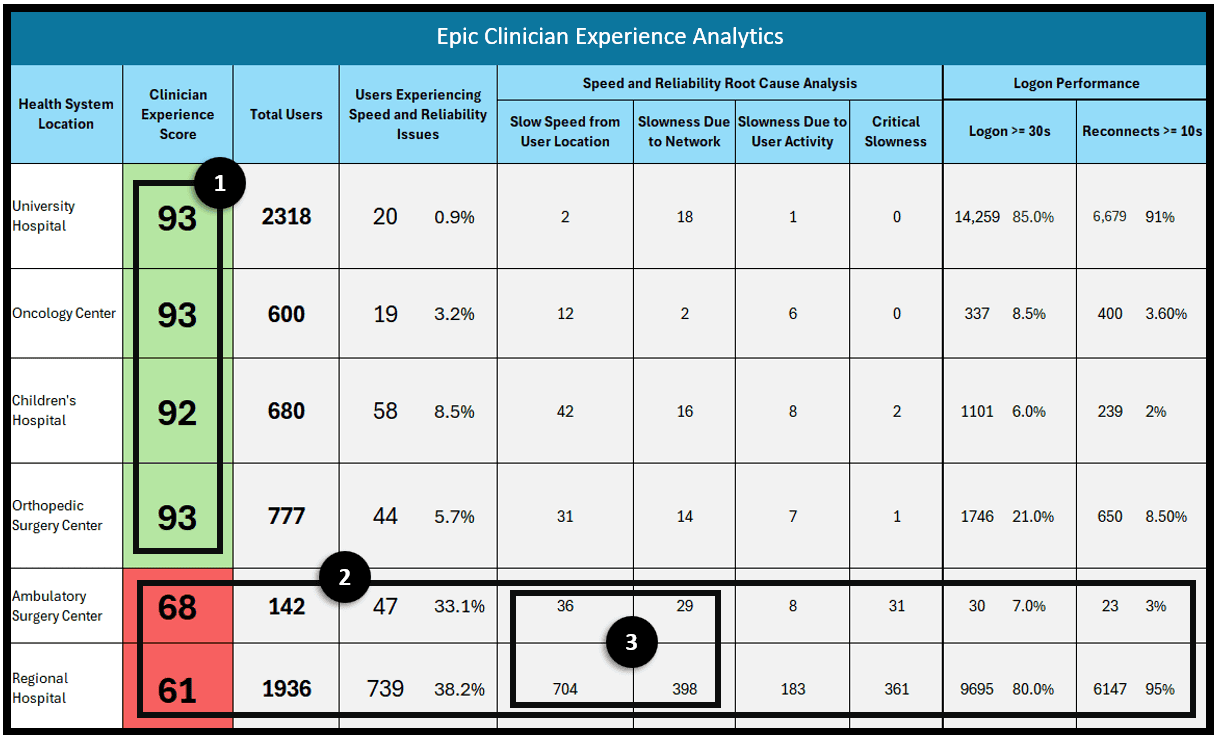
Within the first 48 hours we had our first reports across various locations that we could use for analysis. From the report in the previous post, we focused on the ambulatory surgery center and the regional hospital. We could isolate a few things very quickly:

  1. In most locations the clinician experience was acceptable. The issues were isolated to an ambulatory surgery center and regional hospital. Though this was a small number of clinicians, on a percentage basis the impact was amplified.
  2. At the two locations they were experiencing a number of issues including slow logon times and latency when using the application.
  3. The issues appeared to be either at the location or the connection path to the Epic Hyperdrive application. We did not think it was Epic or the immediate supporting infrastructure.
Epic Hyperdrive & Citrix Overall End User Experience Scores
Image A: Epic Hyperdrive & Citrix Overall End User Experience Scores

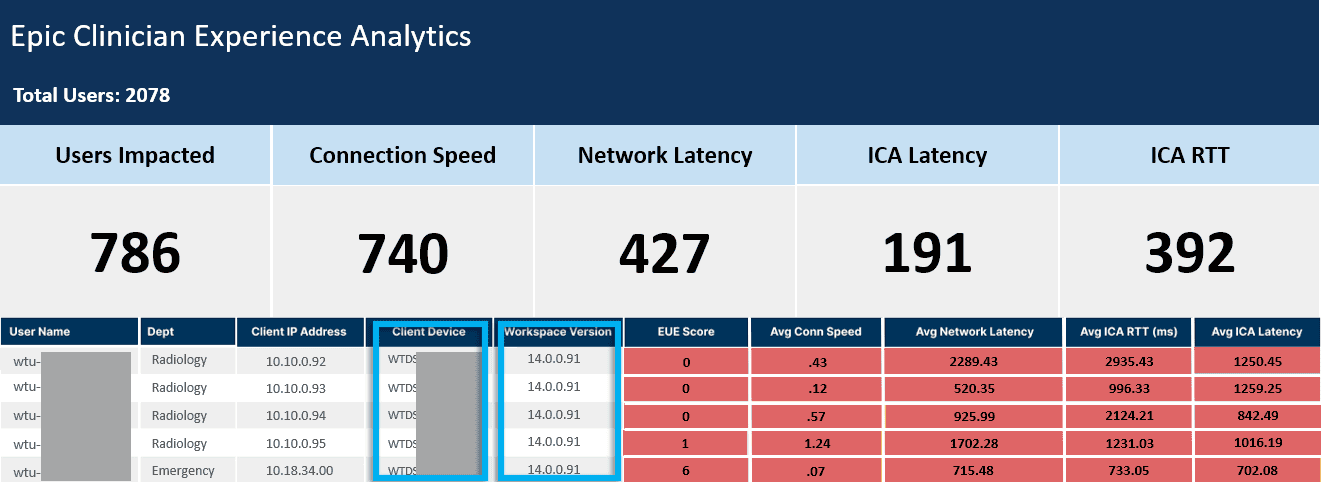
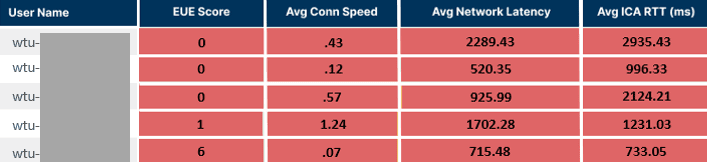
Still within the first 48 hours we consulted another, more detailed report on the users’ experience from that location. When we analyzed the data, we noticed a high correlation of user accounts that started with “wtu” which had some of the worst EUE scores (Image B below). Those accounts are auto logon accounts from Wyse Thin Clients.

Lowest End User Experience Scores for Wyse Thin Client Users
Image B: Lowest End User Experience Scores for Wyse Thin Client UsersThis is a sample of the 40k+ users included in the report. This report image shows that almost all the users experiencing slow logons and session latency were Wyse Thin Client users.

Next, we searched for some of those user accounts that had the worst scores over an extended period to put together trends and we noticed that they were running a Citrix Receiver version that was 10 versions behind and that the Wyse thin clients themselves were also old. (Image C)

Poor Performance Correlated Out of Date Client Versions
Image C: Poor Performance Correlated Out of Date Client Versions

When analyzing user sessions, we confirmed consistently high latency, which was a downstream effect of having outdated versioning on Citrix and the thin client technology. These older versions cannot take advantage of the optimization technology enhancements that Citrix has delivered over the last 10 updates.

Remediation Actions

The IT department submitted change requests to update both Citrix and the old Wyse Thin Clients. There was a concerted outreach effort to upgrade the sites and users so within 60 days after the updates were made the issues were resolved. It was significant that test upgrades were made by IT to validate versioning as the root cause and the performance improvement was significant.

There are a few takeaways from this engagement that are significant to note:

  1. Overall, this Epic speed & reliability improvement engagement was initiated because of what were thought to be widespread issues. In fact, the complaints were amplified and only came from two facilities.
  2. Tremendous cost was saved as they were initially suggesting network upgrades to all sites as a potential solution. Once the size of the problems was understood, there was no need for a widespread upgrade.
  3. Within 48 hours suggested remediation actions were proposed and in 60 days chronic performance issues that had been challenging for IT and problematic for clinicians were solved at low cost.
  4. Ongoing, the IT and Clinical teams have access to data weekly that they can use to understand, isolate, and resolve clinician issues.

The Health IT Team and Goliath Performance Consultants did a great job working together to positively impact clinician experience with Epic and corresponding patient care.

If you would like to discuss further, reach out directly at techinfo@goliathtechnologies.com or request to speak with a healthcare IT consultant.

Dieter Sumerauer – Rady Childrens – How They Did IT – March 2026

Epic Hyperdrive Responsiveness Through the Clinician’s Eyes

Epic Hyperdrive Responsiveness Through the Clinician’s Eyes


One of the largest Nonprofit Health Systems in the US was experiencing clinician and nursing complaints from users of Epic Hyperdrive. They engaged Goliath to help them frame up the size of the problems, isolate root cause, and determine a remediation plan based on the findings.

This post will be in two parts due to the nature of the engagement. Each will represent how we worked with our client to deliver an improved clinician experience. First, we needed to separate the “perception” of clinician experience based on subjective feedback and reality based on empirical data to determine the “true” experience through the eyes of the clinician.

Want to learn more? Request to speak with a healthcare IT consultant.

Challenge

“We had spotty complaints from very vocal and prominent surgeons in one of our geographic regions which amplified the feedback. Both Clinical and IT Executives wanted to understand the extent of the issues and if possible, the contributing factors so they could be remediated. I exhausted all tools at my disposal as well as our primary Citrix consulting vendor. Nothing provided insight into the issues. Then, we reached out to another region that was using Goliath Technologies and asked for assistance.”

– Health System Project Leader

The frustration was acute, like a 911 call without an address. The executives wanted to respond to and resolve the reported issues but there was no actionable data, so our first challenge was to understand the true extent of the issues our client was facing.

As a general statement, IT and Clinical executives have difficulty knowing at a meaningful level whether clinicians are having issues with speed and reliability when it comes to Epic Hyperdrive or any other EHR, business, or clinical application. This is not from a lack of interest or investment. Health systems in the US are estimated to spend between $250,000 and $2 million per year on clinician and staff surveying, depending on the size and number of physicians.

The problem is traditional methods rely on clinician feedback or self-reporting. Surveys or feedback sessions, regardless of the methodology used to conduct them, receive between >10%-25% participation. Add to that, according to the AMIA less than 10%-15% of clinicians even report EHR slowness or logon problems to help desk.

Finally, when it comes to understanding EHR speed and reliability issues specifically, it is impossible to arrive at actionable data through human interaction. In direct interaction, a clinician or user can describe their experience using the application at a nuanced level. Conversely, even the best description of speed and reliably issues are usually conflated and ambiguous, “Epic is slow”, or “My logon is slow”.

To quantify or frame the extent of the clinician issues, we correlated user experience data into our Epic Hyperdrive and Citrix Clinician Experience Reports. Though this is complimentary to other feedback mechanisms, it is vastly different in two ways:

  • We use digital data to provide the nuanced details that are missing from most descriptions of speed and reliability issues. Technology is needed to translate technical challenges impacting a clinician’s experience.
  • Data is correlated from 100% of clinicians without the need for their participation. This is not a sample, it is the entire user base.

We began to gather and correlate the data represented below (Image A).

Note: We were able to correlate and present this data within five business days to provide a full view of clinician experience from every user, location, application, and specialty.

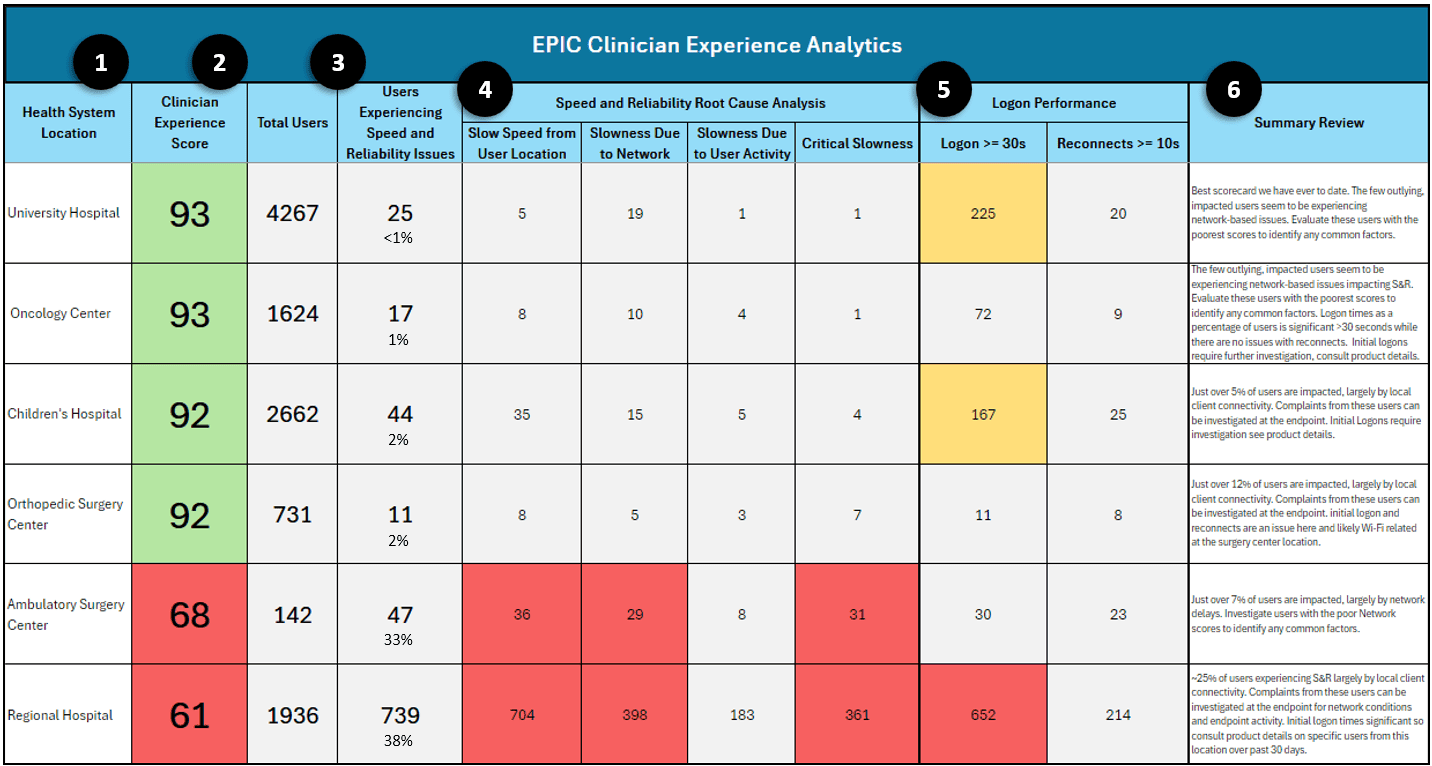
This uppermost presentation layer allows us to see the numbered data quickly:

  1. Data by health system or clinic location.
  2. Clinician experience score based on the user experience metrics that are automatically compared to industry best practices.
  3. Total number of users correlated with those that are experiencing speed and reliability issues.
  4. Speed and reliability root cause analysis to see quickly why issues are occurring so we can focus on those areas for remediation.
  5. Logon times for those locations and users.
  6. High level summary data to convey initial impressions and areas for remediation focus.


Epic Hyperdrive & Citrix Clinician Experience Data
Image A: Epic Hyperdrive & Citrix Clinician Experience Data


These data-driven insights unite clinical and IT teams around facts, not opinions. Shared, unbiased data enables productive collaboration between Clinical and IT leadership, so permanent remediation actions can be approved and implemented. Now, from an IT perspective, many hours are saved attempting to quantify and identify the clinicians who are experiencing issues and the corresponding root cause, often multiplied over the course of months.

We met with both Clinical and IT executives so we could review the data and immediately draw a few conclusions:

  • In aggregate, overall EHR speed and reliability were within acceptable ranges. So, the initial perception of broad poor experience was exaggerated.
  • There were several locations experiencing clear issues with clinician experience, but they were not caused by Epic Hyperdrive or the datacenter infrastructure.
  • Further investigation was required in areas experiencing poor performance, but the aperture for investigation was significantly narrowed by the data, allowing for much more productive and efficient investigation.

In a follow-on post, we will discuss the findings in more depth and how we worked with health IT and clinicians to fully understand, quantify, and resolve chronic speed and reliability issues.

If you would like to discuss further, reach out directly at techinfo@goliathtechnologies.com or request to speak with a healthcare IT consultant.

Lowest End User Experience Scores for Wyse Thin Client Users
Image B: Lowest End User Experience Scores for Wyse Thin Client UsersThis is a sample of the 40k+ users included in the report. This report image shows that almost all the users experiencing slow logons and session latency were Wyse Thin Client users.

Next, we searched for some of those user accounts that had the worst scores over an extended period to put together trends and we noticed that they were running a Citrix Receiver version that was 10 versions behind and that the Wyse thin clients themselves were also old. (Image C)

Poor Performance Correlated Out of Date Client Versions
Image C: Poor Performance Correlated Out of Date Client Versions

When analyzing user sessions, we confirmed consistently high latency, which was a downstream effect of having outdated versioning on Citrix and the thin client technology. These older versions cannot take advantage of the optimization technology enhancements that Citrix has delivered over the last 10 updates.

Remediation Actions

The IT department submitted change requests to update both Citrix and the old Wyse Thin Clients. There was a concerted outreach effort to upgrade the sites and users so within 60 days after the updates were made the issues were resolved. It was significant that test upgrades were made by IT to validate versioning as the root cause and the performance improvement was significant.

There are a few takeaways from this engagement that are significant to note:

  1. Overall, this Epic speed & reliability improvement engagement was initiated because of what were thought to be widespread issues. In fact, the complaints were amplified and only came from two facilities.
  2. Tremendous cost was saved as they were initially suggesting network upgrades to all sites as a potential solution. Once the size of the problems was understood, there was no need for a widespread upgrade.
  3. Within 48 hours suggested remediation actions were proposed and in 60 days chronic performance issues that had been challenging for IT and problematic for clinicians were solved at low cost.
  4. Ongoing, the IT and Clinical teams have access to data weekly that they can use to understand, isolate, and resolve clinician issues.

The Health IT Team and Goliath Performance Consultants did a great job working together to positively impact clinician experience with Epic and corresponding patient care.

If you would like to discuss further, reach out directly at techinfo@goliathtechnologies.com or request to speak with a healthcare IT consultant.

Dieter Sumerauer – Rady Childrens – How They Did IT – March 2026

How They Did IT: Epic Hyperdrive Logon Times for Clinicians Reduced by 50%

How They Did IT: Epic Hyperdrive Logon
Times for Clinicians Reduced by 50%

By Thomas Charlton, CEO Goliath Technologies

“Within the first two weeks we were able to take corrective action to dramatically improve our clinician’s logon experience. I don’t want to say actual numbers because it was so bad, but we reduced the logon times by 50% quickly, and in the next 45 days we dropped to just under 30-second initial logon times and sub-10-second reconnects.”

– Director, System Engineering Team & Clinician Experience Lead

Want to learn more? Request to speak with a healthcare IT consultant.

The Backdrop

An acute care health system with more than 9,500 employees recently engaged in Goliath’s EHR Speed & Reliability Improvement Program to address a growing clinician frustration problem. Physicians and nurses were experiencing consistently slow logon times when accessing Epic and other critical clinical applications. The delay in launching Epic Hyperdrive was especially disruptive because it frequently occurred at the point of care, forcing clinicians to wait while patients sat in front of them.

What initially appeared to be “another Epic performance issue” quickly became a broader operational concern impacting workflow efficiency, clinician satisfaction, and patient experience. Our objective was clear: isolate the true root cause as quickly as possible so remediation efforts could be targeted, measurable, and effective, allowing clinicians to stay focused on delivering care instead of fighting technology.

Challenge

The IT Incident Response Team was actively investigating multiple reports of slow logon performance when clinicians attempted to access Epic Hyperdrive. The first challenge, however, wasn’t fixing the problem, it was understanding the true scope of the issue. As anyone who has worked in healthcare IT knows, relying on self-reported feedback through support tickets or surveys only tells part of the story. Most clinicians simply work around performance issues rather than reporting them, and even when response volume is high, the data often lacks the precision needed to drive targeted remediation.

This is where quantifying digital experience fundamentally changes the troubleshooting process. Because clinician experience is digital, it can be measured objectively and continuously. By leveraging technology-enabled, empirical experience data, the team was able to move beyond anecdotal complaints and gain granular visibility within hours, not weeks. Specifically, they could immediately identify:

  • Which clinicians were experiencing speed and reliability issues
  • How often those issues occurred and how long they lasted
  • Where the most probable root cause was occurring within the delivery stack.

With this level of clarity, the investigation shifted from reactive troubleshooting to proactive diagnosis. Instead of guessing whether the problem originated in the EHR, virtualization layer, network, or endpoint environment, the team now had objective evidence to guide next steps. This allowed remediation efforts to be prioritized based on impact to patient-facing workflows, ensuring that technical resources were focused where they would deliver the greatest clinical and operational return.

Epic Hyperdrive Example Readout

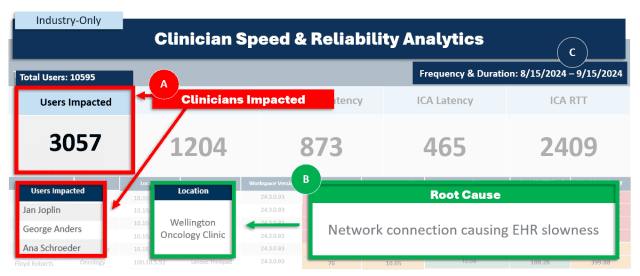
A. Which clinicians are impacted / B. When and for how long / C. Likely root cause]

Clinician Experience Analytics

The results of the initial performance baseline immediately reframed the problem and sharpened the troubleshooting focus. Contrary to initial assumptions, the data made it clear that the bottleneck was not occurring inside the Epic Hyperdrive application itself. Instead, latency was introduced before clinicians ever reached their active Epic session, specifically during the connection path from the endpoint to the application delivery layer.

What made this especially challenging to detect through traditional methods was the nature of the issue. While support tickets and clinician feedback suggested isolated incidents, the empirical data revealed a much broader and more persistent pattern. The performance degradation was both intermittent and chronic, spanning two major health systems, 24 clinical locations, and impacting more than 3,000 Epic Hyperdrive users. Without objective experience analytics, this systemic issue would have continued to appear as disconnected, one-off complaints rather than a widespread operational problem.

Solution

With clear visibility into where performance degradation was occurring, the IT team leveraged Goliath’s AI-enhanced contextual analytics to isolate the true root cause of the slow logon experience. This capability correlated session behavior, infrastructure events, and user experience metrics in real time, allowing the team to move beyond symptom-level troubleshooting and focus on permanent remediation.

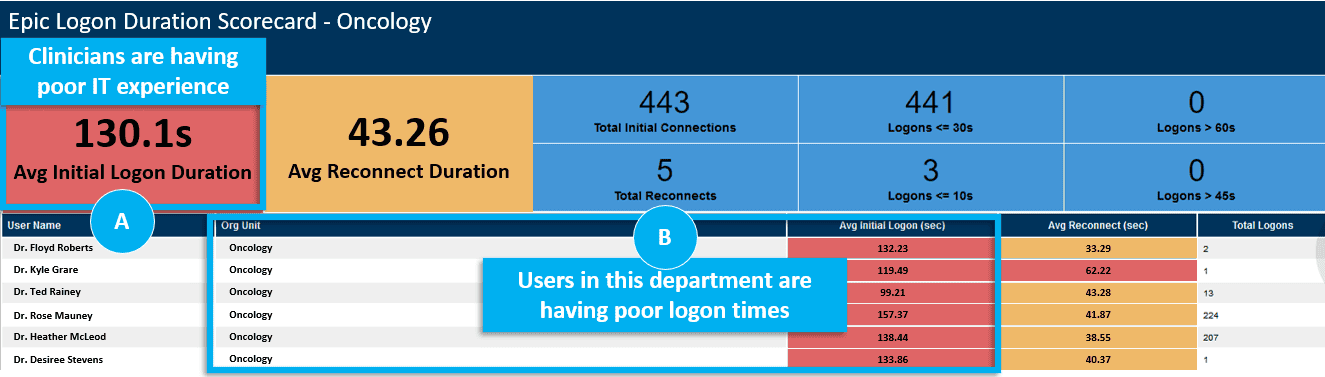
[Example readout: A. Clinicians impacted by excessive logon times / B. Location of impacted clinicians]

Goliath identified a recurring pattern of failed Citrix and Epic Hyperdrive login attempts followed by successful, but consistently slow, authentication. Importantly, this behavior was not isolated to a single workstation or user group. The pattern was observed across multiple devices and locations, indicating a systemic issue rather than an endpoint-specific configuration problem.

By drilling into the failed and degraded sessions, the underlying bottleneck became immediately apparent: the Citrix profile load stage was introducing excessive delay during the authentication process. This insight provided the breakthrough moment for the IT team, allowing them to pivot remediation efforts toward the true source of clinician frustration instead of continuing to troubleshoot the EHR application itself.

Even with successful Citrix logons, the profile load time was extremely high. This health system uses local profiles on Epic Citrix servers, and this step in the logon process should be completed within 1–2 seconds. Looking at the Active Directory object for that account, they found a defined home folder path that should not be there. The identified path does not exist on the network, and as a result, users were forced to wait for Windows to time out the home drive connect action before eventually being logged into their workstation or having their Citrix-delivered applications connect.

As this path was a legacy carryover from a Google Drive migration, they opened a Priority 2 ticket and then implemented an emergency change to remove the path from the Active Directory object, resolving the forced timeouts and long logon times. Additionally, this problem had been previously reported by users; however, lacking the necessary data, the team was unable to identify the root cause and put permanent fixes in place.

Resolution and Ongoing Proactive Management

As the project manager mentioned in the quote at the beginning of the post, the client was able to get their logon times down to industry best-practice standards. Now with the reported issues permanently resolved, the IT team wanted to ensure that they would not have these issues again, and if they did occur, they wanted to be alerted by technology and not end users.

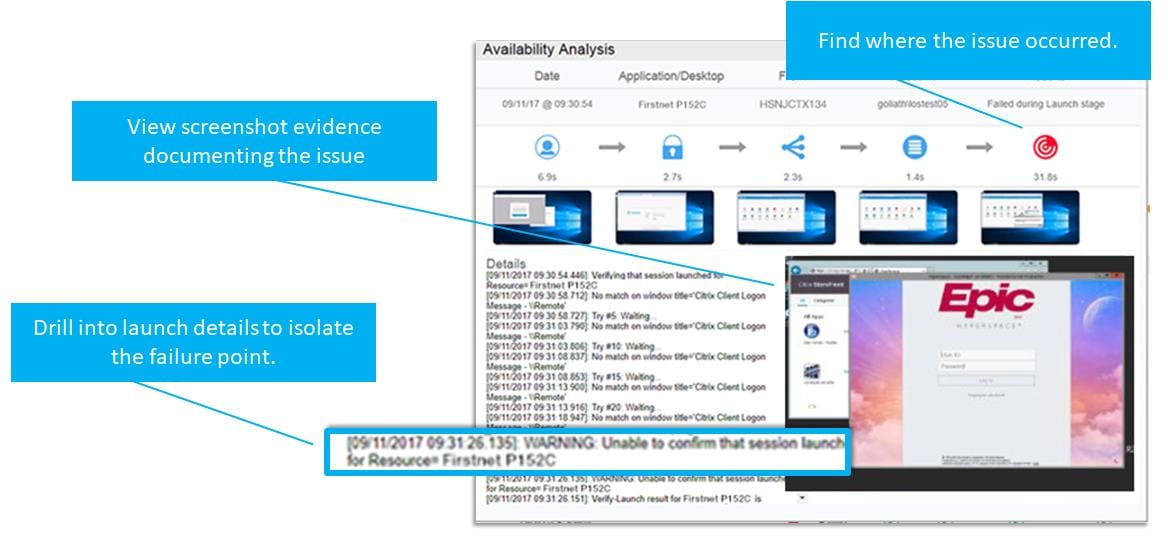
They rely on several features for proactive alerting, but one such feature is the application availability feature, which will proactively log on to Epic 24/7/365 automatically and alert to any logon difficulty with the corresponding data necessary to troubleshoot, as seen in the image below. Here a logon failure occurred, and the alert contained an image sent to the IT administrator with key data to enable remediation actions.

Automated Troubleshooting Without Engaging the Users

If you are having end user experience issues with your clinical or business applications, reach out and let’s discuss. We find and fix very specific issues, and in a discovery conversation we will let you know if we can assist. If the issues you are experiencing are outside our purview, we will share that as well. If you would like to discuss, reach out to techinfo@goliathtechnologies.com or request to speak with a healthcare IT consultant.

Dieter Sumerauer – Rady Childrens – How They Did IT – March 2026

Our ControlUp Alternative Was the Goliath Enterprise Solution

Our ControlUp Alternative Was the Goliath Enterprise Solution

Our ControlUp Alternative Was the Goliath Enterprise Solution

How a large enterprise traded out ControlUp for Goliath to get the metric detail and reporting it needed to fix end-user experience issues, at a lower cost.

This is how their EUC team found a ControlUp alternative that went deeper into end-user experience, reported on it properly, and cost less.

The Challenge: A Big Bill for Answers That Stopped Short

The company supports 5,000 users across 10 locations on Citrix. Session slowness was chronic. Published apps hung, and users called the help desk to say “Citrix is down” when it wasn’t.

The EUC team could see that something was wrong. What they couldn’t see was why. Their metrics stopped at the summary level. Session latency showed up without the protocol-level detail needed to separate a network problem from a host problem from an endpoint problem, and there was little correlation to the end user.

Without that detail, every escalation was a guess. Tickets bounced between the network, server, desktop, and application teams. Each team checked its own tools and passed the ticket on. Mean time to resolution was measured in days, not hours.

Reporting made it worse. Leadership asked fair questions. How many users were affected last quarter? Which sites are worst? Did the fix we paid for actually work? Answering them meant exporting data and building spreadsheets by hand.

What They Tried: Citrix Tools and ControlUp

The team ran their Citrix tools side by side with ControlUp. The Citrix tools showed the health of the Citrix layer, as designed. ControlUp added a real-time view of the virtual desktops and flexibility for engineers willing to script. But for solving end-user experience issues, the gaps added up.

  • Not enough granular detail. Some of the detailed values needed to isolate end-user performance issues weren’t tracked. The team could see that a logon or session was slow, but not always which stage or which layer caused it.
  • No detail, no early warning. If a value isn’t tracked, you can’t alert on it. Too many issues surfaced when users called, not before.
  • Limited reporting. Out-of-the-box reporting didn’t answer leadership’s questions about trends, locations, and impact over time. Anything beyond the basics meant exports, scripts, and hours of engineer time.
  • A premium price. ControlUp was one of the largest line items in the EUC budget, and the renewal kept climbing.

They needed a tool that went deeper and cost less. That’s when they started looking for a ControlUp alternative.

The Solution: Goliath, With the Detail to Find Root Cause

The team found Goliath through a Citrix Master Class webinar series where Citrix CTP George Speirs was doing a presentation on detailed troubleshooting. They decided to do a ControlUp alternative proof of concept on one delivery group and run it side by side with ControlUp.

The first difference was depth. Goliath monitors 350+ failure points across infrastructure, hypervisors, servers, operating systems, and applications. It also conducts automatic Citrix optimization health checks. It captures end-user experience metrics for ICA/HDX, so the team can tell whether latency lives in the network, the host, or the endpoint.

Because the values are tracked, they can be alerted on. Goliath flags problems before users are impacted. Self-healing remediation restarts hung apps and servers or runs PowerShell scripts automatically. Screenshot evidence shows exactly what the user saw, so root cause is a fact, not an argument. And it all lives in one console.

The second difference was reporting. Goliath ships with out-of-the-box reports, keeps historical data for trend analysis, and integrates with Power BI and Tableau. The questions that used to take days of spreadsheet work now take a few clicks.

Going Forward

Today the company uses Goliath to proactively manage end-user experience across its Citrix environment and the delivery infrastructure behind it: endpoints, network, hypervisors, and servers. Issues get caught and fixed before users feel them, and leadership gets its reports without waiting on a spreadsheet.

Learn more about Goliath as a ControlUp alternative. Get results like these—start here.

Dieter Sumerauer – Rady Childrens – How They Did IT – March 2026

Our ControlUp Alternative Was the Goliath Epic Healthcare Solution

Our ControlUp Alternative Was the Goliath Epic Healthcare Solution

Our ControlUp Alternative Was the Goliath Epic Healthcare Solution

How one health system traded out ControlUp for Goliath to enable proactive management of clinician experience when accessing and using Epic Hyperdrive.

This is how a large health system using Epic Hyperdrive found a ControlUp alternative built for healthcare, and why the switch cost them less.

The Challenge: Clinicians Were Struggling in Epic, and IT Couldn’t See How Far It Went

The complaints were familiar. Epic was slow to launch. Logons dragged at shift change. Sessions froze mid-charting. Clinicians rarely called the help desk anymore; more often, they just worked
around it.

A recent survey indicated broad displeasure with the speed and reliability when accessing and using Epic. Of course the survey only captured a subset of the users and little actionable data for IT to understand or troubleshoot the issues.

The IT team had ControlUp in place to monitor Citrix, but what they didn’t have was the full picture. They could not correlate IT element performance with Epic System Pulse data to see how many clinicians were affected and root cause. Without integration to Epic System Pulse, user experience data on 100% of clinicians is impossible.

That gap had real costs. Clinicians lost minutes meant for patients. The help desk escalated on a hunch. Network, server, Citrix, and Epic teams each checked their own dashboards, found nothing wrong, and handed the problem off. Clinical and IT leadership heard “Epic is slow” but had no data to act on.

What They Tried: Citrix Tools and ControlUp

The team started where most health systems do, with their Citrix tools. Those tools did what they were designed to do. They showed the health of the Citrix layer. But a clinician’s Epic session crosses the endpoint, the network, the hypervisor, the Citrix or VMware Horizon session, and Epic itself. Seeing one layer clearly doesn’t tell you which layer is failing and without integration to Epic it is difficult to tie the performance of a degraded IT element to specific clinicians using Epic Hyperdrive.

So, they added ControlUp, running it side by side with their Citrix tools. It gave the team more
visibility into their virtual desktops, and for general VDI monitoring it had a lot to offer. For Epic,
the blind spots remained.

The team wasn’t short on tools. They were short on answers. That’s when they started looking for a
ControlUp alternative.

The Solution: Goliath, Purpose-Built for Epic

The team found Goliath through KLAS Research, where Goliath is “A” rated and is the only KLAS-measured third-party solution validated for improving EHR reliability and response time. They reached out, and began a full proof of concept to find an alternative to ControlUp.

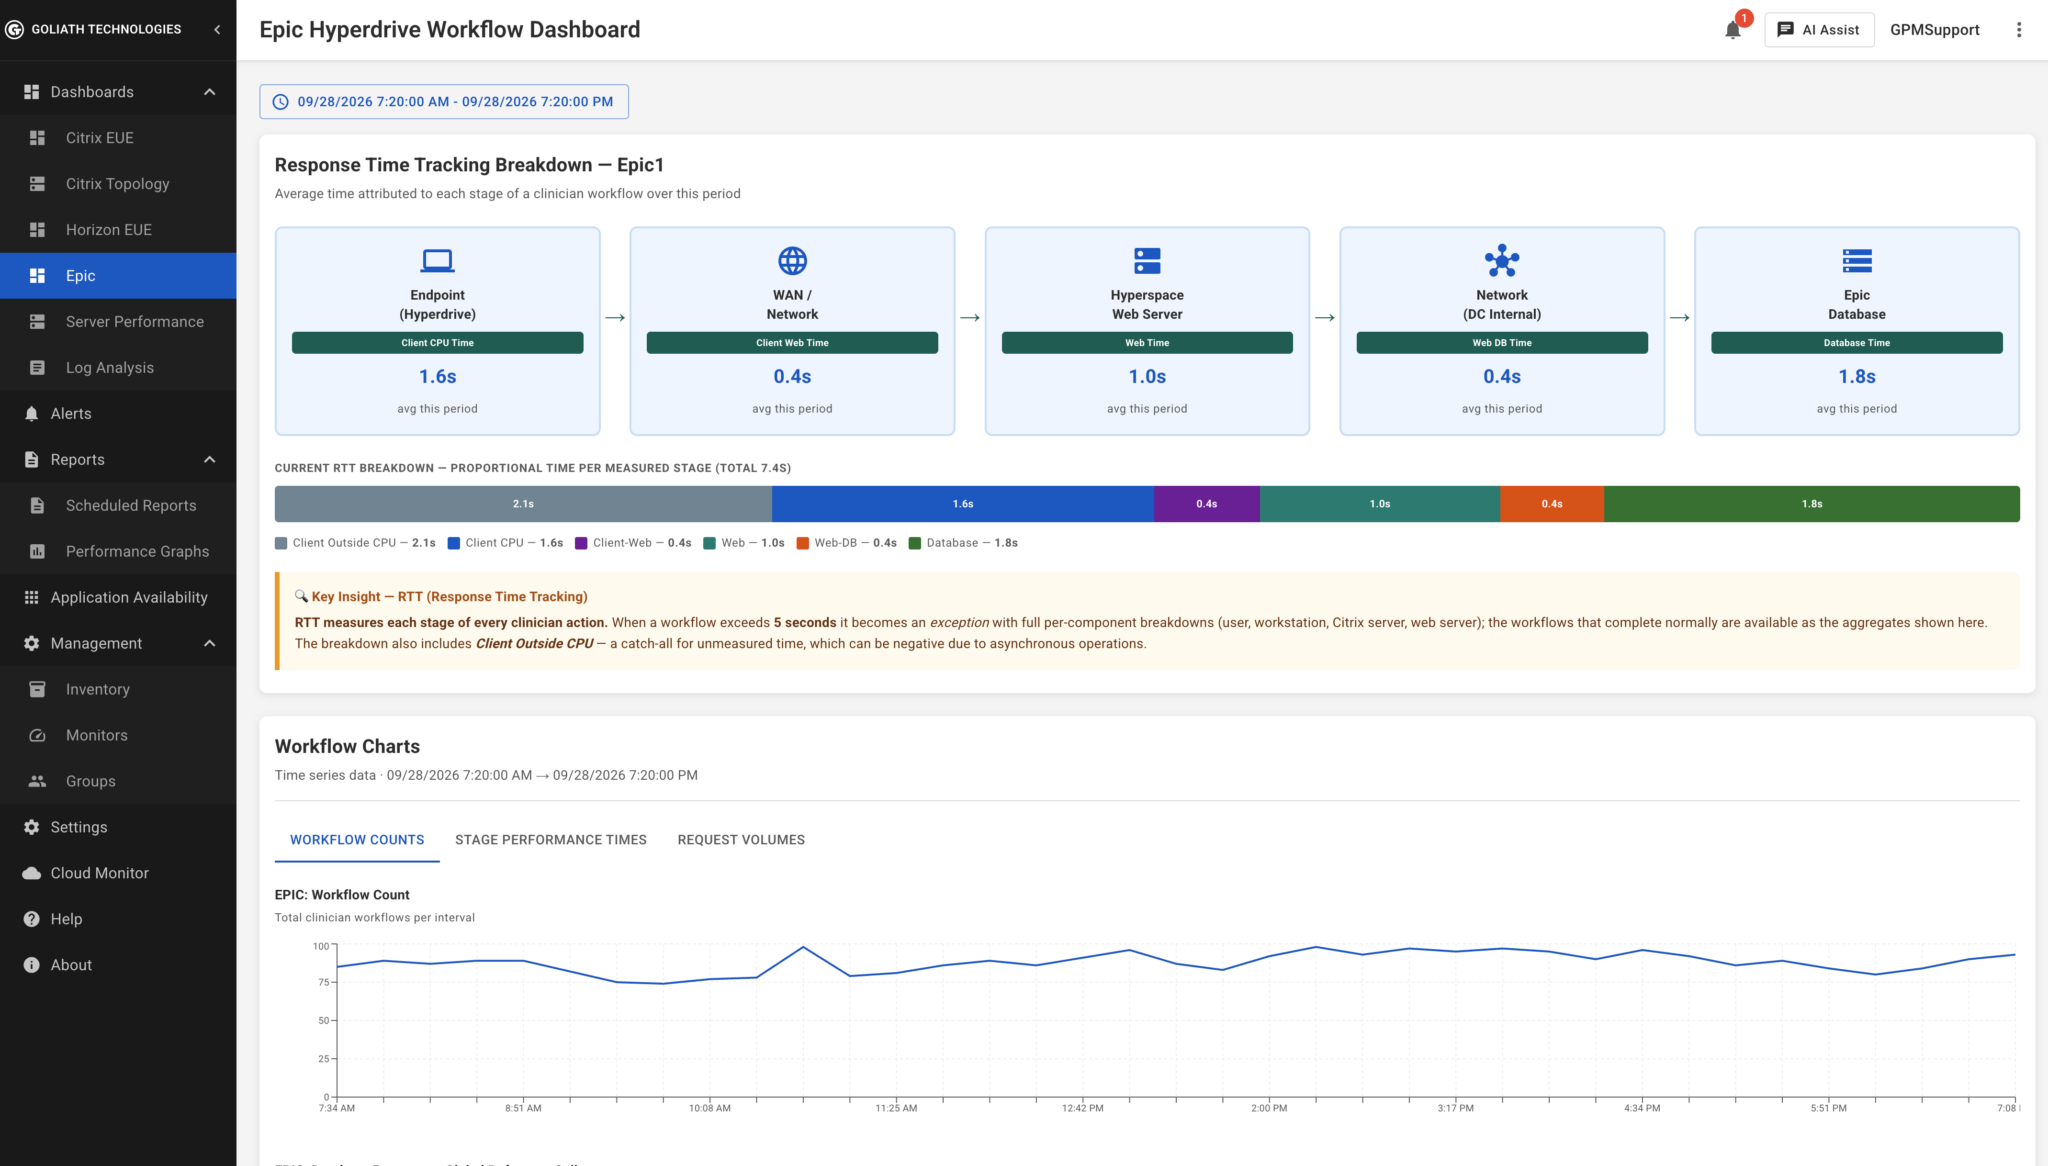
It started with Epic. Goliath’s module for Epic Hyperdrive integrates with Epic System Pulse and combines three data sources in one console: Epic System Pulse, the clinician’s end-user experience, and the underlying Citrix or VMware Horizon infrastructure. In addition, the Goliath Epic Module provides automated optimization checks to make sure that the Epic environment is fully configured to Epic best practices guidance or on target. For the first time, the team could see an Epic slowdown and trace its root cause in one place.


Goliath Epic System Pulse Integration View


Goliath Epic System Pulse Integration View

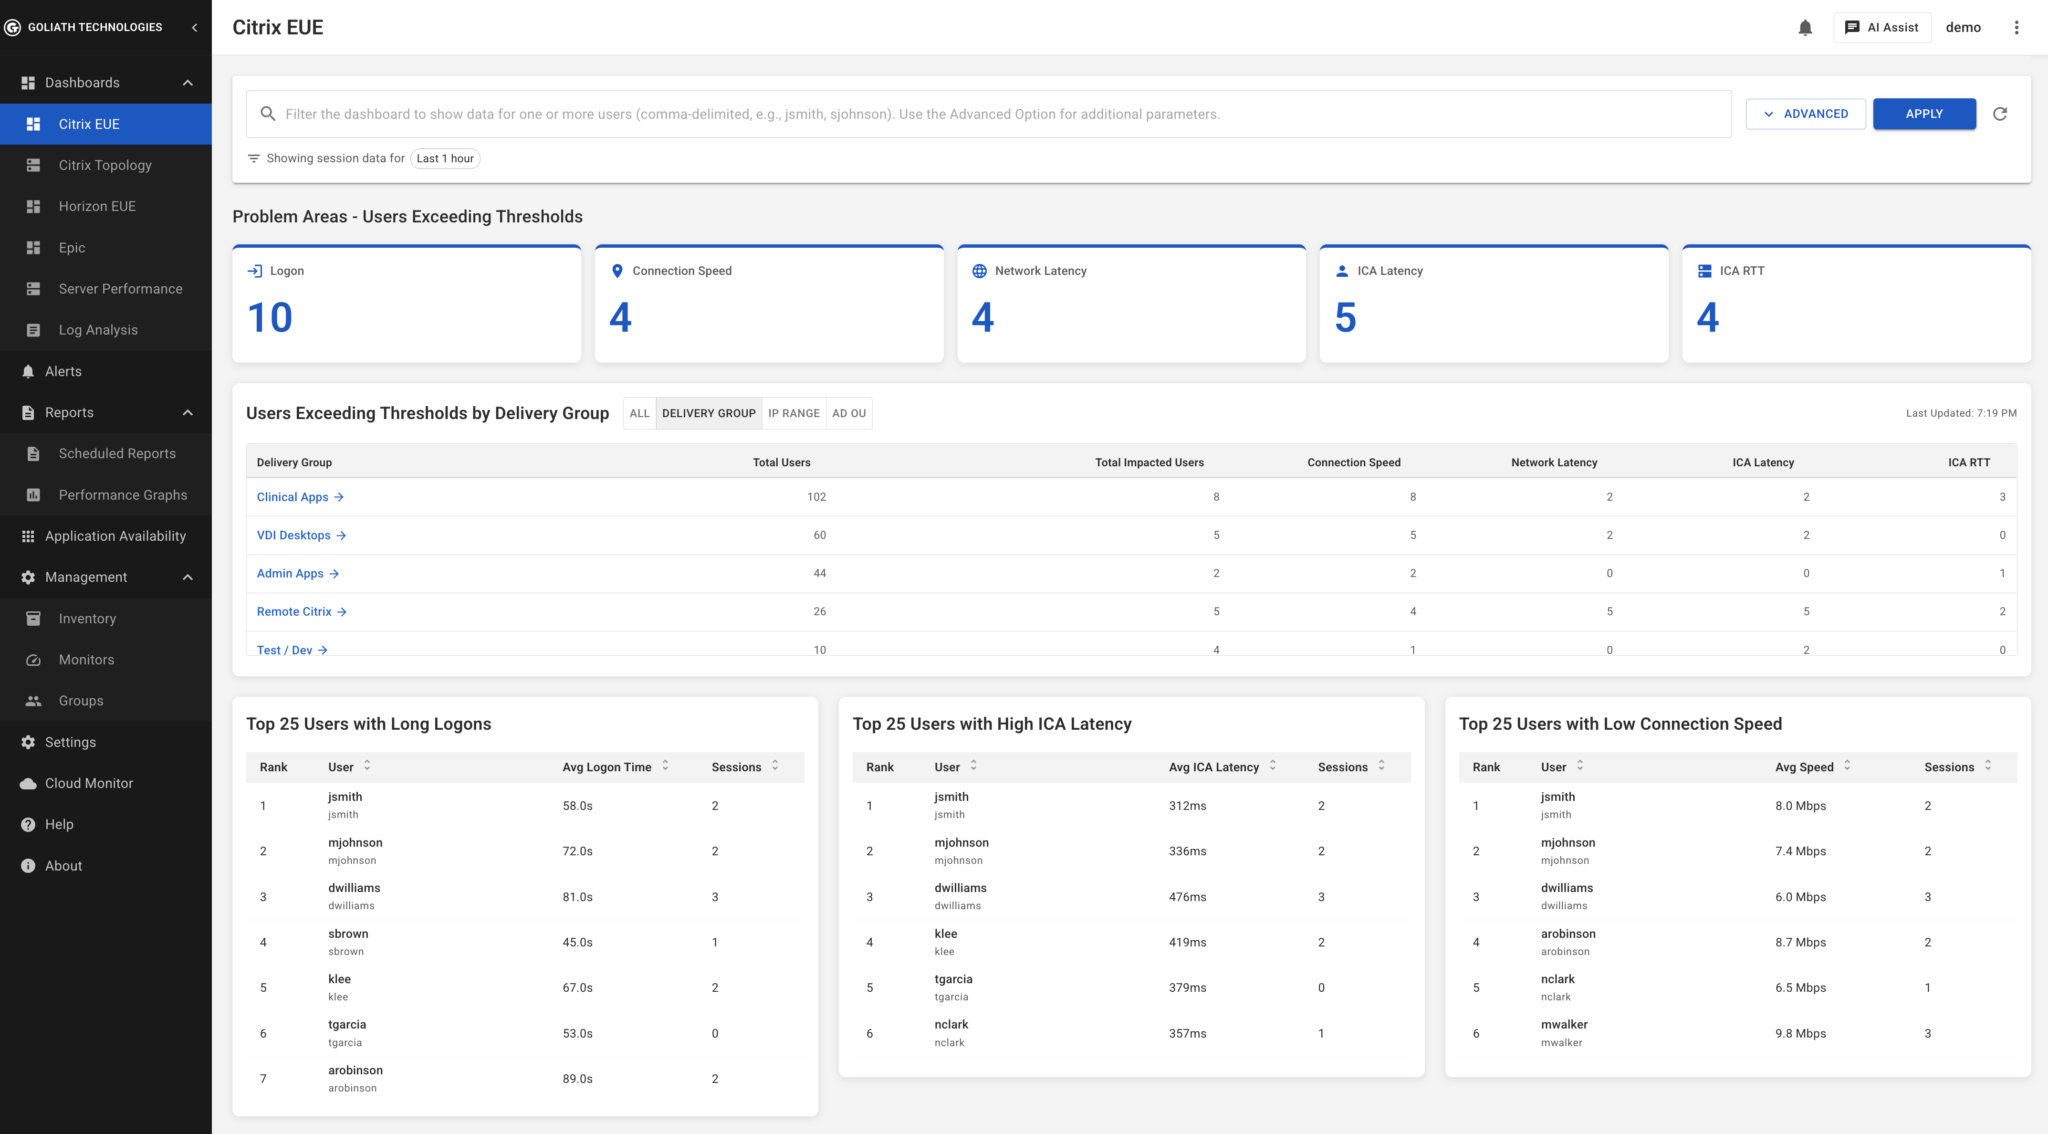
The second difference was how little work it took. Goliath auto-discovers the environment, monitors 250+ failure points out of the box, and tracks all 33+ stages of the logon process. No scripting projects. No custom dashboards to maintain. The team could open Goliath and immediately see the top 25 users having issues, how long each issue lasted, and why.


Top 25 Users with Issues Dashboard


Top 25 Users with Issues Dashboard

Most important, Goliath tracks the experience of every clinician, not a sample and not only the ones who call the help desk. The End User Experience and Logon Duration Scorecards grade that experience against industry standards, so “Epic is slow” becomes a measurable number that leaders can track over time.

One Set of Facts, Used Across the Organization

After the ControlUp alternative was implemented, Goliath became the shared source of truth for four groups:

  • Clinical executives use it when they meet with clinicians. They know who is having issues, how long the issues lasted, and what caused them before the conversation starts.
  • IT executives see the same data. Clinical and IT leadership now work from one set of facts to fund initiatives that improve clinician experience.
  • The help desk resolves many issues on the first call. When a ticket does need escalation, it goes to the right team, whether that’s network, server, Epic, or Citrix, with root-cause data and screenshot evidence attached.
  • Architects use Goliath’s analytics to spot global patterns by location, department, device, and time of day, and to plan capacity and upgrades based on evidence.

A ControlUp Alternative That Cost Less

The health system expected better Epic visibility to cost more. It didn’t. Goliath came in below their
ControlUp renewal. The pricing was simple to understand, and the full platform, including unlimited
reporting, retention, and synthetic monitoring, was included.

In addition to the product the health system executives opted for the Goliath Clinician Experience
Measurement and Benchmarking support package which provides continuous measurement of clinician experience with Epic and compares that to benchmarks from similar health systems.

Going Forward

Today the health system uses Goliath to proactively manage clinician experience in Epic, along with the delivery infrastructure behind it: endpoints, network, Citrix, and the servers underneath. Issues get caught and fixed before clinicians feel them, not after they call the help desk.


Learn more about Goliath as a ControlUp alternative. Get results like these—start here.

See more about our Epic Speed & Reliability Improvement programs here.