How to Troubleshoot the 33+ Stages of the Citrix Logon Process

ATSG (MTM Technologies)

How to Troubleshoot the 33+ Stages of the Citrix Logon Process

“Trying to troubleshoot the Citrix logon process with free tools is like trying to perform brain surgery with a butter knife.”

– Greg Turner, CIO / SVP, Services, MTM Technologies

Infrastructure

Citrix XenApp & XenDesktop


Troubleshooting Citrix XenApp and XenDesktop logon duration is challenging because it’s a complex process, it’s asynchronous, meaning multiple things are happening simultaneously, and it’s also variable. Some logons will have 33 sub-steps in the process, and others will have more than 50. Any technology that doesn’t offer visibility into all the sub stages can only show that there is a general problem and not the true root cause of the issue. You can’t isolate and troubleshoot root cause without this detail.

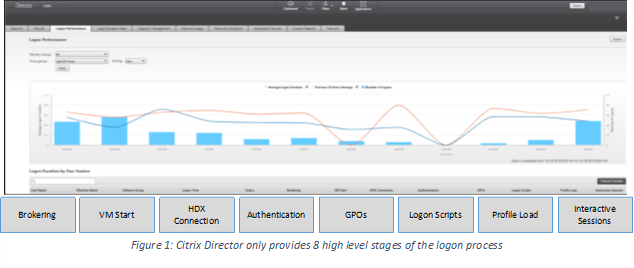
Unfortunately, most people don’t know there are that many steps in the Citrix logon process, because the Citrix Director Utility only provides 8 stages, as shown below.


Citrix Director Utility Screenshot

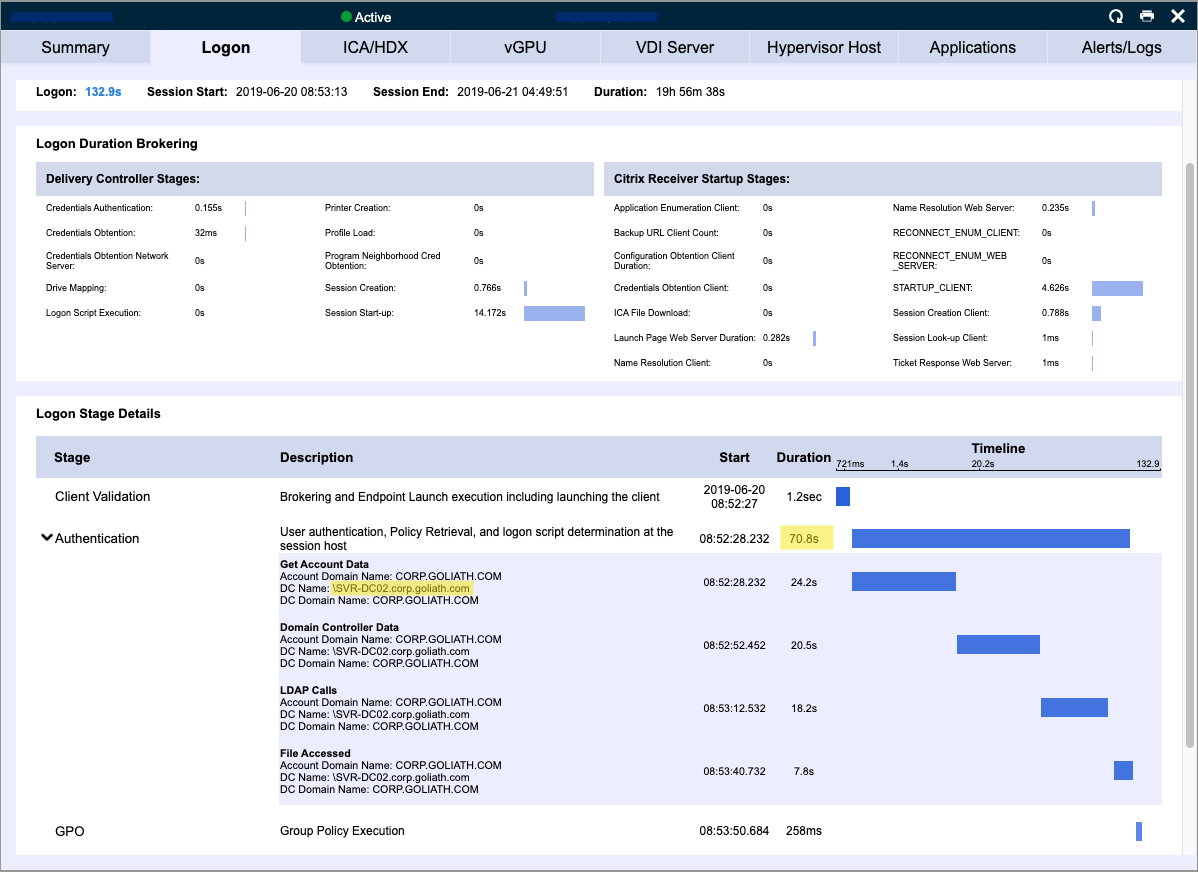
Like most challenging tasks, understanding and troubleshooting the true root cause of Citrix logon issues is not possible with Citrix utilities. An administrator must have the right purpose-built software: Goliath Performance Monitor. Goliath breaks down the Citrix logon process into 33 or more detailed stages to show all the detailed steps possible.

Why are these sub-stages important? By breaking down the major steps into their detailed components, Goliath uncovers and identifies the true root cause of any logon duration issues. For example, Citrix Director can indicate that the GPO phase of the logon process is taking too long – but Goliath can immediately identify the specific GPO or combination of GPOs that are contributing to the problem. This means it’s significantly faster for administrators to identify and troubleshoot the problem.


Goliath Performance Monitor screenshot


Armed with this information, the Citrix Admin identified that the issue was due to using the local domain controller at the office rather than the one in the data center. The key is starting with the root cause of the issue (something Citrix Director cannot provide) and using that information to troubleshoot more quickly and effectively.

These features are supported by other advanced troubleshooting capabilities of the Goliath Performance Monitor including:

  • Embedded Intelligence and Automation: Goliath Performance Monitor guides users on what metrics to monitor and how to monitor them. It’s like getting an end user experience troubleshooting expert in the box.
    • Auto Discover: Goliath automatically discovers and maps your IT components – and deploys to new IT assets as they are added.  As users logon to these components the detailed substages are automatically added and measured.
    • Intelligent Alerts: Goliath provides alerts based on thresholds, conditions and failures for each stage in the logon process.
    • Self-Healing: When servers, applications and processes are failing and impacting users, Goliath can automatically remediate them based on specific conditions. This includes restarting servers, applications, and processes or launching scripts/executable files to resolve issues before they become more serious or impact additional users.
    • Logon Testing: Goliath systematically tests your networks and infrastructure to ensure uses can access critical applications when needed. This goes beyond just application logons – it tests every part of the delivery infrastructure including end point connectivity, infrastructure availability and configuration, licensing issues, or client-side errors.
  • Real Time and Historic Reports: Goliath provides logon duration details for both real time and historic sessions, so you can understand changes over time, or troubleshoot calls about an event last week. Citrix Director and other tools do not provide these detailed metrics from prior sessions.
  • Proactive Proof of Application Availability: Automated end user logons from your key locations confirm all aspects of the delivery infrastructure are working properly and applications are available. This feature also measures, tracks and reports average time of each step in the logon process.

This is one example of how customers use Goliath Technologies to anticipate, troubleshoot, and prevent end user experience issues.

Chris Hughes

ABOUT ATSG (MTM Technologies)

ATSG (Advanced Technology Systems Group, Inc.), formerly know as MTM Technologies, is an IT services and solutions company. They specialize in providing a broad spectrum of technology services, including cloud computing, managed IT services, cybersecurity, and digital transformation solutions to help businesses improve their IT infrastructure and achieve their digital goals. With a history of serving clients in various industries, ATSG focuses on delivering innovative and customized IT solutions to meet the evolving needs of the modern enterprise.

Headquarters location: Purchase, New York
Founded: 1994
Employees: >400
Industry: Information technology & Technology solutions

Guest Post: ICA Latency Isn’t Enough

Guest Post: ICA Latency Isn’t Enough

Guest Post: ICA Latency Isn’t Enough

This post is republished on our blog with permission from Alexander Ervik Johnsen, Blogger, Senior Solution Architect, Technology Evangelist, Author and Speaker, based in Oslo – Norway. The original post appears here on Alexander’s blog. Check out Alexander’s latest blog around the topic of Citrix ICA.

Troubleshooting End User Experience with Advanced Citrix ICA/HDX Metrics and Analysis

By: Alexander Ervik Johnsen

“Citrix is slow” is one of the most common end user complains that frustrates both the end users themselves and the support teams and administrators tasked with resolving the issue.  The challenge is finding the key metrics that identify the true root-cause of the problem so that Citrix XenApp and XenDesktop administrators can proactively monitor, troubleshoot and prevent end user experience issues quickly and confidently.

The ICA/HDX remoting protocol delivers critical applications and resources to users across geographic distances and various connection mediums on different devices.  This means the network layer is enormously responsible for delivering a good end user experience.  For this reason, many people and monitoring solutions use ICA Latency as their end-all measure for understanding end user experience issues over Citrix ICA/HDX.  It’s a convenient and broadly available, but to truly understand what specific factors are contributing to the problem, you need a tool that breaks down ICA Latency into its detailed components. 

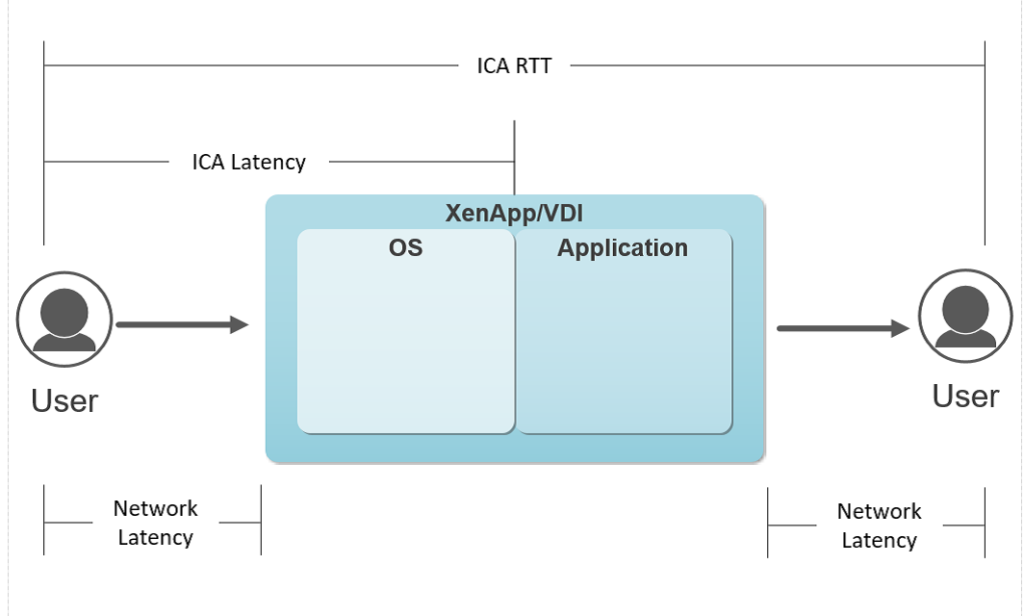
ICA Latency is the time from when a user executes a keystroke or mouse click to when it is processed on the session host.  It includes both network latency and any delay on the session host to process this request.  To best understand the cause of end user issues, administrators require an application that can break out and track these sub-components separately to identify and address the true root-cause.

ICA Round Trip Time (RTT) is the elapsed time from when the user hits a key until the response is displayed back at the end point, as calculated by the session experience monitoring service. The difference between the ICA Latency and RTT is the application processing time on the session host.  

ICA Network Latency is the amount of time it takes data to reach the server.  ICA Network Latency may be higher than ICA Latency, as underlying Citrix protocols are designed to will smooth out ICA Latency spikes to improve experience for the end user.  The delta between ICA Network Latency and ICA Latency can be attributed to server performance.

By breaking ICA Latency into ICA RTT and ICA Network Latency, IT Administrators can take the general complaint ‘Citrix is slow’ and quickly identify specific reasons driving that issue – be that bandwidth, server performance, or application performance issues.  Using this information and more detailed metrics available from Goliath Performance Monitor, administrators can confidently take specific action to remediate problems with the network, or with resource issues at the server.

For more information on how to confidently troubleshoot end user experience issues using Citrix ICA/HDX please download our whitepaper: 


Technical Review: Examining Goliath’s Early Warning System for Citrix, VMware, & RDS

Technical Review: Examining Goliath’s Early Warning System for Citrix, VMware, & RDS

Technical Review: Examining Goliath’s Early Warning System for Citrix, VMware, & RDS

The Goliath Application Availability Monitor is an industry-first software that provides organizations of all sizes with an early warning system, alerting IT administrators of access and performance issues with business-critical applications before their end users ever attempt to logon.

IT professionals everywhere can now receive customizable alert notifications and warnings to exact failure points in the workflow for desktop virtualization platforms like Citrix, VMware or RDS. To proactively monitor the availability of Citrix XenApp & Xen Desktop, VMware Horizon View, and Microsoft RDS effectively, the Application Availability Monitor must confirm that the applications will be available and that the entire delivery infrastructure and workflow are executing properly. This is all made possible by the Goliath Virtual User – a small-footprint technology that automates the process of logging on to Citrix/VMware Horizon/RDS to confirm application availability, and that the workflow is operating properly. The Goliath Virtual User is deployed on-premises or remotely (wherever end users are located), automatically logs on like a real user to confirm applications will launch and is configured exactly like a real user with the same permissions within Active Directory.

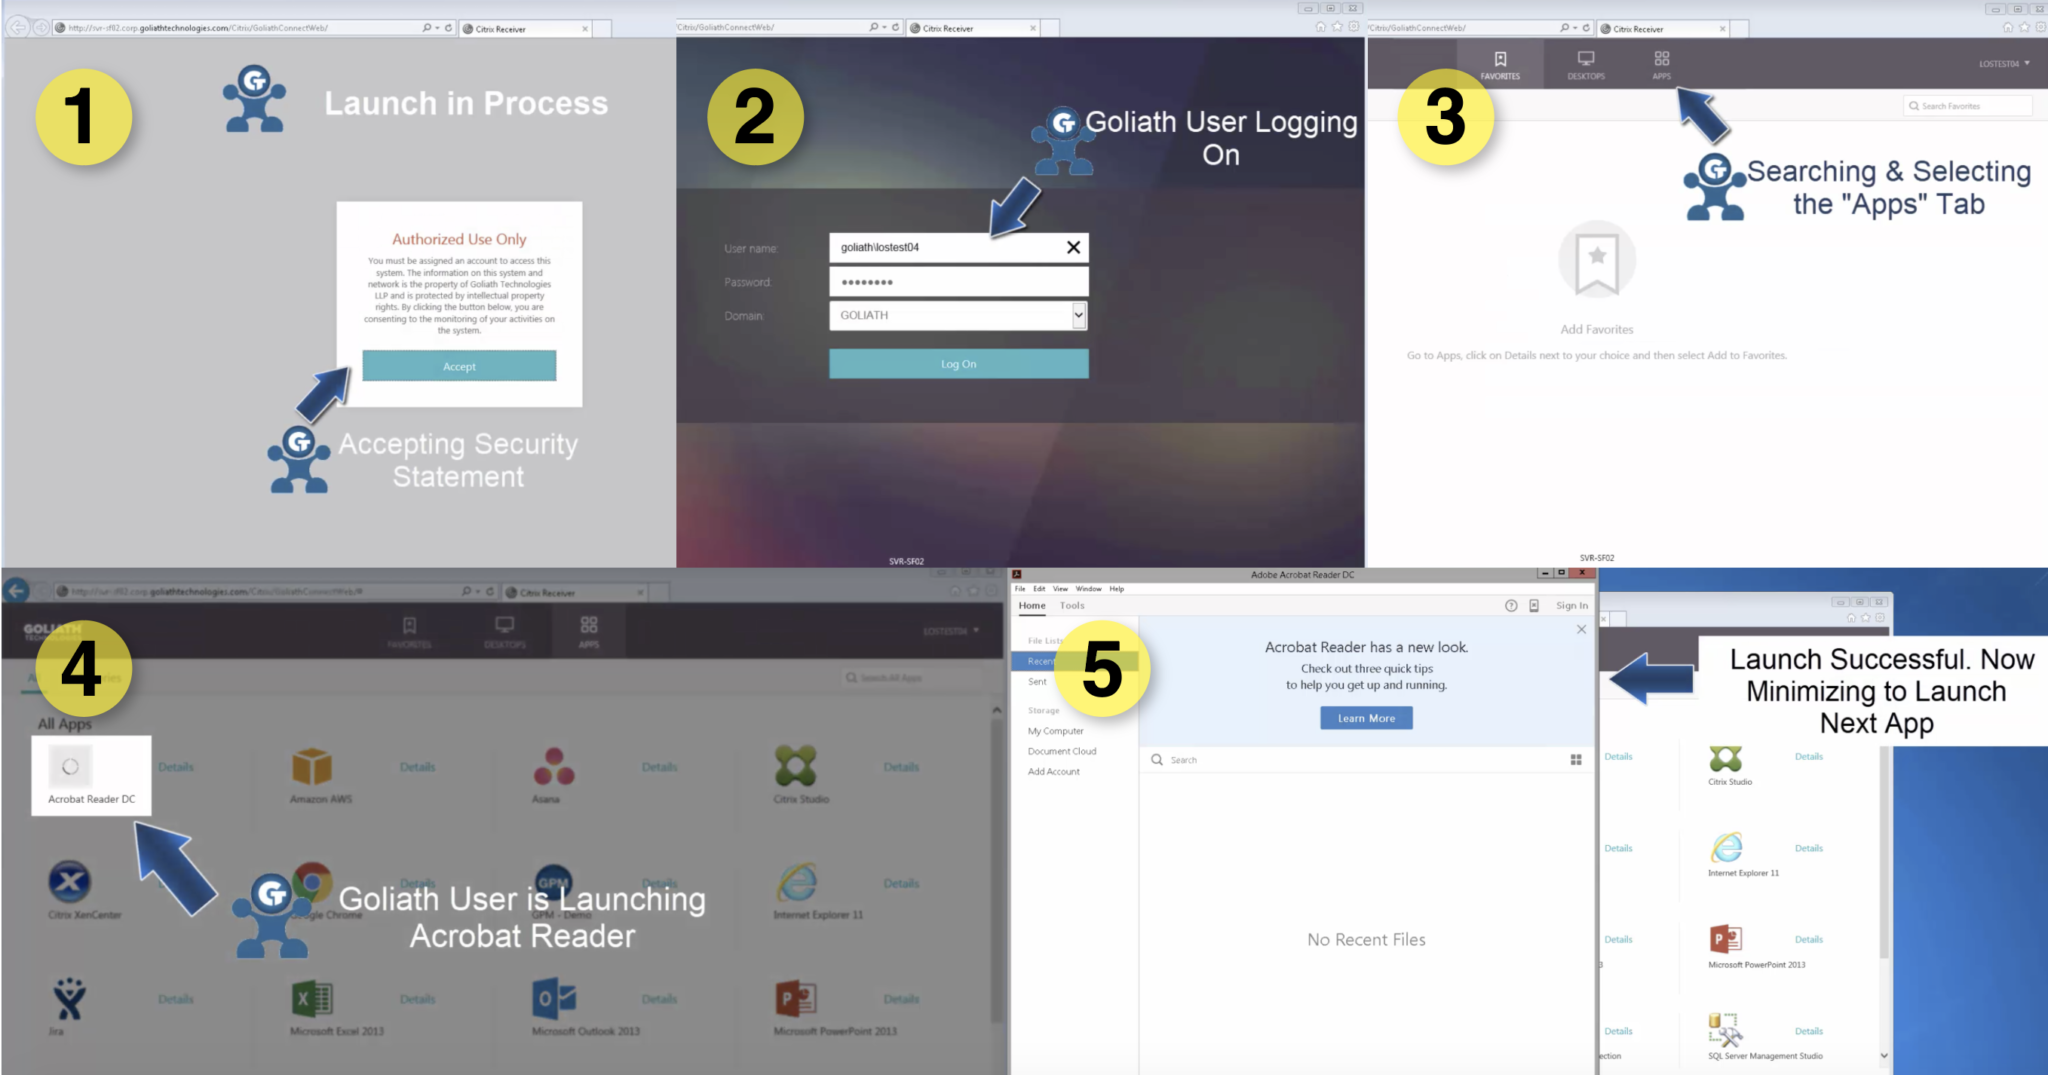
Below is a depiction of the Goliath Virtual User in action – automatically initiating a connection to the application and in doing so confirming that the entire application delivery infrastructure and workflow are working properly to launch applications:

confirm the application delivery infrastructure

Screenshot Analysis

When each phase of the logon process for Citrix XenApp/XenDesktop, VMware Horizon View or Microsoft RDS is executed by the Application Availability Monitor, a screenshot is taken to provide visual evidence and objective proof of logon success or logon failure. This allows IT administrators to see the potential impact that typically elusive items like disclaimers, error messages, secondary authentication, and multiple launch sequences may have on the outcomes of the logon process. This provides objective evidence of the root cause of the logon issue that can be shared with management, vendors, and counterparts to end finger pointing and put permanent fix actions in place.

As illustrated below, you can quickly drill down to investigate failures right from the application availability dashboard by clicking on the magnifying glass. In just three steps, you can then see where the logon issues occurred during the logon process and what the issue was:

screenshot analytics

  1. In this case, failure occurred at the launch stage (marked by the ‘1’)
  2. The screenshot (2) proves that the application failed to launch and shows the root cause of the Citrix workflow and application launch failure as being the result of a licensing problem
  3. By navigating to the “Details” or “Analytics” section (3), we can see that the launch failed at the point of verifying that Internet Explorer launched

Scheduling and Automation

Unlike other technologies, the Goliath Application Availability Monitor has built-in logon scheduling functionality. This provides an easy to use, templated approach to constructing launch sequences. This gets you scheduled in minutes – not hours – without the need for custom scripting or recording sequences. The Application Availability Monitor can be scheduled to run automatically and continuously across multiple applications, determining logon performance across different locations and/or different types of users as needed. For example, it can run throughout the day so your IT staff will know immediately if/where there is a problem and at which stage of the process the problem is occurring. Launches can be scheduled to execute, for example, before Doctors or Nurses start their shift so that healthcare IT can be alerted to issues before these end users feel the impact of an application/desktop performance issue.

Below is an example of the scheduling display showing the ease of setup and the frequency of launches throughout the day:

scheduling

scheduling #2

Alerting

Alert notifications can be sent immediately if a validation of the workflow fails by email, SNMP, SYSLOG, or to the customer’s ticketing or enterprise monitoring solution. This allows critical uptime and availability information to be delivered prior to end users knowing there is a problem.

Below is an example of the alert notification feature within the scheduling display:

early warning system altering

Deployment

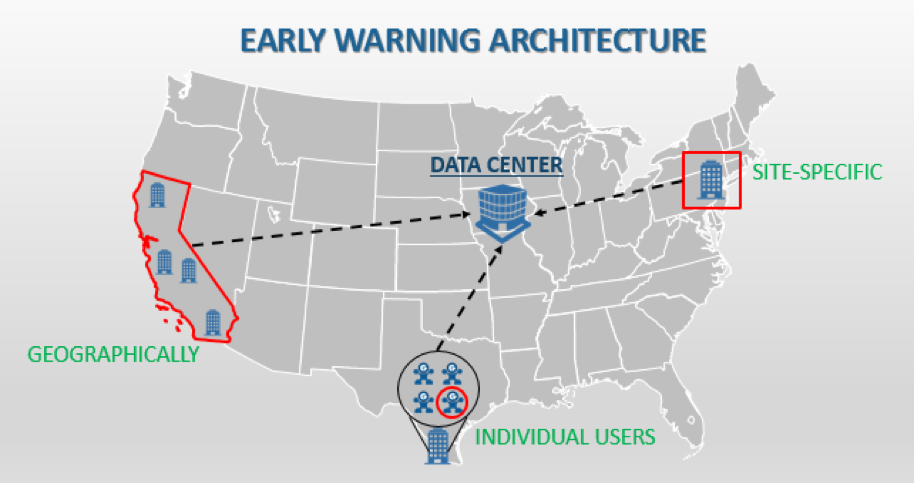
The Application Availability Monitor can be deployed however you desire. You can deploy it on-premises or in the cloud to identify individual, site or geographic application availability issues. Because the logon attempts can be scheduled and remotely deployed, it can be strategically positioned at the location users sign in from to provide visual proof regarding logon success, logon failure or logon slowness from the user’s unique access location. This way, IT admins can diagnose whether issues are location specific or global in nature, providing the help desk with relevant data regarding availability and performance.

This is an illustration of how a deployment is configured for ten remote locations that logon daily to centralized applications hosted in the internal cloud.

proactive deployment architecture for application availability monitor

Remediation

There is also an integrated remediation engine within the Goliath Application Availability Monitor. The remediation engine is customizable; however, it comes with a large number of prebuilt rules geared toward quick, automated resolution and prevention of further issues or complications. For example, a XenApp server could be set into maintenance mode to prevent future failed logon attempts, or key dependencies on role servers could be checked to automate the investigation process.

Below is a screenshot of the remediation feature within the scheduling display:

remediation

Integration with Goliath Performance Monitoring

The Goliath Application Availability Monitor is also fully integrated into the Goliath Performance Monitor. As a result, IT professionals not only can identify application availability issues but also the root cause. Other technologies called “logon simulators” may be able to simply ‘identify’ a logon failure, but without full integration into an enterprise monitoring product, there is no way of identifying why a performance issue occurred. If applications are being monitored individually, they are being gauged separately and may look fine. It is only when executing the fully integrated launch process by multiple users – including remote access, application/desktop availability and the delivery infrastructure – that you not only trigger issues but see contextual, objective evidence of where the root cause of these issues is actually sourced.

Summary

Goliath’s Application Availability Monitor is the only solution available today that proactively gauges logon performance by exercising the entire delivery infrastructure in concert exactly as an end user does. The Goliath Virtual User can do this over the same network using the same profile permissions/setup as the actual end user. The result is an advanced warning system that accurately reports issues, empowering administrators to identify and resolve end user experience issues related to logon initiation and logon duration before productivity is hindered.

The technology can deliver these capabilities through proactive, real-time threshold-based alerts, the live dashboard, detailed drill-downs/screenshots for logon process analysis and rich historical reporting.

Those features, combined with a fast and simple process for deployment, configuration and operation allow organizations to preemptively identify issues before users are impacted. It also enables them to identify where the issue is occurring, pinpoint the root cause and collaborate toward resolution faster than ever before.

Want to see a personalized demo or access a 30-day free trial of
the Goliath Application Availability Monitor? Contact us today!

techinfo@goliathtechnologies.com  |  (855) 465-4284

Questions When Evaluating Monitoring & Troubleshooting Software

Questions When Evaluating Monitoring & Troubleshooting Software

Questions When Evaluating Production-Ready Monitoring & Troubleshooting Software Solutions

There are many IT Operations products in the market that focus on monitoring and management. The key difference between Goliath Technologies and other products is our focus on end user experience with Citrix and healthcare. Though there are good products that have some functionality for Citrix, there isn’t another solution that offers the end-to-end capability to anticipate, troubleshoot, resolve, and prevent end user experience issues with Citrix. Pertaining to healthcare, there isn’t another company that has purpose-built modules to support major EMR/EHR applications and correlate the application and system performance data.

The single most important criteria that determines the “best product” is the customers’ specific requirements. We cannot say that the major differentiators above are important for all customers. For those who have a desire to test the “production-readiness” of a product, the Goliath Technical Support Team have put together a summary of questions, asked by our customers, to troubleshoot issues and proactively manage their Citrix and EMR/EHR environments.

What is important to note is that through our customers’ unique experiences, our support team has acknowledged that the questions posed typically stem from three key areas (Pictured below). All attribute to one common goal: a positive End User Experience.

Here are some of the questions that can empower Citrix administrators to determine if a vendor’s ability to anticipate, troubleshoot, resolve, and prevent Citrix and EMR/EHR issues satisfy their unique demands.

Logon Initiation

Anticipate

  1. Can logon and applications be tested with simulations using real ICA sessions?
  2. Can logon, session and application or desktop availability issues be identified and resolved before end users are aware?

Troubleshoot

  1. Can you identify if logon issues are geographically-based, site-specific, or user-based, in advance?
  2. Can you drill down into failed logons and identify exactly what part of the logon process failed and when it failed?

Resolve

  1. Are detailed reports available on the success and failure rate of simulated logons?
  2. Is it possible to take remediation when issues are identified with simulated and actual real user logons?

Logon Process

Anticipate

  1. Can preemptive rules and alerts be configured based on logon duration thresholds?
  2. Can logon simulations be used to identify slow logons before users are impacted?

Troubleshoot

  1. Can you identify if a slow logon was a result of a delay related to the starting up of a virtual desktop?
  2. Can the technology identify if the ICA file download is slow?
  3. Will you know when the session launch page is loading slowly?
  4. Are you able to identify when logon is slow because of an overloaded XML broker?
  5. Can you identify that client side validation and session brokering is slow?
  6. Is it possible to drill into session logon to know how long Active Directory takes to obtain GPOs and determine if they are applicable?
  7. Can the technology identify how long it takes to process Citrix policies vs Windows Policies?
  8. Is there the capability to identify if a corrupt print driver is causing a delay in the logon process?
  9. Can the technology natively break down the following GPO types and the length of time it takes to process each?
    1. Registry extensions
    2. Folder redirection extensions
    3. Scripting extensions
    4. Folder extensions
    5. Folder Options extensions
    6. Group Policy environment extensions
    7. Local user group extensions
    8. Drive map extensions
    9. Scheduled task extensions
    10. Files extensions
    11. Ini files extensions
    12. Search extensions
    13. Shortcut extensions
    14. IE zone mapping extensions
    15. IE settings extensions
    16. Citrix Profile Management Extensions
  1. Is there a fully detailed breakdown of the Logon Duration States, Citrix Receiver Startup Stages, Brokering Stages, and Session Launch Stages in a single screen?
  2. Can the technology provide data to correlate each state properly and understand the true duration of logon?
  3. Are there detailed historical reports on every session, its logon duration, and how long each of the specific components took to complete?
  4. Can logon stages be correlated with event logs to identify root cause?

Resolve

  1. Is it possible to configure remediation actions to automate the resolution of logon duration issues?
  2. Can ICA session simulations be conducted to test and validate configuration improvements made to the logon process?
  3. Are reports available to baseline and trend detailed logon duration metrics over time?

Session Performance

Anticipate

  1. Are preemptive threshold based alerts available on the following session performance issues
    1. ICA Latency
    2. ICA RTT
    3. Network Latency
    4. Active Sessions
    5. Available VDI
    6. XenApp Session Host Server Load
    7. Active XenApp Session Count
    8. Active XenApp User Count

Troubleshoot

  1. Is correlation possible with ICA Round Trip Time to ICA latency and Network Latency?
  2. Can you identify that network jitter is causing a client side issue with remote users?
  3. The technology correlate ICA latency to network jitter?
  4. Can the technology provide visibility into all the ICA channel, and application usage to identify issues such as a user session is slow because they are watching video in session consuming all available bandwidth?
  5. Is it possible identify that a print job outside of the ICA session is cause poor session performance within the session?
  6. Does the technology provide reporting to see that ICA Latency increases every day at the same time over a period of one year?
  7. Is there a detailed analysis of each of the 50 ICA channels and how they impact session performance?
  8. Can you provide detailed historical reports on ICA Round Trip Time and how it correlates to problems with the underlying infrastructure?
  9. Can you drill down to correlate ICA round trip time with high storage latency to pinpoint user session performance issues?
  10. Is there robust event log management available that allows you to archive all event logs from all monitored virtual/physical Windows machines including PVS or MCS provisioned session hosts?
  11. Can all event logs be viewed and analyzed including Application and Services Logs?

Resolve

  1. Can remediation actions be taken to automate resolution of issues such as print service failures?
  2. Are reports available to trend session performance overtime to validate performance and issue resolution actions?
  3. Does the technology provide an inbuilt knowledge base for IT staff to share specific resolution details directly in the alerts?

There is no disputing the importance of Logon Initiation, the Logon Process, and Session Performance, but monitoring and troubleshooting software solutions must also take into account other factors. As our Support Team has learned, there is more to a positive end user experience then the three pillars mentioned above. Which is why questions related to the Citrix NetScaler and Healthcare in general must be taken into consideration when evaluating different products in the marketplace.

NetScaler

Anticipate

  1. Can alerts be generated preemptively for poor ICA session performance metrics such as RTT and network jitter?
  2. Are alerts available to notify you of an HA failover?

Troubleshoot

  1. Can you to correlate ICA roundtrip time with Network Jitter?
  2. Is it possible to identify if proxied ICA session performance issues are client side or server side?
  3. Can the technology provide you with a single console for managing the entire NetScaler deployment?
  4. Is there visibility into the following NetScaler metrics?
    1. Activity by application/VIP
    2. Transaction response time
    3. User IP
    4. Transactions per NetScaler
    5. Transaction Load Time
    6. Page Latency
    7. Pages Viewed
    8. Faults by Error Codes
  5. Is there unrestricted historical reporting on NetScaler usage and trends?

Resolve

  1. Is the capability to share analytical data live via URL with collaborators to resolve issues?
  2. Is there integration with other monitoring technologies via Syslog or CSV?

Healthcare

Anticipate

  1. Are there purpose built modules for EMR/EHR applications available in the technology?
  2. Does the technology have specific performance graphs, rules and alerts available for MEDITECH

3.Is a module available for monitoring and preemptive based alerting for Allscripts?

4. Can simulations be conducted to ensure that EMR/EHR applications are available before health care workers           access the environment?

Troubleshoot

  1. Is the technology able to be deployed to monitor XenApp servers in the Cerner Datacenter?
  2. Can you have complete visibility from the user’s endpoint into a hosted EMR/EHR application to identify if root cause is resulting from the provider or from your infrastructure?
  3. Can all event logs be archived, analyzed and alerting on from the EMR/EHR platform for root cause analysis?
  4. Is there visibility to troubleshoot EMR/EHR platform specific faults and performance issues?

Resolve

  1. Does the technology have detailed reporting for collaboration with EMR/EHR vendors?
  2. Can remediation actions be taken to automate the resolution of issues?

Summary

What has become clear is IT Operations products in the market focus on monitoring and management. When evaluating solutions that offer end-to-end capabilities, it’s important to ask the right questions. As our Goliath Support Team has noticed, each customer has distinct IT requirements and unique challenges that must be addressed. A positive End User Experience is the heart of all IT Operations products. The first question that should be asked is which product can anticipate, troubleshoot, resolve and prevent end user experience issues with Citrix and healthcare? Goliath Technologies has solutions that are purpose-built and product-ready to not only answer questions, but satisfy those requirements and challenges and ensure a positive end user experience for all.

Product Review: Proactive Management of EUE with Goliath

Product Review: Proactive Management of EUE with Goliath

This independent review of Goliath’s Performance Monitor & Logon Simulator for Citrix is republished on our blog with permission from Rob Beekmans, vExpert, CCEE, CCIA, VCP5, VCP5-DT, VCAP-DTD, MCSA2012. The original post appears here on Rob’s blog, EUC, UEM, Mobility and Monitoring.

In my previous blog about Goliath Logon Simulator for Citrix, I stopped just after the Citrix XenApp and XenDesktop session was established. The last thing I showed you was the result of the Logon Simulator from the console. If you missed that article, it is a good start before reading this article, you can read the story here.

In this article I will go deeper in the product and show you how you can see very cool and wanted metrics within the Citrix ICA and HDX channel, and how you can monitor and debug a Citrix environment.

If we were to take a poll on the coolest report Citrix EdgeSight used to have, I’m sure #1 and #2 would be Logon Details and Session Startup Details, which gave very detailed information, step-by-step client side and server side. Logon Details gave insight in GPO load time, logon scripts and so on.

Together, these features are a killer combo, but they were hidden in a license that was hard to sell and now Citrix decided to kill all cool features to start fresh, leaving you and me thinking of the past.

No worry, those two cool reports are still there, not delivered by Citrix but through Goliath Technologies. When you do proactive monitoring with the Goliath Performance Monitor the agent measures all this data and will report this to the console. The great people at Goliath added this report in the console so life without EdgeSight is wonderful again.

Enough talk, let me show you what they have in the product.

The most important metrics you want while monitoring a Citrix environment are:

  • ICA/HDX Latency
  • GPO load time
  • Bandwidth and congestion
  • Connection time to the broker/web front
  • User profile load
  • vGPU performance (becoming more and more common)

Reports

Goliath offers several reports to will help you understand the end user experience. Just to remind you, Goliath preforms simulated Citrix XenApp and XenDesktop user logon with actual user accounts. With that in mind you can understand that loads of data is gathered.

Each session is stored and can be debugged in details afterwards if needed through a search function. I started a couple of sessions over a few days to get some data.
In my last article we primarily looked at the reporting of the Citrix Logon Simulator section, now we focus on the section XenDesktop/XenApp session which is much more interesting for IT guys. In the report below you see two sessions that were active, if you look closely you see two important metrics right in the open.

The logon time and the ICA latency are reported already, giving you instant information about the user experience. So were done, right… or wait there is more, so much more.

xendesktop-session-ica-display

Logon Duration

If you want to see more data you click on the + mark next to the session you get into the reporting part. A huge number to tabs and sub tabs will open where you find detailed information about the session, the server and the user. First we start with the logon duration that was shown also in the main screen.

The logon duration is more than just logon, it is made up from several steps that together make up the logon time. The logon time is made up with the following steps:

  • Logon time
  • Client validation; brokering
  • Authentication
  • GPO
  • Scripts that run
  • User profile

All are shown in the report and the time they take, also per step a detail is given.

citrix-logon-duration-report-goliath-technologies

If you look at the details in the report above you see that it shows exactly what server, domain, etc. it is talking to. This is the kind of detail you want in a report when you debug slowness for instance.

If we look at the break down of all of this, what I used very much in EdgeSight was the Start Detail Report for it showed all aspects of the connection. If you never worked with EdgeSight you might think it a silly game with lots of letters but they all actually stand for something.

CASD for instance is Credentials Authentication Server Duration, in plain English, translates to, how long does it take to get your credentials verified. On the client side you have LPWD, its not a police force, it’s Launch Page Web Server Duration, or how long does it take to launch the web page (Storefront or Web Interface).

Depending on your environment you get different values and more or less values. There are lists on the Internet to tell you what the abbreviations mean, I’ve included one that was written for EdgeSight.

logon-duration-details-goliath-performance-monitor

ICA Channel

A detailed report about the ICA Channel delivers metrics that are important to understand the end user experience. The ICA channel performance will be different from normal network performance, latency for the ICA channel and network latency can be different.

ica-channel-session-metrics-goliath-performance-monitor

Here you also find ICA Latency, a very very important metric to be measured. Together with the bandwidth and network latency this give a good indication whether the user is having some issues. Latency is the time it takes for a package to travel from one point to it’s destination, the higher the number the worse your user experience gets.

Next to latency there is available bandwidth not to be mistaken with speed. The available bandwidth has a direct influence on the latency, if your pipe gets congested latency goes up.

This has nothing to do with the speed of your connection, you can have a 100M connection but when it’s congested it will not perform. To solve congestion you add more pipes, unfortunately that doesn’t mean latency will go down in the same rate, latency can have more influencers.

Goliath offers a report that shows these metrics together so you see the relation between them.

citrix-session-performance-goliath-tech

Virtual Machine

There is an option also to look at the virtual machine and see numerous of metrics that will help you understand the performance of the user session and the machine it lives on. This virtual machine metric dashboard has many other tabs showing relevant information about the server, the following tabs are shown;

  • CPU & Memory disk use
  • Disk Peformance
  • Disk Space use
  • Network Throughput
  • Storage & VM Limit
  • Agent Up&down
  • Graphics Metrics
  • Storage Trends
  • Storage Allocation
  • Storage Usage

Well if that doesn’t give you enough information I don’t know what will, let’s take a look at some of them.

vmware-host-metrics-goliath-performance-monitor

If we look at server disk performance we see the performance of the disks, throughput and IOPS being displayed. In my lab with one or two users there is no issue but in a live environment this might be valuable and show if the user is having issues because of a lack of IOPS.

vmware-virtual-machine-metrics-goliath-performance-monitor

A minor report is the Disk Space Use, which allows you to identify conditions where there is unchecked disk space growth on your diff and identity disks.

vmware-server-performance-metrics-goliath-performance-monitor

Network throughput is important in solving issues with end user experience. If for some reason your network speed is low it might impact the end user experience. As I said before speed is not the most important factor in end user experience but a lack of speed doesn’t help also. All metrics work together to deliver the best performance, think about the E1000 versus the vmxnet3 NIC and the performance difference it gave.

network-throughput-metrics-goliath-performance-monitor

vGPU Performance

One of the cool features I think is the ability to monitor the usage of vGPU with their Performance Monitor for NVIDIA GRID vGPU. Goliath is working closely with NVIDIA to capture the data of the cards that need to be captured. I borrowed this screen shot from Goliath for my home lab is not equipped with a grid card. If you monitor an environment without a vGPU this tab won’t be visible.

Metrics you find here are:

  • Frames per second
  • vGPU Compute Utilization
  • vGPU Memory Utilization

nvidia-vgpu-performance-metrics-goliath-technologies

Application Performance

When debugging or monitoring sessions you need to know the context of the issue the user is experiencing. The context of the user experience is to know which other processes are running and using resources. The application performance report is doing just that, it shows the other processes running with metrics per process.

application-performance-metrics-goliath-technologies

Session Properties

A good start is always the overview of the session you’re debugging, without a good sense of the session the metrics say nothing. Together with Citrix Director, which does a good job of showing information about a session, this report also shows the session properties.

Here you can verify versions, networking details and so much more, I think it’s a good starting point and a good report to end this article with.

logon-simulation-goliath-technologies-logon-simulator

I think Goliath offers a very good tool to do simulated Citrix logons with actual user accounts and that the reports are useful to monitor and debug a session. If you look for a monitoring tool to look at the user logon performance of your Citrix environment Goliath would certainly be able to fill that in.

The addition of vGPU is something that will be needed more and more, even Citrix XenApp servers will get graphic cards in the near future.

Final Thoughts

I spoke to Goliath about the next versions of the tool and as I wrote also in my previous article, starting an application is something that might be useful for that is a user action also that might vary in time. If they could start an application (e.g. Word) and report time it takes to load certain plugins that would be useful.

Another addition would be to be able to do exactly the same as they do with Citrix in a VMware Horizon View environment. It all depends of course with VMware opening up the API’s to allow them to ge the data from the channel. In my job I see a 50/50 in deploying Citrix and VMware and for VMware there are less options to do simulated monitoring.

Perhaps integration with vCops, or as it is now called, vROps (vRealize Operations) would be interesting for all data is collected there already although not all our customers have that running. If I had to make a choice it would be both ways, integrate and be independent as well to accommodate both customers.

Hopefully, my article gives you a better idea of what Goliath is capable of. To see for yourself, try a 30-day free trial or demo of Goliath Performance Monitor.

 

Product Review: EUE Logon Simulator for MEDITECH & Allscripts

Product Review: End User Experience Logon Simulator for MEDITECH & Allscripts

Healthcare IT teams now use the Goliath Logon Simulator to proactively fix end user logon issues to ensure physicians and healthcare workers can successfully logon to EHR apps like MEDITECH & Allscripts

When a doctor or nurse attempts to logon to EHR applications like MEDITECH or Allscripts they simply expect it to work, every time, in order to deliver patient care (i.e. do their job).

To improve the experience for end users who rely on MEDITECH and Allscripts, and on apps delivered through Citrix like Word, Oracle, and Internet Explorer, Healthcare IT teams use the Goliath Logon Simulator to proactively troubleshoot and fix end user logon issues before doctors and healthcare workers are effected.

Testing & Simulating the End User Experience

Goliath’s Logon Simulator for MEDITECH and Logon Simulator for Allscripts allows IT admin teams to anticipate the experience that end user physicians and healthcare workers will have when they attempt to logon to MEDITECH and Allscripts.

The logon performance technology tests and simulates the exact process a real end user experiences as they attempt to logon to their EHR app or an app delivered through Citrix like SAP, Excel, Internet Explorer or Adobe Reader.

When the Logon Simulator detects a logon performance issue, the administrator gets a preemptive alert, and in a single view is able to identify the root cause and deploy remediation actions before physicians or healthcare workers fail to logon.

This short video shows how the Goliath Logon Simulator for MEDITECH works:

[video_lightbox_vimeo5 video_id=”127055286″ width=”1000″ height=”563″ anchor=”/blog/wp-content/uploads/sites/2/2015/05/Goliath-Logon-Simulator-Simulated-Logon.png”]

Features of the Logon Simulator for MEDITECH & Allscripts

Here are a few of the Logon Simulator’s features that make the technology an industry first and trusted by health systems like Augusta Health:

  • Real life simulation of an end user
  • Simulate any Citrix delivered application or desktop
  • Ability to simulate logon initiation from both local and remote locations
  • Breakdown of the logon duration process by stage for each end user
  • Detailed analysis of ICA protocol by channel
  • Simultaneous alerting and self-healing

Try the Goliath Logon Simulator for MEDITECH or Allscripts

To see if the Goliath Logon Simulator is right for you, you can get a fully supported free 30-day trial or personal demo.

 
Browse EHR Monitoring & Troubleshooting Webinars