How Universal Health Services Troubleshoots & Prevents Cerner and VDI Logon Issues

How Universal Health Services Troubleshoots & Prevents Cerner and VDI Logon Issues

How We Did IT

Universal Health Services Uses Goliath to Prevent Cerner and VDI Logon Issues


User Story Banner

“We selected Goliath Technologies because their end user experience monitoring and management supports Cerner and identifies systems degrading before physicians and patients are impacted. We do more than 15,000 Cerner application test launches per day. This early warning system coupled with enhanced performance data and analysis puts us in a better position to collaborate with Cerner to resolve issues.”

– Mike Nelson, Sr. VP of Strategic Services, Universal Health Services

Infrastructure

Cerner, Citrix


Challenge

UHS is one of the 10 largest for-profit health systems in the United States, and they rely heavily on Cerner to deliver EHR application services to healthcare professionals all across the country. They were faced with several challenges related to application failures and slowness, which impacted clinician and healthcare worker end user experience. More importantly, there was no solution in place for troubleshooting and/or providing advance warning when issues surfaced.

There Were Two Key Challenges Faced by UHS:

1. There simply wasn’t a technology available that could provide systems administrators at the hospital locations advance warning of clinician issues with the logon process, such as failures or slowness related to their Cerner-hosted application.

2. The distributed nature of the UHS user base and hospital locations presented challenges with identifying the root cause of logon initiation, logon duration and session-related issues. UHS required a solution that would enable them to quickly identify if an end user problem was occurring based on geography, site, application and/or the individual.


Solution

Test the Entire Citrix & Cerner Delivery Infrastructure

The combination of the above factors made it very difficult for UHS to get ahead of their application delivery challenges such that end user experience could be improved. Goliath provided them with a technology that enabled them to overcome the visibility limitations they were faced with and to resolve their logon performance and availability issues.

The Goliath team developed a technology called Goliath Application Availability Monitor. The technology is deployed at the remote hospital location and logs onto the Cerner application using Citrix.

It tests the entire Citrix and Cerner delivery infrastructure to ensure that both Citrix and Cerner will launch when clinicians and healthcare workers attempt to access their applications. The Application Availability Monitor may be deployed with or without the intelligent agent deployed on the Cerner XenApp servers. At UHS, the Goliath Application Availability Monitor was deployed at over 30 acute care facilities across the United States. At each facility, the Application Availability launch client is installed and configured on two physical workstations at each location. The Application Availability Monitor launches are configured to connect to the Cerner-hosted data center every 30 minutes, following the same network path as an everyday user.

15,000+ Cerner Application Logon Tests Per Day

Upon logging into the Cerner application delivery environment, the Application Availability Monitor launches five Cerner applications (PowerChart, Firstnet, SurgiNet, SAAnesthesia, and Pharmacy Med Manager). Launching these applications not only validates the availability of the programs, but it also exercises the entire logon initiation process. This ensures that all components are available and operating efficiently end-to-end. On a daily basis UHS IT performs over 15,000 Cerner application logon tests. These tests enable UHS to pinpoint and isolate availability issues before users are impacted, regardless of location.

The true power of the Application Availability Monitor technology is that it is not simply a series of automated scripts. It is software that initiates a connection to Cerner using the same logon sequence and process that a real end user follows to initiate a Citrix session. From a physical Windows Client or virtual machine, a Windows/Active Directory user account is configured to open a web browser, access the Cerner site, authenticate to the XenApp environment, launch the applications and then log out of the session(s). This entire workflow is conducted in the same manner that a user follows, down to the mouse clicks.

Accurately Representing the End User Experience in the Environment

The result is the most accurate representation of what an actual end user will experience when they access the environment. All of the metrics generated during the simulated session are reported back to the central end user experience support team at UHS in real-time. These metrics allow the UHS team to take immediate action whenever trouble arises. The following image depicts the deployment architecture.

Map of Cerner's connection to UHS

The Application Availability Monitor is also a powerful tool for hospitals using Citrix and Cerner when identifying whether an issue is widespread or location-specific. In one instance, users at one of the UHS hospital locations were having difficulty launching and using the Cerner application.

Analyzing Real-time Data

Based on feedback received from the individuals experiencing the problem, all signs pointed to the Cerner application being unavailable. However, after analyzing the real-time data produced by the Application Availability Monitor at other sites, administrators quickly realized that sessions and applications were launching successfully and functioning reliably across the country.

The Application Availability Monitor data provided the needed evidence required to identify the problem as site-specific, and not related to the Cerner application or hosted facility. As a result, the support team was able to focus immediately on the location where the issue was being experienced and identified unreliable hospital Wi-Fi as the root cause. As depicted below, each simulation is scheduled to run on a regular, reoccurring basis. If issues arise, notifications are sent in real-time allowing support teams to address the conditions immediately.

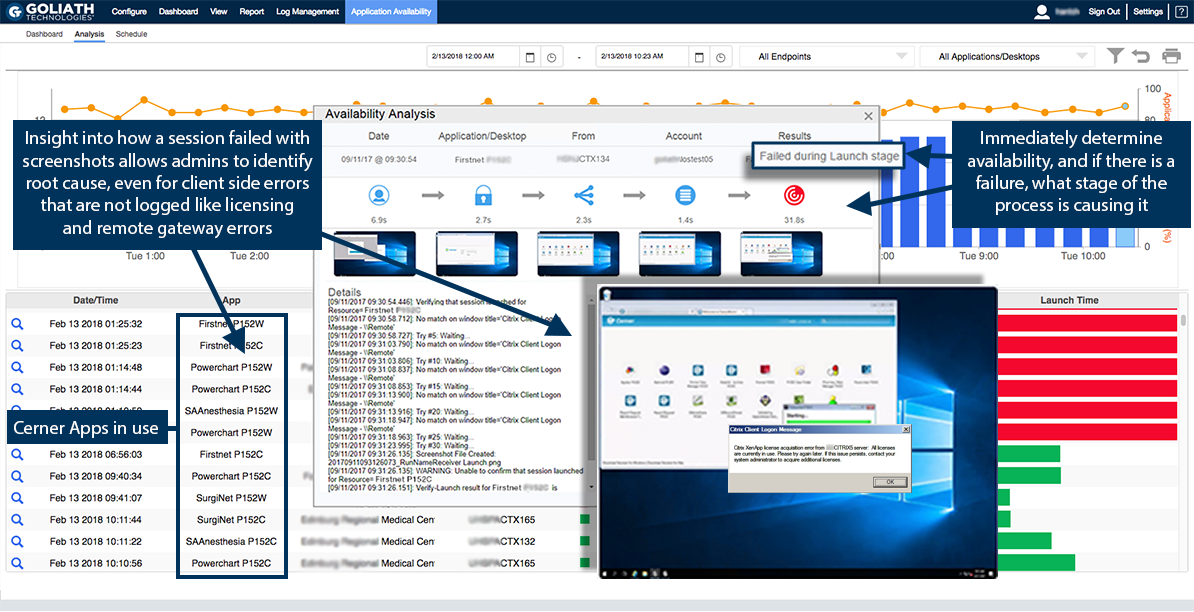
Directly from the primary dashboard, administrators and support staff have the ability to drill down into simulation events. This enables them to obtain detailed information as to why a test may have failed or underperformed. This actionable intelligence is then either used to troubleshoot and resolve the issue or is provided to third parties such as Cerner to collaborate on a resolution.


Analysis Page w DrillDown v2.0

Results

Goliath Application Availability Monitor gave UHS the tool they needed to identify and address logon and application availability issues in advance of end users being impacted. It also provided them with the capability to quickly diagnose and target root cause.

UHS Logo

ABOUT UHS

Universal Health Services (UHS) is a major healthcare management company in the United States. It operates hospitals, behavioral health facilities, and ambulatory care centers across the country. UHS offers a wide range of medical services, from general healthcare to specialized treatments. Its mission is to provide quality healthcare services to communities, though it is a for-profit entity in the private healthcare sector.

Headquarters location: King of Prussia, Pennsylvania
Founded: 1979
Employees: 94 000
Industry: Healthcare

Prevents Cerner & Citrix Performance Issues from Impacting Clinicians

Prevents Cerner & Citrix Performance Issues from Impacting Clinicians

How We Did IT

Prevents Cerner & Citrix Performance Issues from Impacting Clinicians


Prevents Cerner & Citrix Performance Issues from Impacting Clinicians

Chris Timbers“Goliath Technologies’ End User Experience Monitoring gives us complete visibility into the end-user experience from the time they logon to Cerner through their use of the application, in real-time, so we stay ahead of performance issues that can impact our users.” – Chris Timbers, CIO at NorthBay Healthcare 
Infrastructure

Cerner Millennium, Citrix

Challenge

This story speaks to unique challenges that NorthBay faced and how they used purpose-built technology with embedded intelligence and automation to be alerted, in real-time, to Cerner Millennium or Citrix logon issues before physicians or clinicians were impacted.

IT Challenges with Cerner Millennium & Citrix that Impact Patient Care

NorthBay IT was faced with the following daily challenges:

Slow logons for Cerner and Citrix: Physicians log on from different locations throughout the hospital and see patients every 20 minutes, so a two-minute delay when trying to access Cerner is too long to wait. Speed of access to these applications is critical to ensuring that time is spent providing healthcare service and not waiting for application sessions to launch.

Delayed identification of Cerner or Citrix performance degradation: Degraded session performance severely impacts the timely delivery of patient care. As a result, it is critical that performance “slowdowns” are identified early, before the ability to deliver services is impacted [Learn more about Goliath Performance Monitor for Hospitals Using Cerner].

Complexity of the Cerner and Citrix Logon Process: The Cerner and Citrix logon process is the primary step to accessing mission-critical applications. It is complex and relies on many components to successfully complete the logon process, making it difficult to troubleshoot without purpose-built technology.

Lack of Visibility: NorthBay healthcare providers primarily utilize the Cerner application via Citrix. This application is hosted by Cerner. NorthBay had visibility into their own infrastructure while Cerner actively monitored application performance in the data center. However, there was no effective end-to-end performance monitoring from the data center to the desktop.

Solution

What Goliath Technologies Provided

After an exhaustive search to identify a solution for NorthBay’s unique visibility challenges, their team elected to deploy Goliath Performance Monitor and Goliath Application Availability Monitor with out-of-the-box functionality to support Citrix and Cerner.

Implementing Goliath Performance Monitor in just the NorthBay environment was not going to be sufficient in providing the end-to-end visibility that they required. However, because Goliath is the only monitoring technology allowed in the Cerner hosted facility, we were able to provide an industry-only fully integrated solution that encompasses their entire application delivery architecture. Goliath Performance Monitor offered the following capabilities to the administrators and support staff at NorthBay:

  • End-to-end visibility that enables them to have performance and availability metrics from the end-users’ perspective at the hospital location. This data can be trended in real-time and historically.
  • Visibility into both on-premise and Cerner-hosted applications and servers.
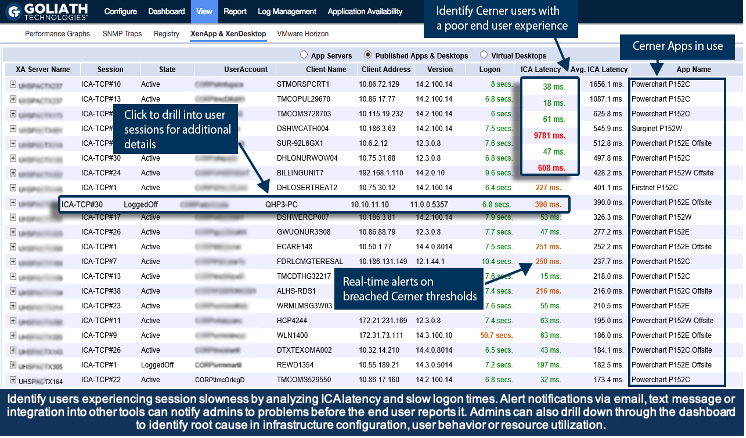
Cerner session display

Results

Once the product was deployed, NorthBay system administrators had true end-to-end visibility with comprehensive monitoring of both Cerner Millennium and Citrix. They received an in-depth view into the entire user workflow, regardless of location. Goliath’s Cerner and Citrix monitoring capabilities, combined with Cerner’s remote hosting technologies and services, provide NorthBay with advanced warning of potential end-user experience issues and evidence of root cause to resolve and prevent future issues.

To increase visibility across the network, NorthBay also wanted to guarantee that clinical applications would launch when physicians and healthcare workers attempted to log on. Healthcare workers see patients about every 20 minutes, so the applications needed to launch immediately to avoid scheduling delays. Goliath Application Availability Monitor was deployed to proactively log on to applications and alert IT administrators of logon failures or slowness before end users were impacted.


Cerner GAAM Screen

The advantage of having the Goliath solution deployed on-premises, where clinical applications are hosted, is that NorthBay now has complete end-to-end visibility that previously could not have been accomplished. In addition, NorthBay can complement the quality monitoring and management that CernerWorks provides in the hosted facility with their own on-site end-user experience monitoring and management.

NorthBay Health logo

ABOUT ORGANIZATION

NorthBay Health is a non-profit healthcare system in Northern California. NorthBay Health is dedicated to providing quality healthcare services to the local communities it serves, with a focus on community health and wellness. They are committed to delivering the highest level of care possible and rely upon Cerner and Citrix to support this objective throughout their health system.

Headquarters location: Fairfield, California
Founded: 1960
Employees: >2500
Industry: Healthcare

How CDK Global Selected vSphere Troubleshooting Product

How CDK Global Selected vSphere Troubleshooting Product

“We wanted a product for VMware vSphere Performance Monitoring that was very competitively priced, had great flexibility, a complete feature set and was easy to implement and manage. We found it in Goliath for vSphere Performance Monitor”

-Mike Musgrove, Product Development Consultant, CDK Global


The Organization: CDK Global

About the Organization: CDK Global is a $2 billion global provider of IT and digital marketing solutions to 27,000 retail automotive locations in 100 countries. CDK Global has been in business for over 40 years.

The Organization’s Infrastructure: VMware, vSphere supporting hosted applications

The Organization’s vSphere Performance Monitoring Product: Goliath Performance Monitor for VMware vSphere


The Business Challenge: Anticipating & Remediating End User Performance Issues

I was tasked with evaluating and testing various VMware vSphere performance monitoring products to manage our complex IT infrastructure. Specifically, we needed deeper visibility into VMware server performance so our IT Operations team could increasingly anticipate potential end user computing (EUC) performance issues and avoid them by proactively executing remediation or self-healing actions when vSphere performance issues were detected by the vSphere performance monitoring product they selected. If issues did occur that compromise the end user computing experience, it was essential to have the right visibility and VMware server performance data to quickly troubleshoot and resolve before our end users complained.

Two key requirements in our vSphere performance monitoring selection criteria:

  1. The product must cover a broad range of platform servers because at CDK Global we use a wide variety of operating systems such as UNIX, UnixWare, AIX, Microsoft and various forms of Linux servers all on VMware.
  1. The product must have the same monitoring and troubleshooting functionality for both physical and vSphere environments and local and remote monitoring.

Additional requirements in our vSphere selection criteria:

  • Easy to use vSphere performance monitoring
  • Flexible installation and deployment on the various platforms we maintain
  • Easy to manage vSphere performance monitoring
  • The ability to simultaneously alert and run self-healing programs to automatically remediate problems with vSphere while not needing administrator intervention or having the software change something in our environment

The Solution

I evaluated many different Vmware vSphere performance monitoring products at various price ranges. The exhaustive evaluation included, but wasn’t limited to, HP OpenView, SolarWinds, Nagios, and Kaseya. The decision to choose Goliath for Vmware vSphere Performance Monitoring was made for the following reasons:

  • Ease of configuration: Goliath for vSphere Performance Monitoring comes with hundreds of preconfigured monitoring rules that make it very easy to set up and begin monitoring VMware vSphere. These vSphere monitoring rules proactively monitor all VMware vSphere performance metrics so an administrator doesn’t have to worry if they’re looking at the right things. The monitoring intelligence is out of the box.
VMware Monitoring Rules
  • Schedule reports: We also found that Goliath for vSphere Performance Monitoring offered us the ability to run or schedule reports on WMI objects, enabling us to not only monitor for faults but also to detect and tune systems for peak performance, and automatically detect where bottleneck or performance issues were occurring. This is especially useful for intermittent faults as these can be brought to our attention without the need to logon to a suspect server and waste time watching for events or problems.
  • Agent or Agentless monitoring: The capability of monitoring VMware virtual servers in real-time with either an agent or agentless solution offered great flexibility. It is easy to capture key metrics from the virtual machine, host or hypervisor; i.e. the full VMware vSphere stack.
  • Real-time visibility: Comprehensive vSphere reports and interactive vSphere alert screens offered real-time visibility into the vSphere performance of our VMware vSphere virtual server farms as seen in the image below.
VMware Storage Network Performance Metrics
  • Master “Intelligent” Agent: The Goliath for vSphere Performance Monitoring includes a Master “Intelligent” Agent that allows one agent at a remote site, behind the firewall, to be designated a Master Agent and receive alerts from all the other agents deployed at that site. The Master “Intelligent” Agent will then send status and alerts back through the firewall to the remote Goliath Performance Monitor server. This made monitoring vSphere in our remote locations very easy and efficient from a resource and management perspective.
  • vCenter Plugin: Goliath for vSphere Performance Monitoring has a VMware vCenter plugin that provides a single pane of glass dashboard from which you can monitor the physical and VMware infrastructure in vCenter as seen below.
vCenter Plugin

The Results

For our VMware environment, we are now using Goliath to monitor 2,700 vSphere servers both in our data centers and on customers’ remote sites.

We can automatically log calls on our own bespoke call control system and allocate engineers to rectify problems on vSphere virtual servers, sometimes even before the customer is aware that a problem exists. All the statistics from the Goliath vSphere Performance Monitor are fed directly to our Extranet to give our customers a real-time view into the health of their own servers.

Excellent Customer and Tech Support

Obviously, with the number of VMware servers we have it was crucial that we had access to vendor support should a problem come to light. Support is something Goliath Technologies takes very seriously!

Solutions to queries on the product or features were quickly responded to and rectified by the Goliath team. Also, when necessary the Goliath team added enhancements in a very professional and timely way.

We wanted a VMware vSphere performance monitoring product that was very competitively priced, had great flexibility, a vast host of features and was easy to implement and manage. We found it all in the Goliath for vSphere performance monitor.