

RCH Holdings Drops Citrix Slow Logon Times 5 Min to 30 Sec

RHC Holdings

RCH Holdings Drops Citrix Slow Logon Times 5 Min to 30 Sec

citrix slow logon

Kaleb Propst“We were hosting our IT Infrastructure and moved it in house to improve overall SLA’s, end user experience, and specifically Citrix logon times. When we moved IT back on premise, we knew we needed a technology that was purpose built for Citrix XenDesktop 7.6 that enabled us to look at the logon process from the end user’s perspective. Goliath has the most detail we have seen in any technology and we used it effectively to significantly reduce our Citrix logon times.”
 

-Kaleb Propst, IT Technician at RHC Holdings 

Infrastructure

Citrix XenDesktop 7.6 & XenServer

Challenge

Stop the “Logon Bombs” & Proactively Troubleshoot & Remediate Slow Citrix Logon Issues

Kaleb Propst and his team were not satisfied with the public cloud provider they were using. Being unable to consistently meet SLA’s, the decision was made by the executive team to build their own data center.

In the hosted environment, there were any number of issues but certainly the one that caused the most pain was Citrix XenDesktop 7.6 logon times that were averaging between 2-5 minutes. It was not a tenable situation and one they decided to address when they moved IT on-premise.

In an attempt to troubleshoot the Citrix logon issues, Kaleb and his team used the standard methods. They made sure they were up to date on any hot fixes from Citrix, scoured forums, and opened tickets with Citrix. All of these efforts failed to yield a result that helped them identify the root cause of the logon issues, and the long Citrix XenDesktop 7.6 logon times persisted.

Solution

The IT Team selected Goliath Technologies because of the broad and deep visibility into all aspects of the Citrix delivery infrastructure. Virtually any IT element that can impact the end user experience is proactively monitored right out of the box.

Goliath shows the logon process in real time and for each end user. For advanced troubleshooting and analysis the logon process is broken down by each of the 9 stages including brokering, virtual machine start, client and server side validation, HDX connection, authentication, group policy, logon scripts, and profile load.

In addition, for each stage the IT administrator can drill down in each stage to get information such as:

  • Domain Authentication
  • Policy Loading
  • Policy Execution
    • Scripts
    • Printer Mapping
    • Fileshare
    • Registry Extensions
    • Powershell
  • Folder Redirection

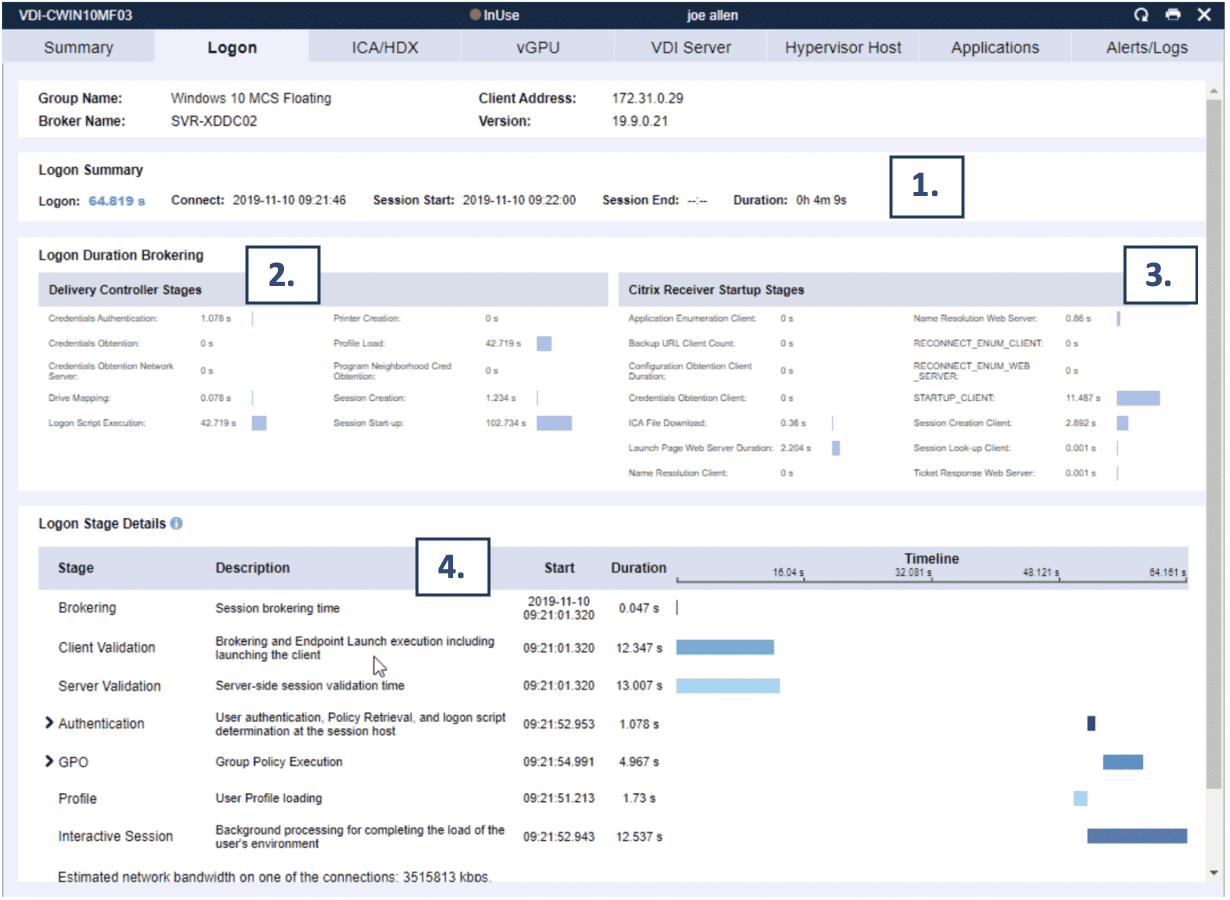
Here is an example of the real time logon duration breakdown screen that Kaleb and his team uses to proactively troubleshoot and remediate slow Citrix logon issues:


(1) The Logon Summary identifies in real-time the actual logon duration time as well as session start, duration, and end time if applicable.

(2) The Delivery Controller Stages identifies where in the delivery controller performance problems maybe manifesting themselves. 

(3) The Citrix Receiver Startup Stages will help identify if there are issues with Receiver that could be impacting performance. 

(4) The Logon Stage Details section of the Logon tab is unique to Goliath Performance Monitor and presents a granular breakdown of the login process by combining all of the logon metrics above in the screen with other information included in the Goliath logs. 

Armed with this real time data, Kaleb and his team were able to isolate the exact stage of the Citrix logon process that was causing the delay. As a result of this drill down they were able to isolate anti-virus software as the root cause. They changed some of the anti-virus settings and logon times improved almost immediately.

With that critical issue solved, they are now able to be more proactive and run cause and effect tests to see how their IT infrastructure changes and how adjustments impact the duration of the different stages of the logon process.

Results

Logon Times Dropped to 20-40 Seconds 

RHC Holdings was able to reduce Citrix XenDesktop 7.6 logon times from 2-5 minutes to 20-40 seconds by using the powerful, purpose built Citrix Logon Duration Breakdown analysis within Goliath Performance Monitor. This functionality, combined with the other key features allow them to proactively manage and monitor end user experience in their Citrix XenApp 7.6 environment.

Independent Review: Agentless vs Goliath’s Intelligent Agent

Independent Review: Agentless vs Goliath’s Intelligent Agent

Editor’s note: this post is from Jacob Rutski, a Citrix Engineer and accomplished virtualization expert who holds specialized certifications for technology products from Citrix, VMware, NetApp, Microsoft, and Cisco. You can connect with Jacob on LinkedIn, Twitter, and through his blog, SeriousTek.

The debate over enterprise monitoring solutions that use agentless technology vs those that use agent software has been around for as long as monitoring has existed, and I’m not going to cover it in great detail as there is nothing new.

Agent Monitoring:

  • Able to gather numerous data points, including those not otherwise exposed
  • Communication can be configured and secured
  • Need to install, maintain an agent
  • Additional software can introduce extra load

Agentless Monitoring:

  • No additional software running
  • Easy to deploy – no software to deploy, update, maintain
  • Not as much data is available via SNMP, WMI, SSH
  • Communication through a firewall can be tricky
  • Still need to configure security
  • Service providing the data (SNMP, WMI, SSH) can introduce load to the system
  • Only able to report data

Enough about that.

Let’s talk about a monitoring agent I’ve been working with: the Goliath Intelligent Agent which is a feature in the newly released Goliath Performance Monitor (GPM) version 11.6. The GPM agent has always existed, but this latest release brings some great additional capabilities.

About the Goliath Intelligent Agent:

  • Able to gather numerous data points, including API integration in the underlying Hypervisor and ICA/HDX metrics not exposed in SNMP or WMI
  • It consumes minimal resources: .1% CPU, 60Mb RAM for XenDesktop, 100Mb RAM for XenApp, and 1.5 Mb on disk
  • Centrally managed install/update, no reboot required for either
  • Able to execute remediation actions on XenApp Servers, XenDesktop VDI, Citrix Role Servers, Infrastructure VMs, and endpoints
  • Template/Gold image (PVS/MCS) ready
  • *Able to monitor local or remote devices using agentless technologies (SNMP, Syslog)
  • *Improved scalability by communicating remote agents through ‘master’ agents rather than directly to the GPM server
  • *Specific agent groups can be federated for different purposes – network device agents, hypervisor integration, Windows Server agents
  • *Consolidate agent outbound communication to the central server

*New or enhanced features

Metrics Collected by Goliath’s Intelligent Agent

The Goliath Intelligent Agent is able to collect the following metrics:

Windows resources:

  • CPU, CPU queue length and context switches
  • Memory and paging metrics
  • Disk metrics – queue length, disk latency and IOPS
  • Network metrics including retransmits
  • Event log collection and analysis
  • Service monitoring
  • Application performance analysis
  • Windows Services
  • Custom Scripts like Powershell to collect metrics
  • Custom PerfMon counters

Application resources:

  • Application process performance – CPU and Memory Utilization
  • Application specific faults
  • Application services
  • Log file analysis
  • Custom scripts
  • Network and device metrics via SNMP & Syslog
  • Custom alerting

Nothing like the EdgeSight Agent

I will tell you right now that Goliath’s Intelligent Agent is nothing like the Citrix EdgeSight agent. There is no local Firebird database to house the data; the GPM agent consumes far fewer resources.

GPM offers the best of both worlds – it is also able to monitor devices where installing an agent is not possible; previously, agentless data gathering was initiated from the central server.

The best part?

All of the different roles and features are available from the same agent software that gets deployed, managed and updated from the central store without having to reboot the endpoint.

The new Goliath Performance Monitor Intelligent Agent can act like another GPM server, allowing you to use agentless technologies such as SNMP and Syslog to gather data in a branch office as well as pass data from other installed agents on to the central server – all while giving you the ability to view all of the data in a single, unified dashboard.

Branch Office Scenario

goliath-technologies-master-intelligent-agent

In the diagram above, you will notice that the remote office has infrastructure to be monitored as well as a ‘master’ Intelligent Agent.

This allows you to not only aggregate all monitoring traffic to the central server to come from a single point, but also to monitor all non-agent systems locally to that office without having to cross a WAN or firewall. All of the remote office data is presented in the same dashboard – no more guessing is it ‘http://monitorServer01’ or is it ‘http://monitorServer02’?

The remote intelligent agent also provides the ability to execute remediation actions and scripts ‘from the outside’ of the problem – again, without having to cross a WAN/firewall. Also keep in mind that the metric data is aggregated in real time – any batching or queuing could potentially lead to missing a problem or lost analytics.

Are you ready to consolidate all of your monitoring servers and dashboards into one? Learn more about Goliath’s Intelligent Agent.

About the Author: 

The team members collaborated to bring together this blog post by calling on their past Customer Experiences and Expert Knowledge of Citrix Troubleshooting. Beyond writing technical documents this team supports Goliath Customers and provides product feature and function guidance to development.

vSphere Monitoring Improves Time to Resolution for Grace Mayer

User Story: Proactive vSphere Monitoring Improves Time to Resolution for Grace Mayer

grace-mayer-goliath-technologies vSphere

“For over 10 years I’ve monitored my entire infrastructure with Goliath Performance Monitor, which includes VMware vSphere monitoring. I meet with many companies and vendors in my daily activities and I believe this product provides the best overall combination of features and functionality. GPM is the best value I have seen.”

– Jim Vigotty, IT Manager at Grace/Mayer Insurance Agency

The Business Challenge

Eleven years ago as a newly hired IT Manager, I did an assessment of the IT infrastructure, which included how we monitor VMware vSphere, for which I was now responsible. One of the key areas that I targeted was the automation of our vSphere monitoring.

My goal was to procure a vSphere performance monitoring solution that would allow me to accomplish my goals of capacity planning, predictive failure analysis, troubleshooting and automated remediation. Without adequate technology, these goals are either impossible or very time-consuming and, as a result, I would be in danger of breaking one of my key IT Rules: Thou shalt be the first to know if a system goes down.

The chosen technology had to have the ability to capture adequate data from disparate VMware vSphere servers and work stations and present the vSphere metrics in such a way that they were actionable. Furthermore, the vSphere performance monitoring functionality had to be both deep and flexible enough to allow me to set thresholds that alert and/or initiate fix actions. Finally, the cost of the required functionality needed to fit within a tight budget.

The selection criteria, though straightforward, proved to be a challenging set of requirements for vSphere performance monitoring vendors. I evaluated a host of free ware products as well as HP Openview, Tivoli, Kaseya, SolarWinds, and Goliath Performance Monitor for monitoring vSphere and the rest of my infrastructure. During the course of our evaluation, we disqualified products for one or more of the following reasons:  ease of use, functionality, scalability, flexibility, or cost.

The Solution

We selected Goliath Performance Monitor for vSphere performance monitoring because the solution has the best combination of my key criteria for vSphere performance monitoring. I believe that first aspect was noticed with the ease of installation and configuration. The preconfigured VMware vSphere monitoring rules allowed me to easily begin proactive VMware vSphere monitoring.  

I was able to customize my trending reports, alert notifications, and filtering events so that I received essential information and not the “noise.” Then I set up event triggers that would send e-mail and text notifications so I was aware of any potential issues and initiate automated recovery actions so that I could manage these critical events immediately without human interaction. I have Goliath Performance Monitor send me both, as I want the immediacy of a text message and the history of the email notification for my logs.

The Result

I was able to automate my system monitoring because of Goliath’s deep understanding of key metrics to monitor within the infrastructure. The technology comes with out-of-the-box monitoring rules and alerts so they took most of the guesswork out of installation and management. The ease of use, functionality, scalability, flexibility and cost of the Goliath Performance Monitor provided us with the most comprehensive tool, for the best value, we found in the marketplace, which is why we selected Goliath Technologies.

About Grace/Mayer Insurance 

Jim Vigotty, IT Manager at Grace/Mayer Insurance Agency, Inc, is responsible for monitoring the entire IT infrastructure.Grace/Mayer is one of leading independent insurance agencies in the Midwest. The agency’s foundation, since 1917 has been providing Property and Casualty, Employee Benefits, Financial and Estate, and Personal insurance business services. While we are proud to be locally owned and operated out of Omaha, Nebraska, we provide coverage for clients throughout the United States, as well as internationally.

Try a Fully Supported 30-day Free Trial of Goliath Performance Monitor

To see if Goliath is a good fit to consolidate your monitoring tools, reduce costs and improve remediation time, get a fully supported 30-day free trial of Goliath Performance Monitor today. 

    Do you think Goliath can add value to your organization? Reach out.
    Email us at  techinfo@goliathtechnologies.com or schedule a demo, consultation or free trial.

    Independent Review: Goliath Logon Simulator for Citrix

    Independent Review: Goliath Logon Simulator for Citrix

    Independent Review: Goliath Logon Simulator for Citrix

    Editor’s note: This post is republished on our blog with permission from Wilco van Bragt, CTP, CCEE, CCA & Microsoft MVP on RDS. The original post appears here on Wilco’s blog.

    Any system administrator has encountered this situation at least once–arriving to the office in the morning and at the entrance you are already told that users cannot logon to Citrix.

    When you are at your desk you quickly identify the issue and solve it as well. However, not everyone is happy about the fact that this was not noticed and solved proactively before users were actually starting with work.

    Since you cannot simulate the whole user logon process at the moment, it is difficult to be proactive in this kind of situations. In this article, I will show you how the Goliath Logon Simulator for Citrix can proactively solve this situation.

    Goliath’s Logon Simulator is integrated within the Goliath Performance Monitor (GPM) suite, but is also available as a separate product. Using it in combination with GPM offers the biggest added value, as you also have lots of insights about the sessions and the health of the Citrix infrastructure.

    Not a Regular Monitoring Tool

    Goliath Performance Monitor’s main focus is monitoring the Citrix XenApp/XenDesktop infrastructure and components that are directly related, like the hypervisor and the network. Because of this focus, the product offers more insights into the Citrix components than regular monitoring products.

    The Goliath infrastructure (depending if you are using the suite or the stand-alone product) consists of four components: a SQL database, a Goliath server, agent on the Citrix XenApp/XenDesktop servers and the Logon Simulator software.

    The Logon Simulator Installation Process

    The installation of Goliath Logon Simulator is pretty straight forward. Reminder that .Net Framework 3.5 SP1 currently is required. The SQL database can be the embedded SQL express (recommended for Proof of Concepts), or a local or remote SQL server.

    goliath-performance-monitor-set-up

    For the Logon Simulator you want to install the agent on the XenDesktop Delivery Controller (or XenApp Data Collector for 6.5 environments) and the RDS/VDA hosts.

    To use the Logon Simulator, the Goliath Intelligent Agent is also required, so that is step one for that component. The installation of the Logon Simulator component is currently a manual task.

    It would be nice if Goliath can make an installation package for that. However, the installation steps are not difficult at all and are well documented by Goliath. The Logon Simulator has some dependencies, so check the document thoroughly (IE11, Citrix Receiver 4, specific Trusted Site settings).

    Configuring the Goliath Back End

    Logically for the Logon Simulator, you need to have the Citrix XenDesktop infrastructure within the scope of the Goliath product, so follow the instructions to add a XenDesktop site within the Goliath product. It’s important that a Delivery Controller is configured as the XenDesktop Broker Controller within the software Suite and that the XenDesktop VDAs have a Goliath agent installed.

    enable-goliath-logon-simulator-for-citrix

    Configuring the Logon Simulator

    Now we can start configuring the Logon Simulator. A monitoring rule needs to be created for each machine you would like to run a Logon Simulator on. This can be accomplished by doing the following:

    • Go to the Configure tab and select ‘Monitoring Rules’
    • At the bottom of the rules page, select ‘New’ and then choose ‘Citrix Logon Simulator’
    • This will bring up the pane in which you configure the simulations.

    You will need to specify:

    • The URL for NetScaler, StoreFront, Web Interface, that the user would access to launch the desktop or application
    • The user account information for starting the session
    • Which Desktop or Application will be launched
    • Specify the tab/folder path where the Desktop/Application can be found, if applicable.
    • If using Goliath Performance Monitor, it’s also a good idea to configure the Web Logoff field to be at least 120 seconds. This is so the agent can capture additional session metrics.
    • From the server tree, you select which machine the simulations will be executing on. This is the machine that was prepared with the Logon Simulator prerequisites that were mentioned earlier.

    In addition, you can specify how often the simulations will run on the Schedule tab. On the Notifications tab, you can specify how you would like to be alerted (e-mail, SMS text, SNMP, Syslog, etc.). I will go into more details about Remediation shortly.

    goliath-logon-simulator-monitoring-rules-configuration

    For those of you working with the latest Storefront, version 3.0, the Goliath Logon Simulator supports it. What is really cool is that the Logon Simulator automatically detects if the connection is set-up via a NetScaler Gateway, StoreFront or Web Interface.

    I even created my own disclaimer in the Web Interface and it was automatically detected. In my opinion, this is a big plus for the Logon Simulator as even a small change in the portal environment does not mean that you need to change anything in the Logon Simulator.

    Logon Simulation in Action – The Basics

    After the simulation test is scheduled within Goliath Performance Monitor/Logon Simulator, the results are shown from the Logon Simulator tasks. Via a simple green/red line, you check which tests succeeded and which failed.

    The real value is clicking the details option, which shows the exact steps executed, and logically, a point that caused the failure.

    goliath-logon-simulator-identify-failure-points

    To get more insight about what happened in the past with the test, there is also a report available showing all Logon Simulator tests with the same results and details.

    We configured Notifications to inform us when a test has failed as well. However, you don’t need to troubleshoot anymore because you already know where the issue is arising by the extensive logging of the Logon Simulator. You can respond directly and carry out tasks to ensure the environment is available again.

    The nice thing about combining the Logon Simulator for Citrix with the Goliath Performance Monitor suite is that you can compare the results of the Logon Simulator user with actual users who are logging on to Citrix XenApp and or XenDesktop.

    Some good examples are the logon time reports and insights in ICA latency. These insights are especially useful when users are mentioning issues.

    Logon Simulation in Action – The Next Step

    With the notification functionality, we can respond quickly to incidents where we can solve the issue before end-users experience the same behavior. However, it would be even better if Logon Simulator can already execute tasks.

    To make the Logon Simulator for Citrix really proactive, Goliath has options to automatically execute remediation actions. This can be configured in the Remediation tab of the Logon Simulator monitoring rule.

    While there are many remediation actions that are out of the box, you can create your own custom remediation actions or have Goliath Care do it for you. For example, one customer is running a Logon Simulator for every XenApp server, and when that server does not respond as expected, the server will be placed in a drain mode.

    Useful Insights about ICA Latency, Connection Performance, and Bandwidth Usage

    goliath-logon-simulator-ica-latency-bandwidth-reports

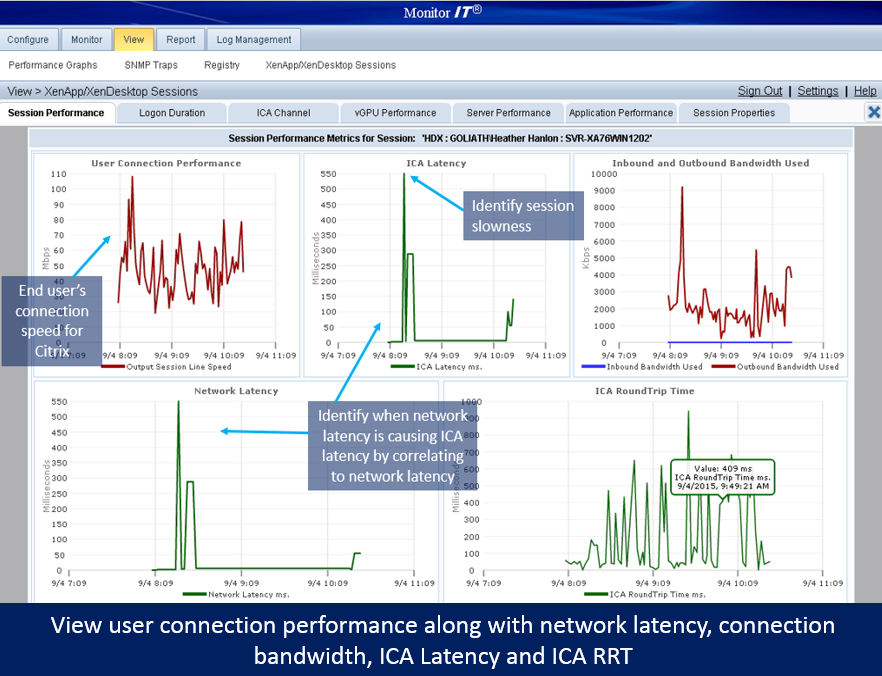
    Combining the Logon Simulator together with Goliath Performance Monitor offers lots more than only Logon Simulator. Goliath really focuses on the Citrix client and the Citrix VDA, providing lots of useful insight like Connection Performance, ICA latency, network latency, bandwidth usage, virtual channel usage, and client version.

    goliath-logon-simulator-ica-latency-troubleshooting

    Conclusion of the Logon Simulator Review

    The Goliath Logon Simulator for Citrix XenApp and XenDesktop is an easy to implement solution to ensure that your end-users can logon to the Citrix infrastructure.

    It’s powerful because the solution works with any connection methodology without making changes to scripts or something similar. By using the intelligent remediation, the solution is really proactive. It would be nice if the installation and remediation would be more integrated within the product, but Goliath is already working on those enhancements.

    The Logon Simulator is definitely an added value for Citrix infrastructures and provides lots of insights between the endpoint and Citrix infrastructure in combination with Goliath’s Performance Suite features.

    To try the Logon Simulator in your own environment, download a fully supported 30-day free trial or request a personal demo. Also, you can see the Goliath Logon Simulator live in action during a free webinar on December 2nd, How to Proactively Prevent Citrix Logon Issues & Improve the Citrix End User Experience.

    Guest Post: How VMware Can Improve vRealize EUE with Goliath

    Guest Post: How VMware Can Improve vRealize EUE with Goliath

    Guest Post: How VMware Can Improve vRealize End User Experience with Goliath

    This post is republished on our blog with permission from Rob Beekmans, vExpert, CCEE, CCIA, VCP5, VCP5-DT & VCAP-DTD. The original post appears here on Rob’s blog, EUC, UEM, Mobility and Monitoring.

    In this article I will discuss why I think it is important for vROps to become a more open monitoring platform so I can use it to monitor my entire environment including non-VMware infrastructure to proactively improve the end user experience.

    I love vROps and want to do more with it. This blog describes one way to achieve that goal.

    Useful Data in a Single Console

    Important in monitoring, those who read my articles know this by now, is to get the right information and preferably from one console. You don’t want too many consoles where you, as an admin, are combining info from all of them leading to false positives or worse.

    What do you want to see when you look for a monitoring product?

    • Visibility in some kind of layering (Hypervisor, VM’s, OS, Applications, physical server);
    • Monitor all products from one console (VDI, RDSH, storage, network etc.);
    • Monitor all hypervisors from one console;
    • Send metrics to current monitoring products or receive metrics you need.

    Ideally you monitor with one product only, I haven’t seen that yet but it would be utopia.

    Many Enterprises have monitoring in place – CA, HP OpenView, BMC, IBM or anyone I forgot here. Optimally you would want to feed these products with information, again to add to the central console idea.

    These enterprise products, however, allow other monitoring solutions to fill these “gaps” by allowing information to be pulled through API’S or using syslog or SNMP traps. This is really important because no enterprise monitoring solution covers everything equally well.

    Monitoring Everything Outside of the VMware Stack

    I think vROps can do the same thing and I think they should. You could use vROps to monitor everything outside of the VMware stack including Citrix XenApp, XenDesktop, network elements, applications and even physical IT infrastructure elements. VMware is almost there. Think about it.

    VMware already has a clean interface that could easily suit as the central interface to monitor your environment. From a vendor monitoring solution, vROps is one of the most complete solutions on the market, it monitors many aspects of the virtual environment and you can add management packs and extensions to extend it.

    It is focused on resource management, giving insight into how your desktops are performing. Many default dashboards and reports complete the product. So far it’s all good.

    vcenter-operations-goliath-technologies

    Two Key Issues with vROps: EUE & E2E

    VMware vROps has two issues in that it doesn’t understand the environment from an EUC perspective and it doesn’t do E2E monitoring. Both “issues” are close neighbors, for one would help the other and they relate to monitoring limitations I mentioned above since vROps doesn’t monitor anything beyond the VMware stack.

    First, if we look at E2E you need to monitor outside the VMware stack and you need to take into account that e.g. DNS is a factor in the service delivery of the desktop. Not many products have that ability, most products monitor a specific set of components. vROps is no exception.

    VMware could create a dashboard where the Citrix monitoring can be combined with the other management packs so that you could create your own E2E dashboard. Seems pretty easy to me. If we look at EUC we see something else.

    Second, if we look at EUC we see something else. vROps monitors from a VMware point of view leaving out important metrics that really show the user performance. You can’t measure user experience from looking only at resources! The only way to measure the user experience is to measure what the user is actually doing. Simulated user logon this is called.

    Measuring with simulated user logon would solve a part of the missing E2E part. If you work like a user you will test a lot of components that make up E2E.

    Simulated User Logons & Real User Experience

    Simulated user logons would show the real user experience, add that to vROps and the overall color of the VDI environment would really show the performance. Of course, this is pretty hard to get into the product for it would need to know what is added and take that into account. They could add a new option in the dashboard to show metrics related to user experience.

    Metrics like:

    • Logon Failures
    • Logon Failure Alerts
    • Logon time
    • GPO load time
    • Profile Load time
    • Break down of connection steps (broker, starting client, etc.)
    • Root cause analysis.

    VMware has no option to do this. There is only one product in the market, Goliath Technologies Logon Simulator, that both simulates logons, exercises the whole desktop delivery infrastructure and can also tell you where the root cause of any issue that impacts EUC experience because it is truly end to end. The question is why can’t they deliver this data to vROps?

    There are other products like Horizon View logon and LoginPI that come to mind instantly. The issue with these is simply that they don’t exercise the whole virtual desktop delivery infrastructure and, because they are not a feature in a full enterprise monitoring product, they can’t determine the root cause of the issue.

    Integration that Makes Your Life Easier

    I’m going back to my last articles about Goliath, they integrate with VMware vSphere vCenter so that you can combine information gathered from both products. This makes managing an environment so much more complete.

    I included some screenshots I borrowed from Goliath to show to data you can gather that makes your life easier. I could have taken these screenshots also from other monitoring vendors for they also add value to VMware vSphere vCenter monitoring.

    The point is that with integration you add value, suddenly they are not two products running side by side, they are products making a suite adding value for you.

    vmware-performance-graphs-goliath-technologies

    A Solution to Gain Visibility into the End User Experience

    With VMware vROps being closed, or so it seems, when you have vROps running you will need another monitoring product to monitor your virtual desktop environment to get the user experience. This to me seems like something that could be improved.

    My idea with this would be to add a segment in the VDI dashboard that would allow external parties to add metrics. It would not hinder the current dashboards and metrics but would get a nice place in the dashboard for customers to add if they want to. I talk to many customers about this, user experience monitoring and end to end visibility, and that’s what they are looking for.

    So VMware could you please, pretty please open up vRealize Operations Manager to allow other monitoring vendors to add more value to your product? You can name it Project V8 – Putting power in your vROps.

    Lastly, I encourage you to watch an on-demand version of a live webinar focused on improving the VMware end user computing experience by gaining visibility into Application & OS performance data in addition to VM, Host, and Hardware to proactively remediate issues before end users are effected.