
Citrix & Epic EHR Failure Prevented Before Impacting 25,000 Users at Health System

Citrix & Epic EHR Failure Prevented Before Impacting 25,000 Users at Health System

How We Did IT

Citrix & Epic EHR Failure Prevented Before Impacting 25,000 Users at Health System


epic ehr failure

“Last week we were able to resolve a Citrix XenDesktop issue before end users were impacted. The Goliath Application Availability Monitor for Citrix and VMware Horizon identified that Epic was not available at 4:30 a.m. ET. Our IT team received a real-time alert that the main application failed to enumerate, which would have impacted 25,000 users if not resolved.  Because of Goliath’s advanced warning, we were able to resolve the issue before any users reported the problem to the help desk.”

– Senior Citrix Escalation Engineer


Infrastructure

VMware, Citrix XenApp, Epic Hyperspace, Cerner


Challenge

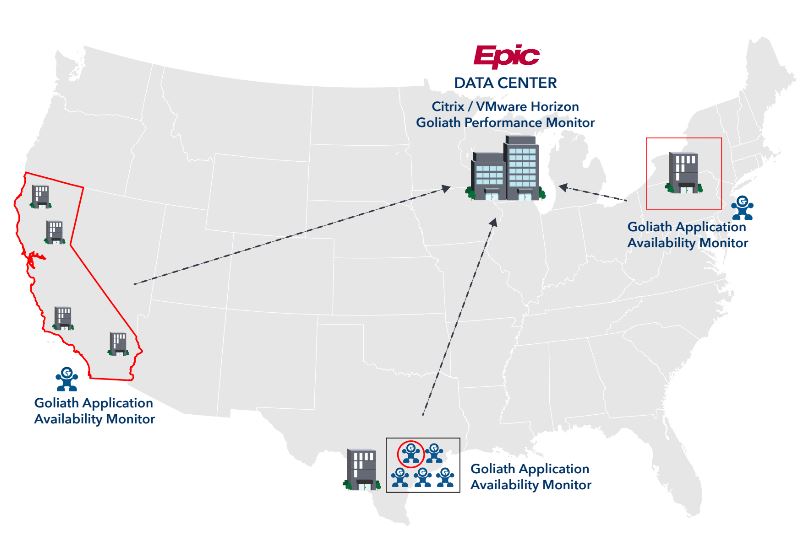
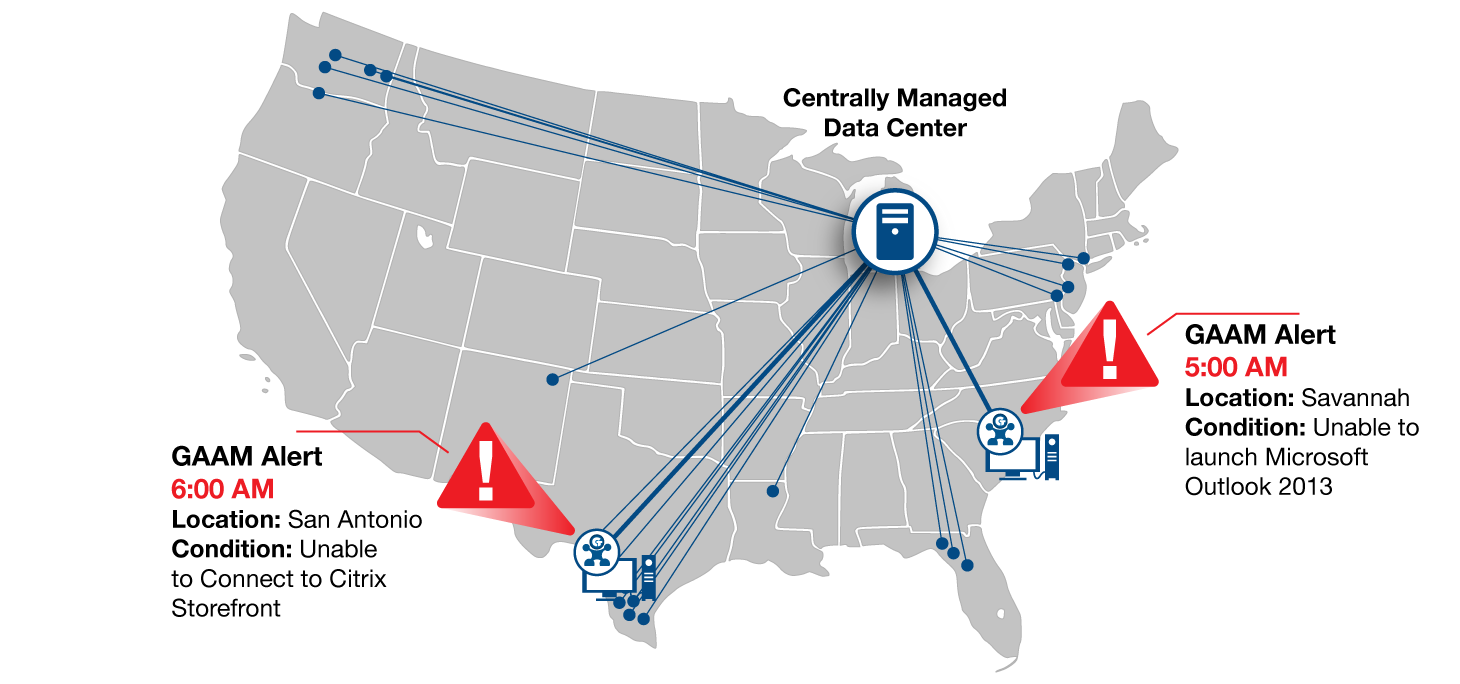
The Citrix XenApp and XenDesktop teams often received complaints related to Citrix XenApp and XenDesktop availability from their end users. Specifically, physicians and nurses who were connecting from remote hospitals and facilities could not launch their Epic Hyperspace application. The Citrix IT Team deployed the Goliath Application Availability Monitor to remote hospitals, which features the “Goliath Virtual User”– a low footprint software that is managed from a central console and logs on to Citrix XenApp and XenDesktop & Epic just like real users. This ensures that the Epic Hyperspace and Citrix applications are available and that the Citrix delivery infrastructure and workflow are functioning as they should. It is like having a real Citrix administrator at the hospital whose sole job is to logon to Citrix XenApp and Epic Hyperspace before users, and then call IT to alert them of any issues so they can resolve before users are impacted. See below the deployment architecture which shows the remotely deployed “Goliath Virtual User.”

Epic Deployment 2

Solution

Averting an Outage for 25,000 Users

The Epic Hyperspace application had recently been upgraded. When the upgrade was complete, the app was tested and made available for consumption by end users. However, during the upgrade, there was a misconfiguration of the application that Citrix admins were not aware of at the time.

The Citrix team had configured the Goliath Application Availability Monitor for Epic to alert them if there was an issue with a Citrix-delivered application, as part of the early warning system designed to troubleshoot Citrix in advance of end users experiencing performance issues. The Goliath Application Availability Monitor, and “Goliath Virtual User,” was scheduled to run and test all critical applications every 15 minutes daily, including the Epic application that was just upgraded.

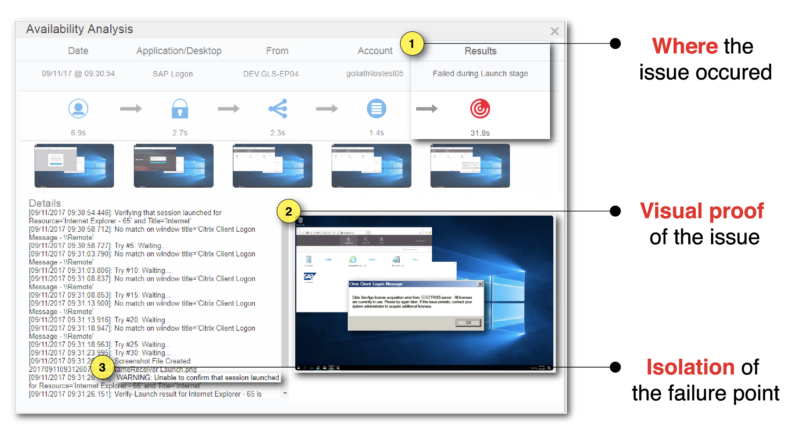
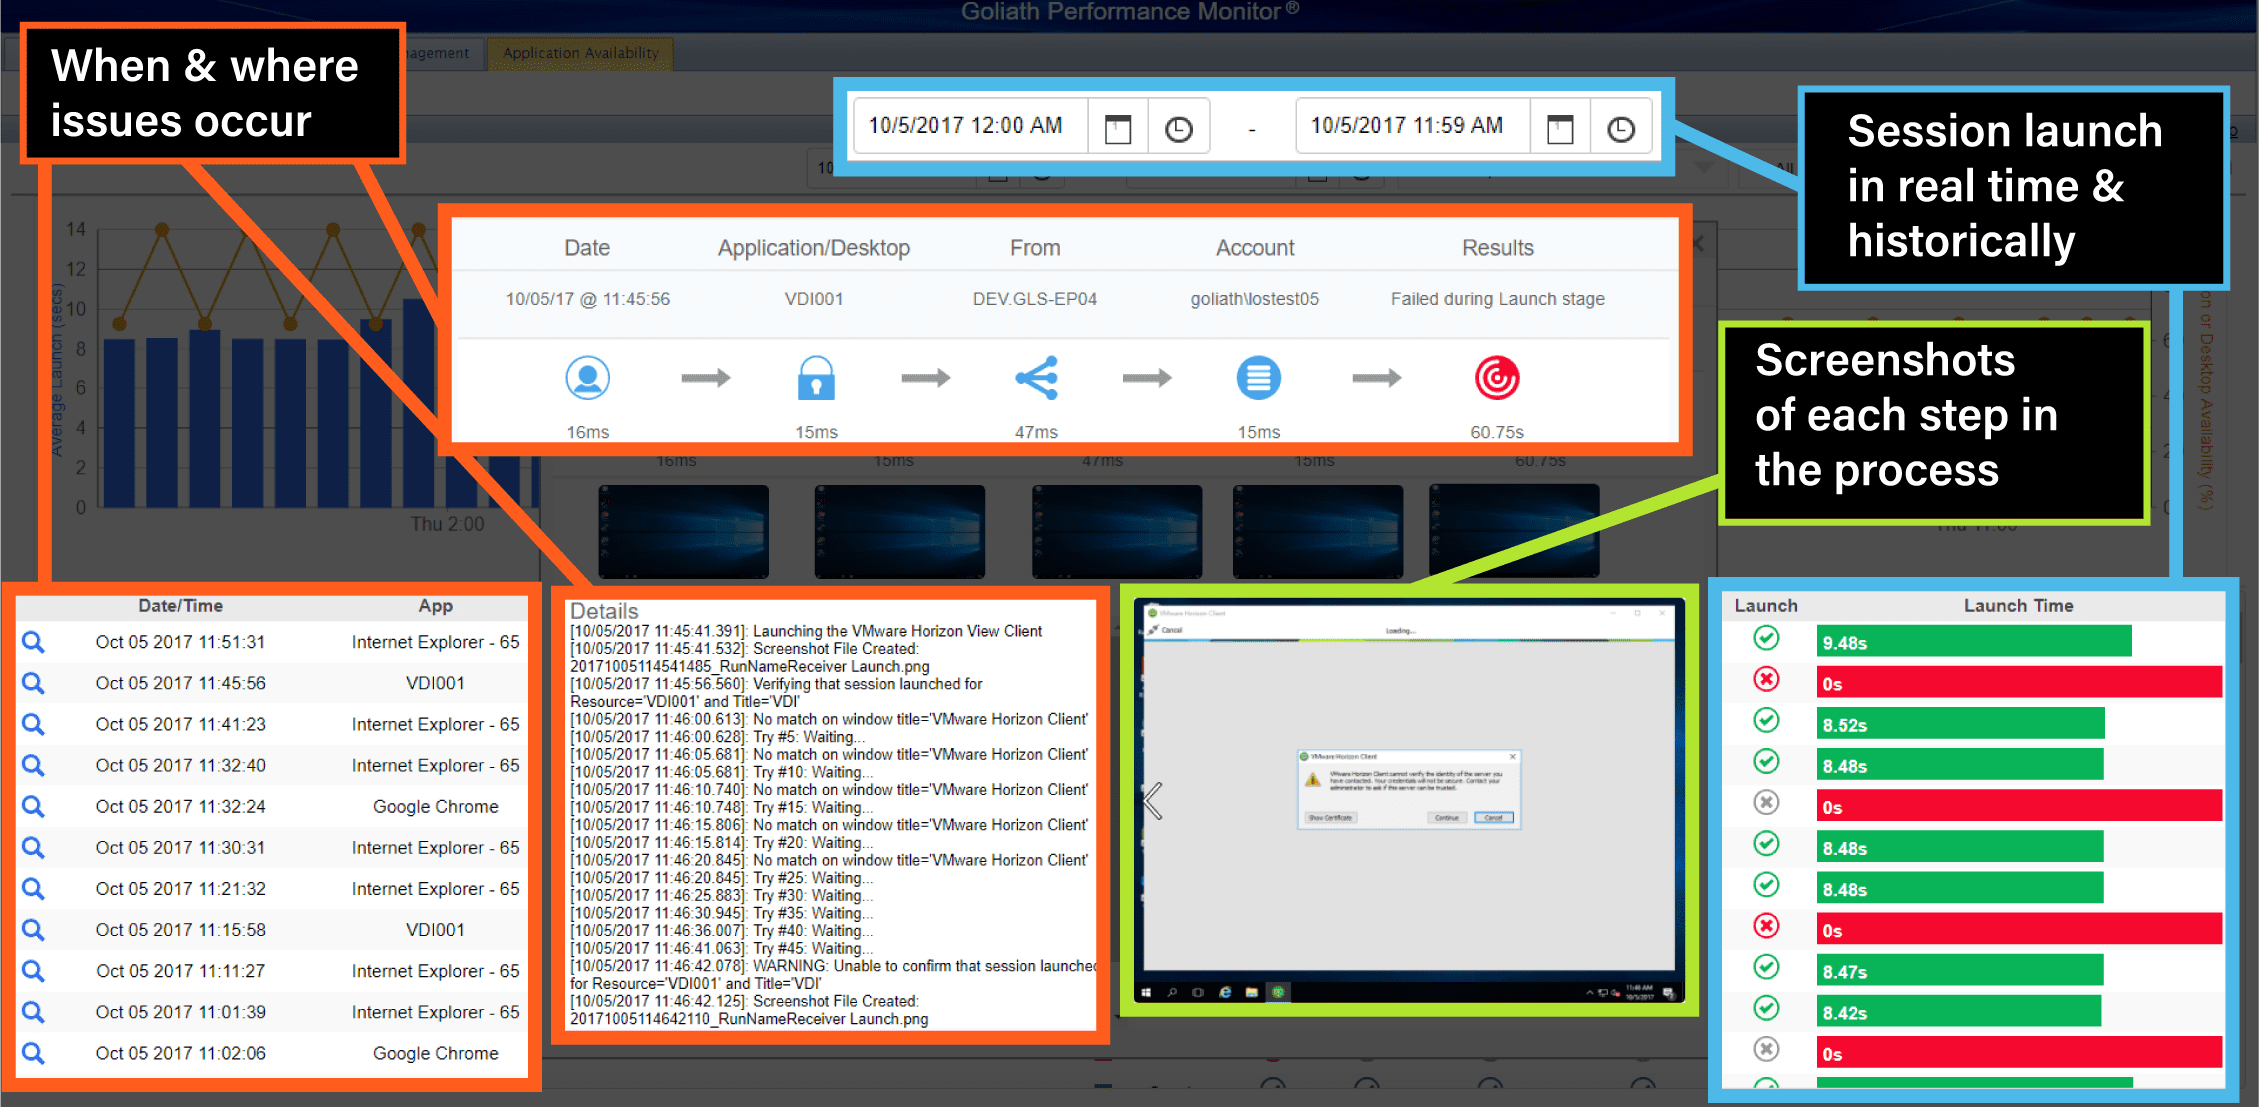
On this day, the Citrix XenApp and Citrix XenDesktop team was sent a real-time alert at 4:30 a.m. ET, that Epic Hyperspace was not available at several hospitals. From the real-time dashboard, it was apparent that failures were occurring from many sites with multiple different Goliath User admin accounts. This allowed IT to know in an instant that there was a global outage of the Epic application that was just updated. From the application availability detail of each failed simulation, the failure point was identified. In every failed instance, an enumeration issue was discovered as the root cause and there was a picture to prove what the issue was in the “screenshot” analysis. As a result, the application icon was not displayed on the web interface page, as seen below in this screenshot from the actual software that identified and alerted to the issue in real-time.


Epic Deployment 2
Epic Deployment 2

Results

Now, the IT team receives an advance warning if Epic Hyperspace and Citrix will not launch, or is slow, before physicians and other healthcare workers log into Citrix XenApp or Citrix XenDesktop for the day. The advance warning, via real-time alerts, gives the IT team peace of mind because they know the early warning system will give them time to troubleshoot Citrix and resolve the performance issue before users are impacted. They now use the new “screenshot” analysis (in the image above) to document, via pictures and metrics, the “true” root cause and put fix actions in place so the issue can be permanently resolved.

Finally, the IT team can communicate more effectively with management, counterparts in other departments and their application vendors because they have objective evidence of application availability, performance, and details relative to the root cause of performance or availability issues. They also can document when, with this advanced warning capability, they saved the day! And, saving downtime that would have impacted 25,000 users is the definition of saving the day.

How to Improve Your Citrix Deployment by Monitoring Pilot Phases

How to Improve Your Citrix Deployment by Monitoring Pilot Phases

By Jacob Rutski, Sr. Architect at Citrix


We all want seamless rollouts of Citrix XenApp/XenDesktop and we use a number of tools to achieve that reality. I have found a unique software that allows me to proactively understand the performance impact of Citrix XenApp/XenDesktop on the IT infrastructure and ultimately end user experience early in the Citrix deployment lifecycle.

In this post I will show you four examples of how I use the software to avoid potential issues.

VDI Deployments

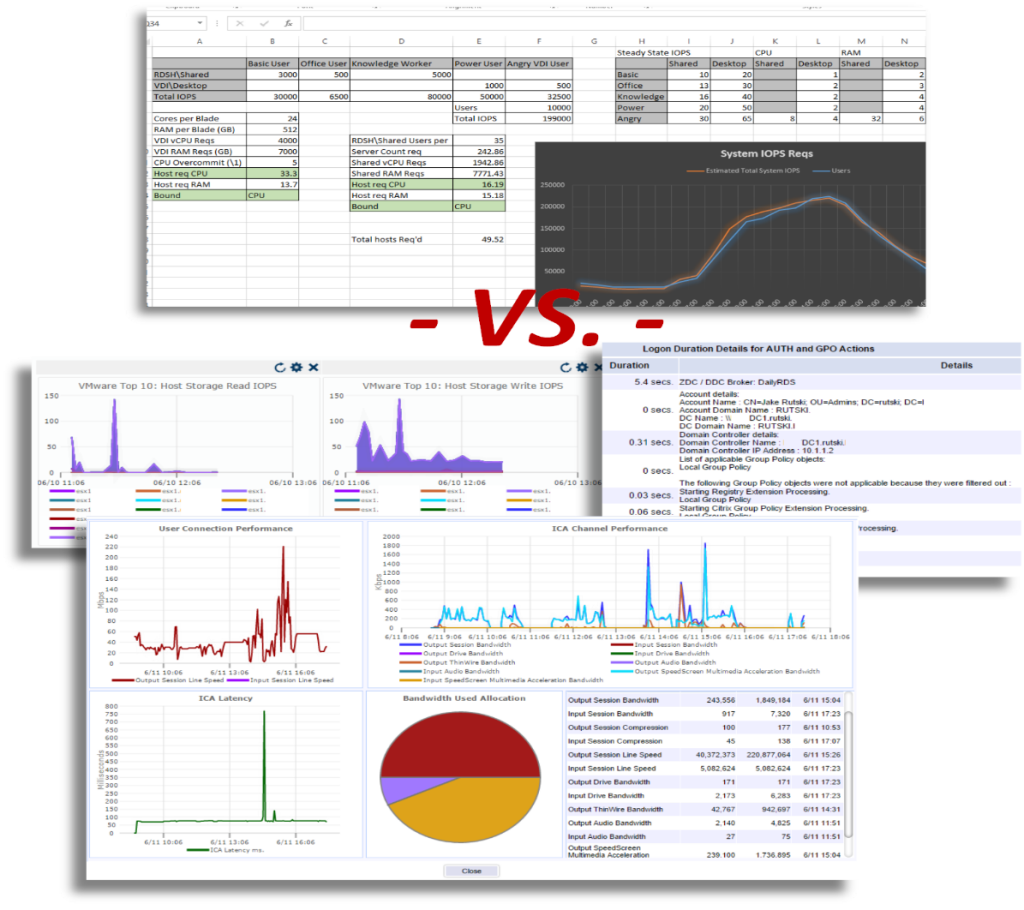
When large VDI deployments are being designed and architected, lots of numbers get tossed around from computer requirements, storage capacity and IOPS, to user count, application set and type of user. Most integrators will use some form of a spreadsheet tool or assessment to gather user data, compile it all and generate some reports that try to estimate requirements for the environment. For the most part, this is fine – for just that – estimation. What I am going to discuss is manual vs. purpose-built software.

Once the project gets underway and things start coming together, the first item on the list is usually testing by a small group of pilot users in the technology group. Then another business unit, usually close to the IT group, is allowed access to test. Then another. Once a few groups of test users have given their blessing on the pilot environment, it is rolled into a full production, highly available, high-performing (hopefully) infrastructure.

And the last step is usually the scariest – the floodgates are opened and a large population of staff are migrated into the environment…here’s to hoping it goes well. But there can be some problems with this procedure; a monitoring product that can actively monitor the performance of the overall environment as well as actively test logons should be deployed from day one to not only avoid potential issues, but also to accelerate the Citrix deployment and help guarantee successful project completion. The Goliath Performance Monitor (GPM) paired with Goliath Application Availability Monitor for Citrix is such a product.

Problem 1: Not all monitoring solutions are created equal

A monitoring solution that only uses SNMP, WMI, and NetFlow is not a monitoring solution that I would consider capable of watching over 10,000 desktops on top of a hypervisor, on shared storage and networking in the datacenter. A proper tool must integrate and gather data directly from all layers in the environment – including the hypervisor, the computers, and the software orchestrating thousands of connections every day.

Monitoring tools that are built to monitor networks and Windows servers may not be capable of knowing which counters to use or how to integrate with Citrix specific APIs to align Citrix session behavior and performance with infrastructure conditions. Furthermore, technologies dependent on wire-data have no facility to provide the needed information because they have no mechanism to leverage the APIs or context from where the sessions take place – the servers.
Having the ability to understand, monitor, report and alert at every layer of a complex deployment empowers technology staff to know exactly what is going on in the VDI environment, when there is an issue, and where to start troubleshooting. For example, one can troubleshoot slow session performance by digging into the ICA Channel.

Troubleshoot ICA/HDX Channel Performance

Goliath Performance Monitor is Citrix Ready and VMware Ready for the hypervisor as well as XenApp/XenDesktop and VMware Horizon – this means there is direct integration with these products and their APIs to gather direct and accurate data.

SNMP simply does not allow for this deep integration and data gathering. See below – Goliath Performance Monitor has out-of-the-box performance graphs to gain full visibility into the hypervisor and VMs trending over time.

Many small IT groups are often in ‘catch-up’ mode where it is hard to get ahead; they are constantly fighting fires, cleaning up the network, and trying to stay ahead of the next hardware failure or management request. IT managers will say “let’s not fix tickets as they come in, let’s resolve the issue before the users are aware of it.”

When consultants are hired to deploy a new solution, staff are often left with little knowledge about the new system and may not know where to look to begin troubleshooting. In the case of larger organizations, trying to implement a monitoring tool to troubleshoot a pre-existing performance issue will prove difficult. Having performance data from day zero will allow staff to go back through history and see exactly when the disk latency went above 30ms average, or when the hypervisor host CPU became so overcommitted that the CPU wait times rose above 500ms.

Problem 2: Project designs use estimates for computers and storage

Estimating the requirements for any virtualization project is difficult – especially when you are talking about thousands of end user desktops in the datacenter. Designs for these projects are estimates – and estimates are not always completely accurate. If a design calls for 300,000 IOPS for desktops, oftentimes the budget may not allow for much more than that. The problem comes when a boot or logon storm happens during 50% system load and consumes all available storage I/O.

All the users on the system just saw an hourglass or saw their session hang because the storage latency is well above the acceptable 5ms average. These problems don’t show up during the pilot phase when there is only 2-5% test load. Once the project is half way completed, it is too late to order more hardware due to under-spec’d designs.

If storage is not designed properly, you may end up with very high average datastore latencies – GPM will show this:

Hopefully it can be addressed before users begin complaining about terrible performance.

Problem 3: Changes break things

The natural progression of any large deployment requires a great deal of work and most of that work is making changes. Any of the normal steps in a project have the potential to disrupt – adding capacity by deploying more servers, changing SSL certificates, changing security or permissions – all these changes can go so far as to completely bring down the environment.

Additionally, changes during a proof-of-concept or initial deployment may not be run through a change control, making them difficult to track and even harder to determine if a change is the true cause of an outage. The dreaded Citrix StoreFront ‘Cannot complete your request’ error can rear its head when changes are being made to StoreFront or the NetScaler Gateway configuration.

The Goliath Application Availability Monitor will detect this issue immediately. By having a monitoring tool running from the beginning of the project, you will be alerted immediately if the most recent change broke remote access or crippled performance. In the screenshot below, GAAM is alerting us that application was not found:

Pinpoint Application Failure

The Goliath Application Availability Monitor will detect this issue immediately and alert you that the StoreFront resources were not found.

By having a monitoring tool running from the beginning of the project, you will be alerted immediately if the most recent change has broken remote access or crippled performance. Even more taxing to the system is the ‘ramp-up’ period when more and more users begin to logon to the system – if it was not designed correctly, you need to know as soon as possible, and a static design guide spreadsheet isn’t going to do that for you.

Problem 4: Technology staff are not always the best test users

The pilot phase or proof-of-concept deployment gets started with some small percentage of users testing the environment – usually the technology group and associated support staff. This leads to the first problem: Most technology staff don’t see issues and bugs as a big deal.

It’s similar to alarm fatigue in the healthcare industry – the IT staff are always so busy resolving issues or responding to production problems that a warning message in the proof-of-concept environment is not that big of a deal. It is also difficult for technology staff to ‘eat their own dogfood’ – when they have so many other means to get work done, it may be difficult to convince them to use the unproven pilot environment.

Using the monitoring tools by Goliath Technologies will allow deep insight into an otherwise complex and overwhelming environment. By setting up the GPM at the beginning of the project you will have historical data to help determine if the sizing and design of the infrastructure is up to par and allow you to troubleshoot any “growing pains” during the project ramp up that would otherwise lead to delays.

To try all of this in your own environment, get a 30-day free trial of Goliath Performance Monitor or Goliath Application Availability Monitor for Citrix by clicking the link below.

 
Goliath vs. Citrix Comparison
Maintaining a Healthy VDI and Virtualization Environment

Maintaining a Healthy VDI and Virtualization Environment

Three Secrets to Maintaining a Proactively Healthy VDI and Virtualization Environment

Maintain Your Visual Infrastructure

I’ve had the chance to work in the cloud, virtualization, and application delivery industry for quite some time. The most amazing thing I’ve seen has been the evolution around delivery technologies specifically aimed at improving user experience and performance. Still, with varying operating systems, evolving desktop environments, and the constant challenges around applications – there’s still one major challenge when it comes to these ecosystems. Specifically, I’m constantly finding administrators battle the challenges around complexity.

Director vs Goliath TroubleshootingTime and time again I’m seeing administrators reactively trying to support growing VDI and application environments. And, even with more initiatives around things like DaaS and cloud, I’m still seeing a lot of great use-cases in leveraging on-premise application and desktop delivery. A recent report from ResearchAndMarkets.com indicates that the global Virtual Desktop Infrastructure (VDI) market is expected to have a CAGR of 27% during the forecast period 2016-2023.

The key factors driving the market growth are increased adoption of BYOD, increasing demand of workplace flexibility and increasing adoptability of cloud technology in several end-user segments. However, the lack of training, education, and enhanced administrative capabilities around the virtual desktop infrastructure are restraining the market growth.

Whether you’re working with Citrix XenApp/XenDesktop or VMware Horizon solutions, your main goal should be planting seeds for the business; and not constantly trying to put out fires. I’ve worked with numerous organizations of all sizes that and I’ve had the chance to see just how reactive a lot of support operations can be. Even with native tools, we often forget that even real-time issue resolution can lead to slow downs. With that in mind, I want to share a few virtualization secrets with you. The goal here is to introduce a few new VMware monitoring tools and practices to help you proactively resolve issues before they even become even bigger problems.

I’ve had the chance to poke around a powerful tool recently that helps make managing a virtualization environment much easier. Specifically, the Goliath Application Availability Monitoring (GAAM) tool directly integrates with your ecosystem to proactively monitor the availability of Citrix XenApp, Citrix XenDesktop, VMware Horizon View, Microsoft RDS, and more. Here’s the cool part, this isn’t just monitoring availability, rather it allows you to automatically test the entire deliver infrastructure. If you have a sprawling Citrix platform, it’s like having a Citrix Admin at all of your end points logging in and testing everything.

Leveraging GAAM, here are a few tips and tricks to improve your VDI and Virtualization Environment.

1.) Become aware of logon failures or even slowness with better than real-time advanced warnings.

As a tool, GAAM alerts IT administrators of access and performance issues with business-critical applications before their end users ever attempt to logon by having the Goliath ‘system user’ attempt logons – which is actually modeled after one of your real users in terms of site, profile, and using the same steps, sites, and profiles as an actual user. From there, GAAM provides real-world data on what will happen when your end user tries to access his/her application or desktop. Logon issues reduce as you gain time and detailed metrics to proactively troubleshoot and practice towards future prevention.

2.) Can’t stress this enough – leverage tools that give you the most amount of flexibility: Cloud, On-Premises, and even Hybrid.

I have no doubt that you’ve got cloud on your mind. That said, GAAM can be deployed on-premises, in the cloud, site, or geographic location of your choosing. From there, you gain the ability to monitor user logon experience in real time with the Goliath Application Availability Monitor – regardless of your deployment model. Ultimately, this gives you immediate access to the right information allowing you to mitigate logon issues quickly to eliminate end user pain. All of this, while still leveraging cloud!

3.) Take the guessing game out of logon issues and session performance challenges.

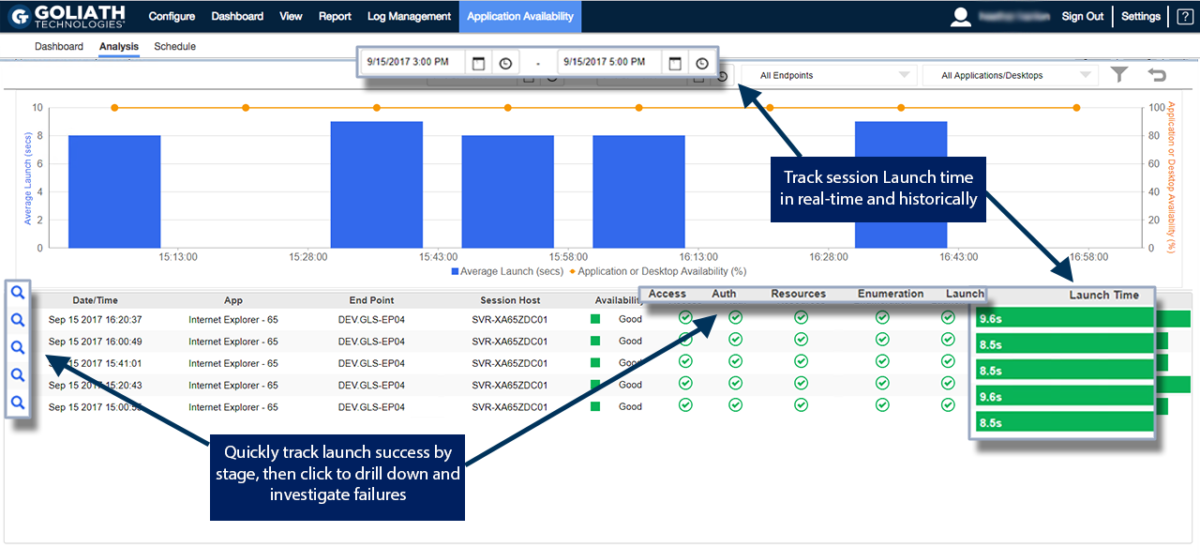
In my experience, the vast majority of challenges are noticed after a user logs in and starts complaining. But, what if you had a tool that could analyze each phase of the logon process and document it with a screenshot? Not only that, it can show where there was a failure! With each phase of the logon process GAAM attempts, a screenshot is taken to provide visual evidence and objective proof of logon success or logon failure. This allows you to see the potential impact that typically elusive items like disclaimers, secondary authentication, client-side errors, and multiple launch sequences may have on the results of the logon process.

Furthermore, administrators are able to quickly gain context to go along with full text logon sequencing results. As such, it’s much easier for IT to understand the intricacies of a particular logon issue without needing to: a) attempt to reproduce the problem manually, or b) wait for it to happen again.

Finally, you can leverage this solution by scheduling logon attempts to test out new applications, entire business units, or how users will interact with a new system. From there, you can setup alerts as well as screenshots to know exactly when and where there are issues with applications, backend systems, or the virtualization environment in general.

The user is one of the most important components of any technology architecture. The Goliath Application Availability Monitoring tool doesn’t only help you get to a resolution, it diagnoses the root cause of the issue. For any administrator, you’re taking the guessing game out of trying to figure out why there’s slowness and why you have upset users. This is your early warning system to make sure your environment stays healthy, proactively. That screenshot technology alone can help you save hours trying to figure out why certain user sessions simply don’t work well.

The Goliath Application Availability Monitor provides incredible value, especially at the price point. This is a subscription-based tool available at $3,500/year per location. That means, for about $300/month you have the equivalent of a full time Citrix Administrator proactively finding issues before your end users are impacted, finding true root cause, and freeing up your IT team for other projects. It’s a real win-win.

My biggest recommendation is to try these solutions out at the very least. Doing a demo or PoC isn’t challenging at all and can give you so much insight into your existing processes. I know a lot of administrators and solutions talk a ‘proactive’ game, however, technologies like the Goliath Application Availability Monitoring actually deliver. Be sure to try it out!
Ensure Good End User Experience With Proactive Monitoring

Ensure Good End User Experience With Proactive Monitoring

end user performance monitoring
 

As an IT pro, making sure that the end users have a good experience is one of the most important parts of the job. It’s so important in fact, that there are numerous tools available for monitoring the performance of end user sessions. In most cases, such monitoring tools work by examining a series of performance counters in an effort to quantify the end user experience. In reality, however, performance data and what the end users actually experience can be two very different things.

Because performance counter-based monitoring tools can give IT professionals a false sense of wellbeing, Goliath Technologies has designed its Application Availability Monitor to take a completely different approach to not only quantifying the end user experience but detecting issues before the users notice them.

One of the key advantages of Goliath’s solution is that while most application monitors perform real-time monitoring, Goliath’s Application Availability Monitor is designed to work proactively as an advanced warning system. To see why this distinction is so important, imagine for a moment that a problem has occurred overnight and that if left unchecked it will impact user logins in the morning. A system that is based solely on real-time monitoring will detect the problem at the same time that the end users do. Of course, that’s assuming that the monitoring system detects the problem at all. Performance counter-based monitoring solutions often have blind spots that they cannot monitor and may, therefore, overlook a serious problem.

Goliath Application Availability Monitor does things in a much different way. Rather than blindly examining various performance metrics, Application Availability Monitor synthetically reproduces the actual user login experience.  The “Goliath virtual user” logs on to your applications from your network endpoints, using exactly the same steps as a real user.

This synthetic logon process can be scheduled so that it runs automatically on any or all network endpoints. This is important for two reasons. First, if users are scheduled to arrive for work at 8:00, Application Availability Monitor can be configured to test the system well in advance of the user’s arrival, such as at 4:00. That way, if problems are detected, the IT department will have adequate time to address those problems before the users show up for work.

The other reason why the synthetic logon process is so important is that it occurs directly on the network endpoints. In contrast, many of the other monitoring solutions that are available run on a network server and focus on monitoring the Citrix infrastructure. Such a solution would typically not be able to detect a problem occurring at the endpoint where the user logs in.

One more thing that makes Application Availability Monitor different from competing solutions is the way in which it gathers diagnostic information. Rather than presenting the administrator with a cryptic message indicating that a threshold value has been exceeded, the software actually takes screen captures of the virtual user’s experience. IT pros can use these screen captures to address any problems that may be occurring and can easily forward the screen captures to vendors or external support providers if necessary. Similarly, MSPs may use the screen captures as a way of documenting the uptime or SLAs of their service to their customers.

How to Proactively Ensure End Users Always Have VDI Access

How to Proactively Ensure End Users Always Have VDI Access

It’s amazing to see just how far we’ve come in terms of connectivity and how we leverage digital resources. As standalone analog devices give way to connected digital devices, the latter will generate vast amounts of data that will, in turn, allow us the chance to refine and improve our systems and processes in previously unimagined ways. A recent IDC report pointed out that Big Data and metadata (data about data) will eventually touch nearly every aspect of our lives — with profound consequences. By 2025, an average connected person anywhere in the world will interact with connected devices nearly 4,800 times per day — basically one interaction every 18 seconds.

In the business world – this couldn’t be truer. So many workers are no longer bound by a ‘desk’ and can be classified as mobile employees working well outside of the traditional ‘9-5’ parameters. This means that end users need to have Citrix or VMware Horizon VDI access no matter where they are working. I know I certainly fall into that category. I also know that I interact with digital devices every single day and I generate vast amounts of data around my interaction with those devices. Through it all, it’s the data that I create around my experience that’s truly most valuable.

Real-World VDI Access Example

Let’s drill down this experience into some real-world situations. Here’s a portal I use to access some key desktops and apps:

I love launching my desktop (from pretty much any device) and having all of my resources readily available. However, in a world where ‘slow is the new down,’ it can get pretty frustrating when something isn’t working. Specifically, VDI connection issues and VDI problems can cause serious hang-ups and experience issues.

So, what do you do if you have hundreds, or even thousands of users accessing VDI instances? How do you quickly capture VDI connection issues? Sure, Citrix XenDesktop and VMware Horizon have great tools built-in. but what if you need a tool that proactively confirms the availability of any application that is accessed using desktop virtualization, regardless of the location of the applications or users? Remember, you don’t just want to solve a problem quickly, you need to find the root cause to prevent this type of issue from recurring.

How to Fix VDI Connection Issues

If there is a VDI connection issue or a problem with a virtual application, it’s critical to have the ability to monitor, report, and alert in detail around the issue root cause areas. Further, IT professionals need an end-to-end look at the entire virtual infrastructure, not just part of it. The Goliath Application Availability Monitor (GAAM) is a great example of this as it acts as an early warning system for IT managers and administrators; the key word here being EARLY warning. GAAM will tell you if there is a logon failure, network problems, or application enumeration issues. Again, the really cool part here is the proactive nature of this alert and monitoring system. For example, it can let you know that your Citrix or VMware Horizon could experience a serious bottleneck before a group of users log on by showing exact screenshots of the environment and the issue.

This tool accurately confirms the availability of any application that is accessed using desktop virtualization, regardless of the location of the applications themselves or the users. The other important point is that virtualization environments can be very different which is why GAAM doesn’t only focus on one architecture. It integrates to proactively monitor the availability of ANY application or desktop delivered over Citrix XenApp, Citrix XenDesktop, VMware Horizon, or Microsoft RDS.

With all of this in mind, we need to actually understand what it looks at. Specifically:

  • Connectivity (i.e. network speeds, latency)
  • Application/desktop availability
  • Configuration or availability problems with the delivery infrastructure, including Citrix NetScaler, web interface/storefront, delivery controllers, active directory, licensing servers, SQL databases, and much more
  • Licensing issues
  • Client-side errors (i.e. a message box error presented at the endpoint level, captured by Goliath’s screenshotting technology)

One of my biggest pet peeves really does revolve around VDI connection issues and slowness. This is why working with connectivity is one of the most important elements to test and validate. Let me point you to the ‘value of the millisecond.’ Research from TABB Group estimates that if a broker’s electronic trading platform is 5 milliseconds behind the competition, it could lose at least 1% of its flow; that’s $4 million in revenues per millisecond. Up to 10 milliseconds of latency could result in a 10% drop in revenues. From there it gets worse. If a broker is 100 milliseconds slower than the fastest broker, it may as well shut down its FIX engine and become a floor broker. In this case, latency is literally worth $4 million per millisecond. But what if you’re working with healthcare VDI? The value of a millisecond could now revolve around someone’s life.

In our persistently connected society, making sure that we have the best experience possible doesn’t just mean being able to access a simple resource. User experience and performance translates to productivity, happier employees, and IT staff providing value back to the business. Tools like Goliath Application Availability Monitor help diagnose root cause issues and quickly resolve VDI connection issues before they become major problems. The final key point is ease-of-use. You don’t have to be a script expert to deploy this type of tool. GAAM gives you the ability to leverage an easy-to-use, centrally managed tool when configuring synthetic launch sequences regardless of endpoint.

Your users are constantly on the move. This is why it’s so important to leverage good monitoring and performance tools within your virtualization infrastructure. Remember, these are the types of products that help you proactively troubleshoot an issue and even prevent it in the future. This keeps your end users online and able to access mission-critical applications, no matter where they are working from that day.