How to Troubleshoot “Citrix is Slow” for Remote Workers

How to Troubleshoot “Citrix is Slow” for Remote Workers

Citrix CTP Blog

How to Troubleshoot “Citrix is Slow” for Remote Workers

Troubleshoot Citrix remote workers

By George Spiers, Citrix CTP

The COVID-19 pandemic has disrupted how every business on the planet works. Remote working has become the new normal, and IT needs to adapt quickly to support this somewhat new way of working.

I say new way of working, but it isn’t actually new at all in the grand scheme of things.

People have been working outside of the office, such as from home or other public places, for many years now. Organizations such as Citrix have provided technologies that have helped with achieving this, and many times in the IT industry we hear how the office is now just another place people can stop by to work from.

However, working remotely may now be for many of us the new normal. While there are organizations that previously had staff working from home one or two days a week, these organizations may now have staff working from home full time or the majority of their working week.

On the other hand, some organizations did not have staff working remotely at all. These organizations have had to adapt quickly because of the pandemic, and that may have been a rushed, painful process especially if the organization did not initially have the correct infrastructure in place to allow effective remote working.

Organizations now have staff working from home all over the country, and staff depending on remote technology could be using either their personal devices, or corporate laptops. To support this shift, Citrix Gateway could be configured within the organization’s private or public cloud to allow for secure remote access to virtual applications and desktops. With Citrix Gateway acting as an ICA proxy, staff may be allowed by the organization to use their personal computers, laptops, or tablets such as an iPad.

Other organizations may use the Citrix Gateway for VPN access, and have staff again use their corporate devices, or personal devices subject to posture checking.

IT loses visibility and control

These technologies such as VPN and ICA proxy are great at allowing efficient remote working, however, there are more external factors introduced with remote working that can impact the end-user experience. We now have staff connecting into our datacenters from a range of different internet connections, from 3G, 4G, Wi-Fi hotspots and broadband. This is something corporate IT can’t control.

Further to this, if staff are likely using their personal devices to connect in, those devices in some instances could be the latest and greatest Windows 10 or Apple devices that are fully patched running the latest versions of web browsers and Citrix Workspace app. This is often only a very small percentage of the userbase though, as most devices will run a mixture of operating systems from Windows 10 to Windows 7, and older macOS versions that have not been updated in 3-4 years. I often find these devices also running unsupported versions of Citrix Receiver that simply haven’t been updated since they were initially installed.

Staff still expect that if they can connect to their virtual apps and desktops, that the performance they receive is similar to what they were used to when working from the office. That is, minimal lag, a responsive application that also launches quickly, and is available whenever they need it.

The rise of multimedia

Audio and video technologies such as Zoom and Teams have become much more popular due to the pandemic and staff working remotely. People need to stay in touch daily, from having meetings regarding ongoing projects or simply keeping in touch to prevent feeling isolated.

Usage of Teams has more than doubled in recent months, with now over 70 million active users using it around the world. Bandwidth consumption can range from 30kbps to over 1Mbps depending on if you are audio calling or in a group video call.

It is important to keep in mind that these multimedia platforms do have the ability to consume more of your available bandwidth, and for those staff members who have lower quality broadband in the home, there could be bandwidth contention with your virtual apps and desktop sessions. I should also mention the fact that if you have other members in your household streaming or playing online games from a range of devices, those activities will further add to the bandwidth contention of your home broadband.

The remote worker, returning to the office

Since the initial months of the pandemic, some restrictions are being lifted across different countries and people are allowed to return back to the office, though often in limited numbers.

Some staff are also returning to the office on a part-time basis, but the change of toolsets has created a potential new problem. All these multimedia applications such as Zoom and Microsoft Teams that were adopted for keeping connected will continue to be used even as staff return to the office. Because of this, what starts to happen is that gradually a much higher demand is placed on the office network. The more people that return, the higher the bandwidth utilization is likely to be, higher than ever before.

Users will still also obviously continue to launch their virtual apps and desktops whilst in the office, but with the much higher bandwidth contention with peers, the ICA channels could be impacted, causing slow application launches, slow in-session performance and so on.
Ultimately, the risk of tickets reaching the desk for “Citrix is slow” problems may be more common.

Pinpointing the slowness

From an IT perspective, Citrix admins need to be able to pinpoint where the slowness is coming from when an end-user reports that “Citrix is slow” from the office or remote. Is it the home network the user is connected from, the user’s personal device, the entire corporate office, or something in the datacenter with the Citrix VDAs?

For example, it could be the end-users home network due to household members using Wi-Fi for streaming and playing video games, leading to bandwidth contention which is impacting the end-users ICA session to their virtual apps and desktops.

On the other hand, it could be that the end-user’s personal device is running poorly. Maybe it is running on quite old hardware, or there has been a lot of third-party software installed on the device which is causing high RAM or CPU utilisation. Such problems can impact the launching and in-session ICA performance, however the end-user may report to the helpdesk that Citrix is slow, not knowing that it is caused by their own device. This leads IT down the wrong path from the beginning.

Also, staff may now be reporting slowness after a return to the office, with the usage of Zoom and Teams still high, because the network infrastructure was not designed for the larger amount of traffic end-users are now pushing through it.

IT needs purpose-built monitoring tools to help pinpoint where the issue lies and to quickly rule out if the issue is not with Citrix at all.

How ICA channel, network, and latency monitoring help

A purpose-built monitoring tool that can monitor each of the individual ICA channels, the end-user’s network, and latency is a powerful solution to have at your disposal. Goliath Performance Monitor, for example, has such ability to monitor each channel and you can be selective about what channel to investigate when troubleshooting.  
 

Troubleshoot Citrix remote workers

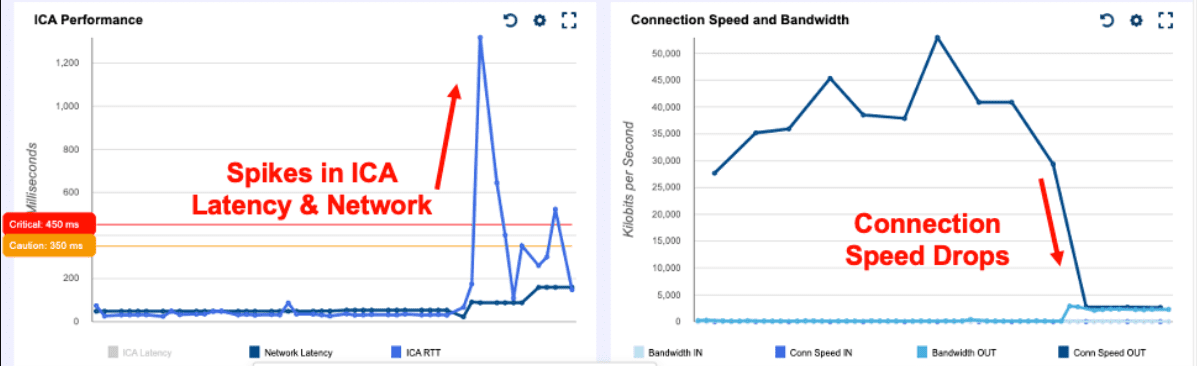
In the below example, an end user reported that their session became slow suddenly and wanted to know what happened. Upon review, we can see that the end user experienced a sudden spike in network latency, which caused the ICA latency to jump up.

At the same time, we were able to see that the user’s connection speed dropped simultaneously, which we can correlate to the sudden spike in network latency. Obviously, something happened on the end-users network at that time to cause a drop, which could have been a burst in demand for available bandwidth or just temporary slowness from any of the hops coming into the organization’s datacenter.
 

Troubleshoot Citrix remote workers

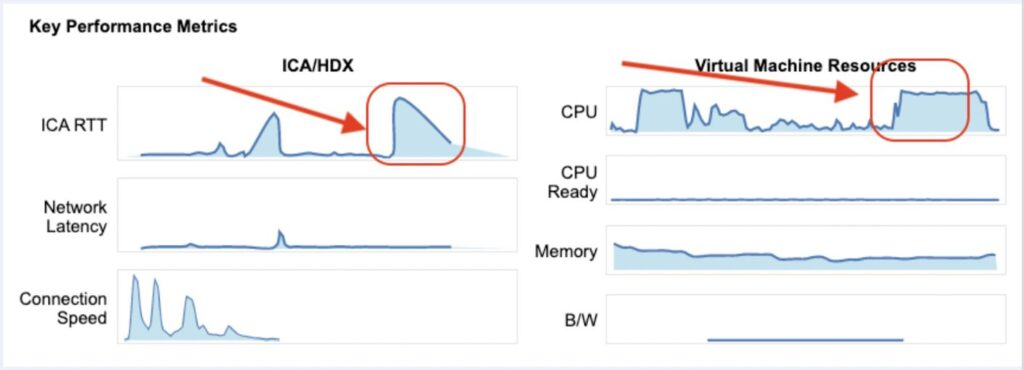
Finally, in this example, an end user similar to the scenario before encountered a sudden spike in ICA RTT latency, but this time it was not actually anything user-side which caused the problem.

Upon comparing the VDA CPU utilization the end user was connected to at the time, we can see the CPU usage increase for a period of time that matches when the ICA RTT latency jumped. This eliminates any doubt over the end-user connection, which can also be tracked under Network Latency and appears to be very stable throughout.
 

Troubleshoot Citrix remote workers

Summary

Remote working, and higher usage of multimedia solutions are here to stay. What that also means is troubleshooting slow session and end-user experience issues is not going away any time soon.

Luckily, there are solutions out there that can help assist and guide Citrix admins to typical “Citrix is slow” resolutions so that you don’t spend any extra time troubleshooting, especially when you cannot see the full picture for those users remotely connecting from various internet links and from personal devices.

As you can see from these examples, with actual data-driven proof you can quickly isolate root cause, have your users back up and running quicker and spend less time troubleshooting end-user problems.

To learn more about how to troubleshoot “Citrix is Slow” by understanding data from ICA/HDX protocol, check out this Technical Guide to Citrix ICA/HDX sponsored by Goliath Technologies.

This post was originally published on JGSpiers.com.

Chris Hughes

George Spiers

Citrix CTP, Citrix Certified Expert in Virtualization (CCE-V), Citrix Certified Expert in Networking (CCE-N), and  Microsoft Certified Solutions Expert. 
Why Troubleshooting Tools are Important to Any Citrix Upgrade

Why Troubleshooting Tools are Important to Any Citrix Upgrade

Citrix CTP Blog

Why Troubleshooting Tools are Important to Any Citrix Upgrade

George Spiers blog banner

The Extended Support end-date for XenApp 6.5 is just under two months away, so the remaining customers, which I expect to be a fair few, should be on their migration journey to the Flexcast Management Architecture versions of Citrix Virtual Apps and Desktops 7.

We should take a moment to firstly identify the different types of customers and where they are on their Citrix Virtual Apps and Desktops journey. I like to group them in to three categories:

The XenApp 6.5 Customers:

The XenApp 6.5 customers that remain on that version for reasons such as:

1. It just works, and the customer has been reluctant to move to Virtual Apps and Desktops 7 in case it did not perform as well.

2. Missing features available in XenApp 6.5 but not available in Virtual Apps and Desktops 7. Thankfully Citrix has filled the gap in this regard, not to mention the many more features now in Virtual Apps and Desktops 7.

3. Having to retrain staff on the Flexcast Management Architecture is a challenge and has delayed the transition to Virtual Apps and Desktops 7. The components that make up a Virtual Apps and Desktops 7 site do behave different, but many components have not changed a great deal from 6.5.

4. Budget constraints, as to support a new upgrade version, there is normally a requirement to invest in new virtualisation hardware, storage, and software licenses such as for new Operating Systems.

5. Concerns around how IT support can affectively troubleshoot in a Virtual Apps and Desktops 7 environment, as there has been change in the architecture and components.

The 7.x Long Term Service Release (LTSR) Customers:

The 7.x Long Term Service Release customers that remain on such a version for reasons such as:

1. The customer does not have the staff numbers or time to keep upgrading to the latest versions of Virtual Apps and Desktops.

2. The customer does not want to risk the disruptions that an upgrade has the potential to bring, such as new types of faults leaking into the environment, slower performing logons, or a worsened in-session user experience.

3. The customer wants to remain on a stable version and not risk introducing new code to the environment that could be unstable.

4. The customer has no interest in new features at this time, and the current LTSR version offers all that they need.

The 7.x Current Release (CR) Customers:

The Virtual Apps and Desktops 7 Current Release customers remain on such a version for reasons such as:

1. The customer needs the latest features released by Citrix, as it allows the customer to be more competitive in their market.

2. The customer has a well-defined upgrade strategy that minimises user disruption and can be executed easily.

3. The customer has the staff skilled to perform frequent upgrades and they are well equipped with tools such as monitoring products to capture analytics and troubleshoot the environment effectively.


Either way, if a customer is still on XenApp 6.5, LTSR or the Current Release of Virtual Apps and Desktops, at some time sooner or later the environment will need to be upgraded.

Stepping aside from Citrix upgrades and looking outside of the Citrix stack allows us to remember that every other component used to support your application or desktop virtualisation deployment will need to be maintained and not left stagnant. That is, from your bare metal hypervisor hosts, to the network and storage fabrics, Operating Systems, SQL server versions, and the applications that users’ interface with every day.

The problem the IT team and organisation face is that with upgrades to any infrastructure hardware or software component, it can result in a degraded end-user experience, or it could introduce new types of faults into your environment. This is where monitoring software can aid your deployments and help ease those deployment pains.

Investment in purpose-built troubleshooting and monitoring tools helps with deployment pains:

A monitoring solution is just what you need to aid your upgrades from XenApp 6.5 to 7, or from Virtual Apps and Desktops 7 versions to later releases. Here are three key benefits you can gain from having a monitoring solution in place:

Baseline the environment before and after upgrades.

Baselining allows you to compare the performance of your infrastructure when it is working as it should, and then after you complete an upgrade to a newer version of Virtual Apps and Desktops. You can also extend the baselining to hardware refreshes, Operating System upgrades, 3rd party software upgrades and more. This allows you to determine if any change to the environment has had an impact on performance.

Baselines should be focused to include logon times, application launch times, virtual machine resource consumption, and resource consumption against your hypervisors, storage and network.

Monitor both old and future environments from a single pane of glass.

During a Virtual Apps and Desktops upgrade, there is going to be a time where you will have users launching resources from both old and new environments. More typically in an enterprise environment will you stage the upgrade. This allows you to carefully plan and execute your upgrades, without putting too much pressure on your team and causing mass-disruption to end-users.

With a monitoring product that is able to monitor both environments at the same time, you will have the advantage of being able to effectively monitor and troubleshoot both environments from a single console, as let’s face it, the priority of the old environment should not decrease until the last user has been migrated off it.

Troubleshoot any issues that do crop up after the migration quickly, to avoid end-user disappointment.

Your end users are the key to a successful deployment. If your end-users frequently experience issues during or just after the deployment of a new version of Citrix Virtual Apps and Desktops, management may delay

Leverage historical reports to continually monitor and trend use and performance over time.

To anticipate and prevent future issues, it is critical to trend and watch performance over time so that you can foster data driven conversations on how and where you can make future performance improvements and ensure performance degradation does not slowly happen over time.

Goliath Performance Monitor (GPM):

The three key benefits I spoke about can be delivered by a monitoring and troubleshooting solution such as Goliath Performance Monitor, and the Application Availability Monitor products.

Application Availability Monitor (GAAM) is a synthetic application availability tool that can simulate the launching of applications or desktops in your Virtual Apps and Desktops environments, mimicking a real user session launch. Simulations are automatically performed at set times chosen by you, and simulations launch a resource just like an end-user would. This synthetic logon process tests StoreFront logins, authentication, application enumeration, session launch, and more, including capturing the time it takes for each step to complete.

These steps play a direct part in the success of a Virtual Apps and Desktops upgrade. If they are much slower after an upgrade than they previously were, delays to the upgrade may be inevitable as user feedback would be poor and adoption is likely to be low.

Having a tool like GAAM running in your current environment allows you to capture a baseline for many of the workflows an end user goes through every day, and you can compare that baseline with an upgraded version of Citrix Virtual Apps and Desktops. This is further achieved by the historical reporting capabilities of the product.

The results of GAAM are fed into the Goliath Performance Monitor system and can be used for historical reporting as mentioned. This system monitors your Citrix components such as the Delivery Controllers, VDAs, and StoreFront servers. It can also monitor multiple versions, solving the key benefit of monitoring your XenApp 6.5 environment and Virtual Apps and Desktops 7 environment at the same time.

However, it also goes beyond just Citrix. GPM can monitor your hypervisor hosts, the virtual machines that run within them, your storage platform, the networking stack, and end-user specific experiences such as real user logon times, in-session performance and more. This allows you to even benchmark hypervisor performance before and after a hardware refresh, or virtual machine resource consumption after an Operating System upgrade.

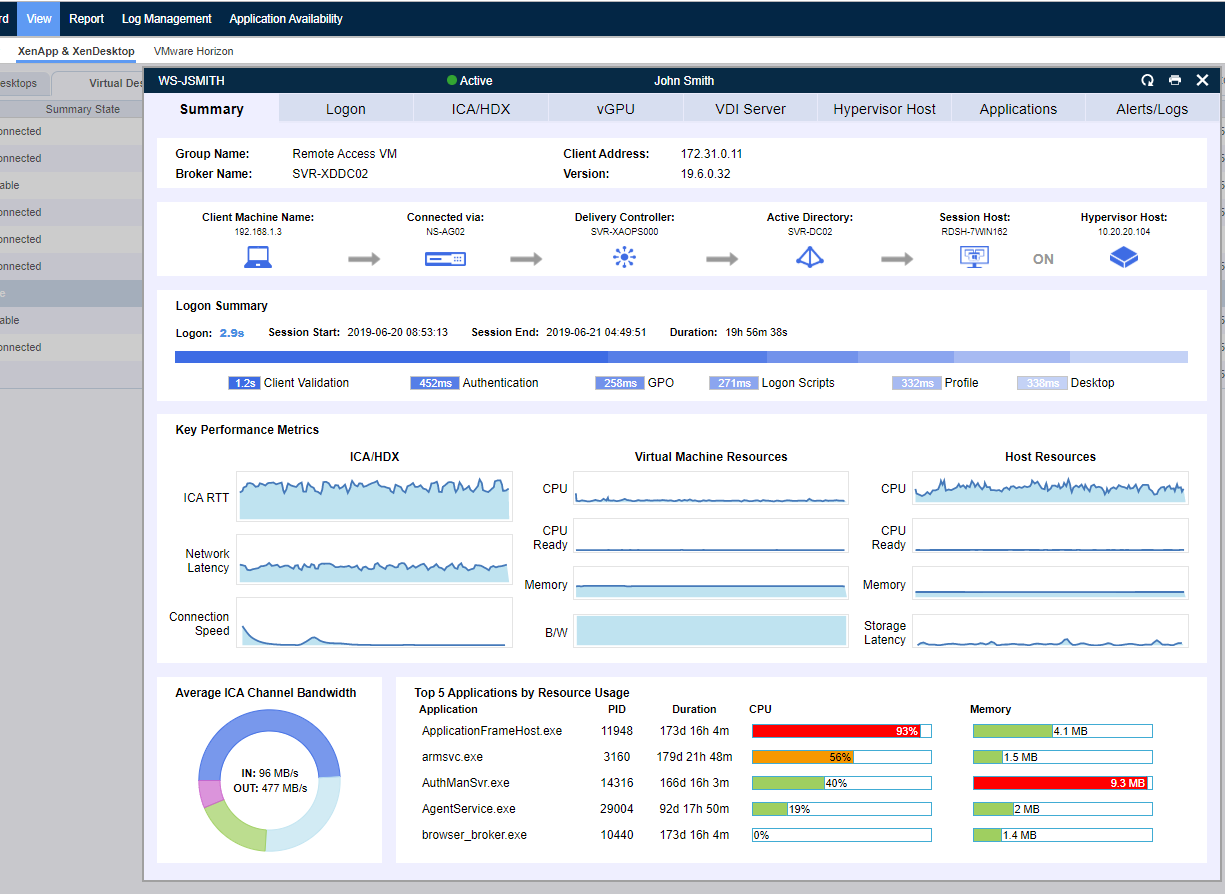
Above is a screenshot of the summary information composing the user experience dashboard that provides information and metrics about the user’s specific published app/desktop or virtual desktop session making it easier to troubleshoot when issues arise.

Going beyond benchmarking for upgrades, the capturing and archiving of all this data can assist with your capacity planning for future upgrades without the need to guess.

Whilst on a normal day the solution keeps check on your infrastructure, the early warning system provided by Goliath Performance Monitor makes sure that you are alerted to problems before an end-user experiences them, or the problems become more widespread within the business affecting multiple users. This delivers the third key benefit of solving issues before an end-user notices and tickets are opened with the helpdesk. There is also the capability of self-healing, allowing problems to automatically be remediated without manual intervention from the IT administrators.

Summary

Software vendors such as Citrix are innovating at a rapid pace, bringing new versions of their products out every quarter. This speed of release means that customers will find themselves upgrading more frequently than they ever did before, which is often warranted to make use of new functionality and stay current, however it does bring a risk to the end-user using the platform you are upgrading that they may not get the same user experience they have become used to expecting. That experience can be calculated by performance or by hard or soft errors encountered.

With a monitoring tool like GPM, you get a wrath of information about a user’s session experience when they are connected to a virtual application or desktop. That information is saved and available for historical reporting.

GPM also provides information about your virtual machine’s performance, the network performance, and hypervisor performance. You can see things like how much CPU is being consumed on a hypervisor host or what process in a virtual desktop is taking up too much memory.

If an IT administrator takes a call from an affected user, direct from the GPM console you can see the client’s IP address, logon time, Citrix Receiver version, what time they connected, their session latency and so much more. Having information like this readily available and at your fingertips empowers the IT service desk and results in support incidents being resolved faster.

All of these capabilities will undoubtably help you during those upgrades that will happen sooner rather than later. They will also continue to help once the upgrade is successful, ensuring that you not only deliver a performing solution from the beginning, but during the full life of the environment.

Whether you’re still in the planning stages or in the middle of a phased roll-out, here is a free migration guide, written for IT professionals by IT professionals that will give you all the technical details you need to ensure a seamless migration and a positive end-user experience.

Chris Hughes

George Spiers

Citrix CTP, Citrix Certified Expert in Virtualization (CCE-V), Citrix Certified Expert in Networking (CCE-N), and Microsoft Certified Solution Expert.

VDI Stack Monitoring with Goliath Performance Monitor

VDI Stack Monitoring with Goliath Performance Monitor

VDI Stack Monitoring with Goliath Performance Monitor

Quite often I run projects at existing VMware customers that are building a new Digital Workspace. And quite often, that Digital Workspace contains a VDI. Especially when a customer is already using VMware technology in their data center, vRealize Operations (vROps) is used to monitor the environment. Although vROps is a great solution, it’s not really sufficient to monitor the desktop side of things. Sure, you are able to monitor system resources and the underlying platform, but monitoring User Experience (UX) is something completely different. UX Monitoring focuses on everything directly related to the end user. And I believe that vROps falls a bit short when talking UX. In this post, I would like to explain why solutions like Goliath Performance Monitor and Goliath Application Monitor make a great alternative to vROps and can even compliment VMware’s solution.

The thing that Goliath does really well and where they were (to me) most known about, is their UX monitoring part of their solutions. UX, like I also explained in the VDI Design Guide, is one of the three types of monitoring for a VDI or DaaS related service. The others are service monitoring and capacity management (which combined are used to predict/avoid outages and rapidly respond in case an outage does happen). And since I already covered their UX monitoring quite comprehensive, I want to focus somewhat more on the less common known part: their data center integration. UX metrics (such as remote protocol metrics, logon metrics, CPU/RAM metrics) are essential to measuring what the user is experiencing but are generally impacted by either the network or the infrastructure on which the virtual desktops are running. Let’s dig into how Goliath approaches the infrastructure bit.

The main part of the portal is the Dashboard View:

Citrix Virtual Apps & Desktops page sorted by the Logon column

In the Dashboard View, it’s possible to get a high-level overview of the health of the entire VDI stack (VMs, Desktops, ESXi hosts, and Data stores). In case you are experiencing issues, the constraining resource or failing component can easily be viewed here. It shows all of the machines that are running on the VMware infrastructure but is also able to monitor physical machines that have a role in the infrastructure.

In case you need to drill down on a single VM or other objects, it is fairly simple to do so. Just by clicking on the object, the solution takes you to a deeper level of details.

Session dialog – Logon Duration tab

The cause of the possible issue is displayed in a simple overview. In the same window, you can even see the most important metrics that belong to the same object.

Session dialog – Logon Duration tab drill down

With these options to drill down to the infrastructure layer, you are able to get some more insights on how the complete stack is performing. But, in my opinion, this is still part of UX monitoring. Where it gets more exciting, is that with little adjustments, you can use Goliath Performance Monitor for service monitoring as well. I simply just added a couple of the services that runs on the Horizon Connection Server:

”Dashboard

25 seconds after the Horizon Connection Server was killed, I received an SNMP trap and an email just a couple of seconds after that telling me that the service was unavailable.

Snapshot Metrics

You can also automatically try to re-mediate the issue, but for this demo, I choose not to. It’s also possible to add all kinds of other custom metrics you would like to monitor on, which makes it perfectly suitable to add the services of your entire stack to a single solution. Some of the most common services (like SQL, SMTP or HTTP) are already part of the alerts your are able to set up, but the custom ones can be created with things like syslog, SNMP traps or custom Windows/Unix/Linux scripts.

Conclusion

I hope I gave you an idea of the possibilities of Goliath’s solutions. Where they fit, depends on your situation. In case you already have vROps in place, you might be able to use Performance Monitor and Application Monitor for your UX metrics that are close to the end user. But, as vROps is included in the VMware Horizon Enterprise license only, there are tons of customers who are in need of an alternative. The complete suite of Goliath’s solutions can be a fine alternative. You can drill down to the physical resource level of hosts, storage and networking in case of performance issues and they offer SNMP, syslog or native service integration in case you would like to include service monitoring as well. If you are already a Citrix customer that is migrating to Horizon, keeping your Goliath stack might make sense since you are already familiar with how to monitor that. Both Citrix and Horizon monitoring can be combined in the same dashboard, which might make monitoring a lot easier during a migration. The solutions are fairly simple to set up and also adds integration to certain 3rd party application stacks, but more about that later 🙂.

Haven’t read the VDI Design Guide yet?
Get your FREE version today.

For more information on how Goliath Performance Monitor can help you and your team be proactive and anticipate, troubleshoot and prevent end user experience issues:

Send us an email: techinfo@goliathtechnologies.com

Give us a call: 855-465-4284

Top American Airline Ensures Access to Citrix Virtual Apps with Application Availability Monitoring

Top American Airline Ensures Access to Citrix Virtual Apps with Application Availability Monitoring

[fusion_builder_container hundred_percent=”no” hundred_percent_height=”no” hundred_percent_height_scroll=”no” hundred_percent_height_center_content=”yes” equal_height_columns=”no” menu_anchor=”” hide_on_mobile=”small-visibility,medium-visibility,large-visibility” status=”published” publish_date=”” class=”” id=”” background_color=”” background_image=”” background_position=”center center” background_repeat=”no-repeat” fade=”no” background_parallax=”none” enable_mobile=”no” parallax_speed=”0.3″ video_mp4=”” video_webm=”” video_ogv=”” video_url=”” video_aspect_ratio=”16:9″ video_loop=”yes” video_mute=”yes” video_preview_image=”” border_size=”” border_color=”” border_style=”solid” margin_top=”” margin_bottom=”” padding_top=”” padding_right=”” padding_bottom=”” padding_left=””][fusion_builder_row][fusion_builder_column type=”2_3″ layout=”1_1″ spacing=”” center_content=”no” link=”” target=”_self” min_height=”” hide_on_mobile=”small-visibility,medium-visibility,large-visibility” class=”” id=”” background_color=”” background_image=”” background_image_id=”” background_position=”left top” background_repeat=”no-repeat” hover_type=”none” border_size=”0″ border_color=”” border_style=”solid” border_position=”all” padding_top=”” padding_right=”” padding_bottom=”” padding_left=”” margin_top=”” margin_bottom=”” animation_type=”” animation_direction=”left” animation_speed=”0.3″ animation_offset=”” last=”no”][fusion_text columns=”” column_min_width=”” column_spacing=”” rule_style=”default” rule_size=”” rule_color=”” hide_on_mobile=”small-visibility,medium-visibility,large-visibility” class=”” id=””]

[fusion_imageframe image_id=”” max_width=”” style_type=”” blur=”” stylecolor=”” hover_type=”none” bordersize=”” bordercolor=”” borderradius=”” align=”right” lightbox=”no” gallery_id=”” lightbox_image=”” lightbox_image_id=”” alt=”” link=”/citrix-director-comparison/?utm_source=blog&utm_inline=banner&utm_campaign=website-CTAs&utm_content=gaat-airlines” linktarget=”_blank” hide_on_mobile=”small-visibility,medium-visibility,large-visibility” class=”” id=”” animation_type=”” animation_direction=”left” animation_speed=”0.3″ animation_offset=””]Director vs Goliath Troubleshooting[/fusion_imageframe]In this post, we share a story about how one of the top 10 airlines utilized a new technology to solve an old problem: Proactively confirm that the Sabre Reservation System, accessed using Citrix, would be available when reservation specialists attempted to logon and schedule flights for customers. They selected the Goliath Application Availability Testing Service for Citrix.
Recently, Goliath received an inquiry from the Citrix Engineering Team at one of the top ten airlines in the world. The Citrix team was in dire need of a tool which would allow them to continually check remote connectivity and availability of their Citrix VDI infrastructure and the Sabre Reservation System and alert them before they were called by the business units who would usually contact them when reservation specialists were having logon issues can catch them flat-footed. So, they wanted to be able to avoid these calls and if they did happen, have the ability to say, “we know of the issue and were on it”.

The catch: No technology could be deployed on-premises.

Employing a large remote workforce of registration agents in multiple time zones was effective from a business standpoint allowing for greater flexibility in hiring and market coverage. However, it did not come without technical challenges, as these remote team members were experiencing issues when the Citrix desktops were intermittently not launching successfully.

The catch: No technology could be deployed on-premises.

Employing a large remote workforce of registration agents in multiple time zones was effective from a business standpoint allowing for greater flexibility in hiring and market coverage. However, it did not come without technical challenges, as these remote team members were experiencing issues when the Citrix desktops were intermittently not launching successfully.

IT needs to ensure an ‘Always On’ Citrix environment for 1,000+ remote end users

At approximately 1,000+ users who take reservations and VIP support calls, the airline’s remote work force is rather large. This team depends on Citrix for delivery of key applications in order to perform their duties on a daily basis, and availability of those resources needs to be available 24/7/365.

We introduced the Citrix Engineers to our application availability testing service, which doesn’t require any software on premise. The onboarding process was easy. A configuration link was sent to them where they entered the following information:

  • URL to connect to the Citrix environment
  • The Citrix account credentials
  • Application or desktop name to be tested
  • Email address for receiving real-time alerts from the Application Availability Service

Upon saving the information, the service was fully configured and ready to start the testing process.

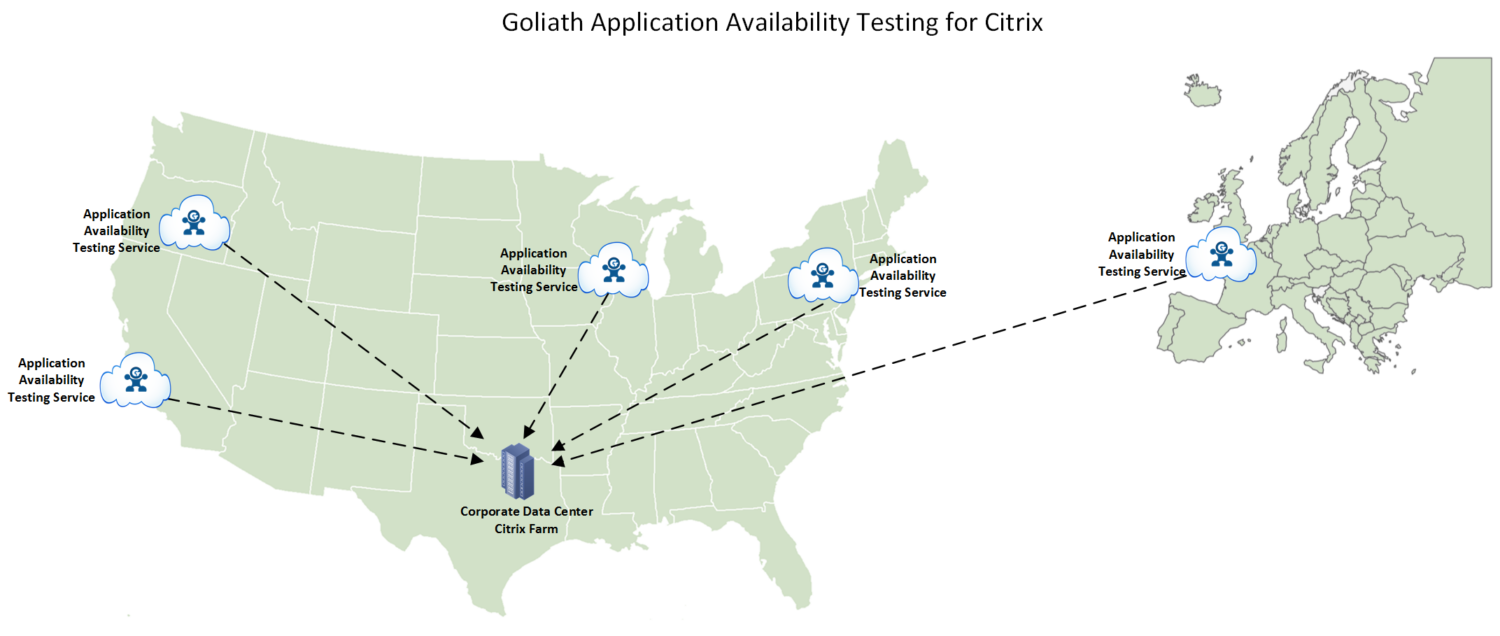
As you can see below, the service was configured to test application availability from four different egress points in the United States, and one in Europe. Each was selected based on time zone and the largest clusters of remote employees.

[/fusion_text][fusion_imageframe image_id=”41714|800″ max_width=”” style_type=”” blur=”” stylecolor=”” hover_type=”none” bordersize=”” bordercolor=”” borderradius=”” align=”center” lightbox=”yes” gallery_id=”” lightbox_image=”” lightbox_image_id=”” alt=”” link=”” linktarget=”_self” hide_on_mobile=”small-visibility,medium-visibility,large-visibility” class=”” id=”” animation_type=”” animation_direction=”left” animation_speed=”0.3″ animation_offset=””]https://goliathtechnologies.com/wp-content/uploads/2019/02/GAAT-Airlines-800×339.png[/fusion_imageframe][fusion_separator style_type=”none” hide_on_mobile=”small-visibility,medium-visibility,large-visibility” class=”” id=”” sep_color=”” top_margin=”25″ bottom_margin=”” border_size=”” icon=”” icon_circle=”” icon_circle_color=”” width=”” alignment=”center” /][fusion_text columns=”” column_min_width=”” column_spacing=”” rule_style=”default” rule_size=”” rule_color=”” hide_on_mobile=”small-visibility,medium-visibility,large-visibility” class=”” id=””]

Test & Confirm Applications Will Launch in Real Time

Almost immediately, the Citrix team started seeing successful application and desktop launches in real time. They also started seeing that failures were occurring. In fact, after initiating the first test, the Citrix team began receiving email notifications of logon failures.

Here is an example of the real-time screen they were seeing:

[/fusion_text][fusion_imageframe image_id=”41715|full” max_width=”” style_type=”” blur=”” stylecolor=”” hover_type=”none” bordersize=”” bordercolor=”” borderradius=”” align=”center” lightbox=”no” gallery_id=”” lightbox_image=”” lightbox_image_id=”” alt=”” link=”” linktarget=”_self” hide_on_mobile=”small-visibility,medium-visibility,large-visibility” class=”” id=”” animation_type=”” animation_direction=”left” animation_speed=”0.3″ animation_offset=””]https://goliathtechnologies.com/wp-content/uploads/2019/02/Confirm-Logon-Slowness-e1550089903569.png[/fusion_imageframe][fusion_separator style_type=”none” hide_on_mobile=”small-visibility,medium-visibility,large-visibility” class=”” id=”” sep_color=”” top_margin=”25″ bottom_margin=”” border_size=”” icon=”” icon_circle=”” icon_circle_color=”” width=”” alignment=”center” /][fusion_text columns=”” column_min_width=”” column_spacing=”” rule_style=”default” rule_size=”” rule_color=”” hide_on_mobile=”small-visibility,medium-visibility,large-visibility” class=”” id=””]

Upon receiving these alerts they were able to do what?

This data and information is also available in a historical report IT staff can analyze to make decisions and provide management with historical information.

The two images below are an example of logon failures displayed in this report. In the example here, the airline’s Citrix engineer used the data to confirm that a StoreFront server went down.

The report drilled down into the actual steps taken to get to the failure point. In a production environment, the appropriate support teams would have been alerted immediately when these failures occurred, giving them time to investigate the issue before receiving calls from their end users.

Finally, and as importantly, the reports gave them objective evidence that would validate whether or not they were meeting their Citrix Availability SLAs.

[/fusion_text][fusion_imageframe image_id=”41716|800″ max_width=”” style_type=”” blur=”” stylecolor=”” hover_type=”none” bordersize=”” bordercolor=”” borderradius=”” align=”center” lightbox=”yes” gallery_id=”” lightbox_image=”” lightbox_image_id=”” alt=”” link=”” linktarget=”_self” hide_on_mobile=”small-visibility,medium-visibility,large-visibility” class=”” id=”” animation_type=”” animation_direction=”left” animation_speed=”0.3″ animation_offset=””]https://goliathtechnologies.com/wp-content/uploads/2019/02/Historical-Simulation-Drilldown-800×422.png[/fusion_imageframe][fusion_separator style_type=”none” hide_on_mobile=”small-visibility,medium-visibility,large-visibility” class=”” id=”” sep_color=”” top_margin=”25″ bottom_margin=”” border_size=”” icon=”” icon_circle=”” icon_circle_color=”” width=”” alignment=”center” /][fusion_imageframe image_id=”41717|800″ max_width=”” style_type=”” blur=”” stylecolor=”” hover_type=”none” bordersize=”” bordercolor=”” borderradius=”” align=”center” lightbox=”yes” gallery_id=”” lightbox_image=”” lightbox_image_id=”” alt=”” link=”” linktarget=”_self” hide_on_mobile=”small-visibility,medium-visibility,large-visibility” class=”” id=”” animation_type=”” animation_direction=”left” animation_speed=”0.3″ animation_offset=””]https://goliathtechnologies.com/wp-content/uploads/2019/02/Track-Simulation-Results-800×359.png[/fusion_imageframe][fusion_separator style_type=”none” hide_on_mobile=”small-visibility,medium-visibility,large-visibility” class=”” id=”” sep_color=”” top_margin=”25″ bottom_margin=”” border_size=”” icon=”” icon_circle=”” icon_circle_color=”” width=”” alignment=”center” /][fusion_text columns=”” column_min_width=”” column_spacing=”” rule_style=”default” rule_size=”” rule_color=”” hide_on_mobile=”small-visibility,medium-visibility,large-visibility” class=”” id=””]

The Logon Success/Failure Analysis Report may be configured to run on a scheduled basis (daily, weekly, etc.) or as an on-demand report– just in time for those impromptu meetings management sometimes calls.

This Logon Report provides:

  • A direct output of any scheduled logon successes or failures for the time period specified when the report is generated
  • Full visibility to drill down into each of the logon availability tests to identify where a failure may have occurred

Logon Success/Failure Analysis Report will indicate if the:

  • Connection flowed through the NetScaler properly
  • StoreFront server isn’t responsive
  • Specific application or desktop was unable to launch

When this customer interaction ended, everyone was very satisfied. Together, and in less than two hours, we had solved a difficult challenge. The Goliath Application Availability Testing Service for Citrix provided them with peace of mind that they would “know first” if a reservation specialist was going to have issues.

[/fusion_text][/fusion_builder_column][fusion_builder_column type=”1_3″ layout=”1_3″ spacing=”” center_content=”no” link=”” target=”_self” min_height=”” hide_on_mobile=”small-visibility,medium-visibility,large-visibility” class=”” id=”” background_color=”” background_image=”” background_image_id=”” background_position=”left top” background_repeat=”no-repeat” hover_type=”none” border_size=”0″ border_color=”” border_style=”solid” border_position=”all” border_radius=”” box_shadow=”no” dimension_box_shadow=”” box_shadow_blur=”0″ box_shadow_spread=”0″ box_shadow_color=”” box_shadow_style=”” padding_top=”” padding_right=”” padding_bottom=”” padding_left=”” margin_top=”” margin_bottom=”” animation_type=”” animation_direction=”left” animation_speed=”0.3″ animation_offset=”” last=”no”][fusion_content_boxes layout=”icon-with-title” columns=”1″ title_size=”” heading_size=”2″ title_color=”” body_color=”” backgroundcolor=”” icon=”” iconflip=”” iconrotate=”” iconspin=”no” iconcolor=”” icon_circle=”” icon_circle_radius=”” circlecolor=”” circlebordersize=”” circlebordercolor=”” outercirclebordersize=”” outercirclebordercolor=”” icon_size=”” icon_hover_type=”” hover_accent_color=”” image=”” image_id=”” image_max_width=”” link_type=”” button_span=”” link_area=”” link_target=”” icon_align=”left” animation_type=”” animation_delay=”” animation_offset=”” animation_direction=”left” animation_speed=”0.3″ margin_top=”” margin_bottom=”” hide_on_mobile=”small-visibility,medium-visibility,large-visibility” class=”” id=””][fusion_content_box title=”” backgroundcolor=”” icon=”” iconflip=”” iconrotate=”” iconspin=”no” iconcolor=”” circlecolor=”” circlebordersize=”” circlebordercolor=”” outercirclebordersize=”” outercirclebordercolor=”” image=”” image_id=”” image_max_width=”” link=”” linktext=”Read More” link_target=”” animation_type=”” animation_direction=”left” animation_speed=”0.3″ animation_offset=””]

[gravityform id=”106″ title=”false”]

[/fusion_content_box][/fusion_content_boxes][/fusion_builder_column][/fusion_builder_row][/fusion_builder_container][fusion_builder_container hundred_percent=”no” hundred_percent_height=”no” hundred_percent_height_scroll=”no” hundred_percent_height_center_content=”yes” equal_height_columns=”no” menu_anchor=”” hide_on_mobile=”small-visibility,medium-visibility,large-visibility” status=”published” publish_date=”” class=”” id=”” background_color=”” background_image=”” background_position=”center center” background_repeat=”no-repeat” fade=”no” background_parallax=”none” enable_mobile=”no” parallax_speed=”0.3″ video_mp4=”” video_webm=”” video_ogv=”” video_url=”” video_aspect_ratio=”16:9″ video_loop=”yes” video_mute=”yes” video_preview_image=”” border_size=”” border_color=”” border_style=”solid” margin_top=”” margin_bottom=”” padding_top=”” padding_right=”” padding_bottom=”” padding_left=””][fusion_builder_row][fusion_builder_column type=”1_1″ layout=”1_1″ spacing=”” center_content=”no” link=”” target=”_self” min_height=”” hide_on_mobile=”small-visibility,medium-visibility,large-visibility” class=”” id=”” background_color=”” background_image=”” background_image_id=”” background_position=”left top” background_repeat=”no-repeat” hover_type=”none” border_size=”0″ border_color=”” border_style=”solid” border_position=”all” padding_top=”” padding_right=”” padding_bottom=”” padding_left=”” margin_top=”” margin_bottom=”” animation_type=”” animation_direction=”left” animation_speed=”0.3″ animation_offset=”” last=”no”][fusion_imageframe image_id=”41465|1200″ max_width=”” style_type=”” blur=”” stylecolor=”” hover_type=”none” bordersize=”” bordercolor=”” borderradius=”” align=”center” lightbox=”no” gallery_id=”” lightbox_image=”” lightbox_image_id=”” alt=”” link=”/free-trial/goliath-application-availability-monitor-30-day-free-trial/?utm_source=blog&utm_medium=banner&utm_campaign=website-CTAs&utm_content=gaat-airlines” linktarget=”_blank” hide_on_mobile=”small-visibility,medium-visibility,large-visibility” class=”” id=”” animation_type=”” animation_direction=”left” animation_speed=”0.3″ animation_offset=””]https://goliathtechnologies.com/wp-content/uploads/2019/02/Free-Trial-CTA-v2.1-GAAM-1500×486-1200×389.png[/fusion_imageframe][/fusion_builder_column][/fusion_builder_row][/fusion_builder_container]

Why MSPs Need Application Availability Monitoring

Why MSPs Need Application Availability Monitoring

Why MSPs Need Application Availability Monitoring

I’ve lived in the virtualization and cloud world for a really long time. During that time, I’ve also seen the impacts on users when you don’t have a good performance monitoring and troubleshooting system in place. That said, what if you have managed services? Do you understand what challenges managed services providers (MSPs) face when working without a monitoring and troubleshooting tool? How are you effectively resolving common VDI performance as well as connectivity issues?

The Goliath Application Availability Monitor (GAAM) is a powerful solution to help you alleviate some of the most frustrating issues when working with VDI, virtualization, or application delivery in general. Once you use it, you won’t know how you lived without it.

When I first sat down in front of the Goliath management console, I saw how GAAM was used to automatically test the entire infrastructure as well as run tests from all critical endpoints, constantly. Even today, when working with Citrix ecosystems, the Goliath Application Availability monitor is the only tool I’ve found that proactively tells me when, where and why problems are occurring in my environment. From an MSP’s perspective, this not only prevents a lot of headaches but also saves so many hours of troubleshooting by pinpointing the problem for me. Plus, you’ll reduce the number of tickets you have by allowing GAAM to fix problems before end users are impacted.

Before we go too much further, let’s start with the user. Today’s users are much more agile and way more dependent on their desktops and applications running at all times. This is a major reason why VDI performance issues can cause serious issues in a world where ‘slow is the new down.’ From an MSP’s perspective, you really want to try to minimize these issues, but if they occur, be able to resolve and troubleshoot VDI issues as well as overall application delivery. Remember, you’re not only trying to make user experience better, but also make it easier for managed services engineers to troubleshoot faster.

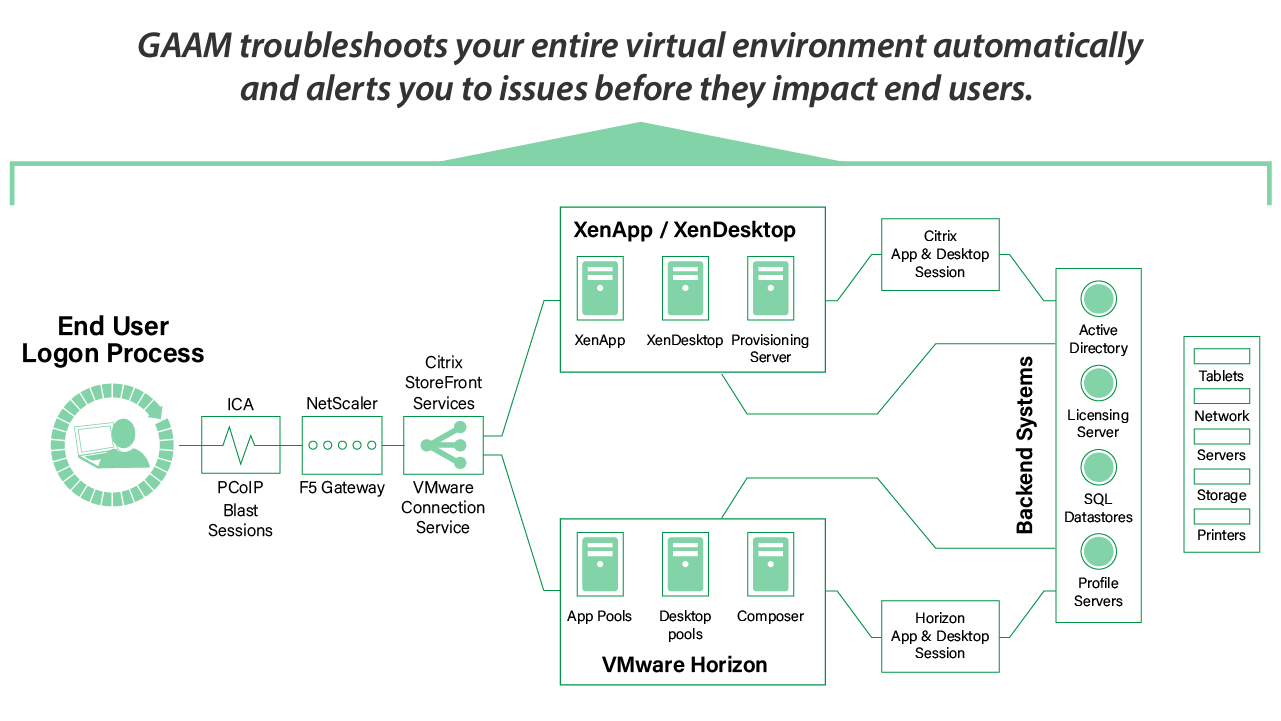
biggest challenges for managed service providers

To that extent, I’ve worked with organizations that take a more legacy approach to managing their application and desktop delivery architecture. Without tools like GAAM, life could get a bit complicated. Let me paint a picture:

  • How do you know if your networks and backend systems are available? How do you know if you find out too late? Your SQL infrastructure is down. And you basically found out because a massive group of users emailed or called you at once. If you’re a managed service provider, this isn’t a fun day. However, this is your life without GAAM. And, it’s not just SQL. There are a myriad of network and backend systems that might fail and bring you to a halt. Is Active Directory functioning? What about your licensing servers? Maybe something went wrong with a NetScaler network connection. The point is that without GAAM, you’re playing a reactive game. Troubleshooting things like VDI connection issues under ‘fire drill’ circumstances isn’t fun. GAAM will absolutely automatically alert you of issues related to Citrix login failure or slowness before the end user ever notices an issue.
  • Parts of your environment are broken, but you’re not sure what they are. Is your vCenter Server operating? Maybe your profile servers are running out of space. Much like the previous point, you won’t know what’s going on until after it starts happening. In this case, you’re causing slowness for both your users and your business. The entire point of GAAM is to find the root cause of end user experience issues before your end users. This also means deeply understanding all of the infrastructure and virtualization components that support both your users and your business. Without GAAM, it’s so much more of a guessing game. Wouldn’t you love to have a system that simply tells you what’s wrong, where to find it, and even how to troubleshoot it? This level of integrated troubleshooting can become a reality when leveraging GAAM.
  • Your apps may not be launching… and you’ll have no idea why without lots of troubleshooting. This isn’t fun. Everything seems to be working, but apps aren’t launching. Is something wrong with Storefront? Are ICA connections dropping like crazy? Even within your VDI sessions, are applications enumerating? Without GAAM, you’re stuck not seeing the big picture and working really hard to focus in on single issues or environmental elements. You basically lose out on both real-time and historic views, to get a complete view of the entire environment, not just a single component.
  • Your applications and desktops are launching slowly, and you’re not really sure why that’s happening. Honestly, this could be even more frustrating than VDI or applications not launching at all. Again, without GAAM, you’ll find yourself going through the same paces to try and figure out why things aren’t working. Maybe your load balancers are misconfigured. Or, maybe something is wrong with licensing. The point is that you’ll have to lift each rock on its own to try and figure all of this out. And, you’ll likely have to log into multiple consoles just to figure it all out. As it stands, GAAM is the only IT ops tool that includes purpose-built technology to integrate key data sources to help IT professionals proactively anticipate, troubleshoot, and prevent end user experience issues. Without it, the process to find out what’s wrong is painstakingly slower.

In my own experience, one of the biggest challenges for managed service providers is the ability to be proactive. So, removing a legacy way of managing users, applications, and their resources will make your virtualization ecosystem much healthier. Sitting down in front of the Goliath management console, I quickly saw that GAAM gave me a much broader perspective into so many key variables within a virtualization architecture. So, you’re now aware what life is like without GAAM.

What happens when you introduce this kind of tool into your own environment? At it’s core, the Goliath Application Availability Monitor (GAAM) acts as an automatic early warning system for pretty much everything we’ve discussed so far. For example, the Goliath Virtual User (which can be deployed at any location) proactively accesses Citrix XenApp/XenDesktop and other mission-critical applications just like a real user. This provides hard data on what will happen when an actual user, doctor or nurse tries to access important patient records. IT professionals are alerted immediately if an issue occurs, and the system provides specific data on where the failure happened. This allows IT to identify root cause and troubleshoot quickly before actual users are impacted. Plus, the system will give you screenshot evidence so you can actually see where there might be VDI performance issues or if there are challenges with connectivity.

Managed services aren’t just about delivering content and resources. It’s about being proactive and supporting an agile business. In my own experience, GAAM will tell you where and why issues are occurring, unlike other application performance monitoring software. From there, you can integrate both troubleshooting as well as control. Administrators can see what tests will be run, from each location, and manage testing by shift, or by event, and even block out maintenance windows to avoid unnecessary alerts. All of this is handled from a central, simple interface with no need for scripting or intervention at the end points themselves.

Do you want to make your life easier, better support your users, and have a happier business? Use GAAM as a real solution to help you alleviate some of the most frustrating issues when working with VDI, virtualization, or application delivery in general. Once you use it, you won’t know how you lived without it.

Click the link below to access a Free Trial of the software mentioned in this blog!