
MTM Meets Customer SLAs with Goliath Technologies

MTM Meets Customer SLAs with Goliath Technologies

[fusion_builder_container hundred_percent=”no” hundred_percent_height=”no” hundred_percent_height_scroll=”no” hundred_percent_height_center_content=”yes” equal_height_columns=”no” menu_anchor=”” hide_on_mobile=”small-visibility,medium-visibility,large-visibility” class=”” id=”” background_color=”” background_image=”” background_position=”center center” background_repeat=”no-repeat” fade=”no” background_parallax=”none” enable_mobile=”no” parallax_speed=”0.3″ video_mp4=”” video_webm=”” video_ogv=”” video_url=”” video_aspect_ratio=”16:9″ video_loop=”yes” video_mute=”yes” video_preview_image=”” border_size=”” border_color=”” border_style=”solid” margin_top=”” margin_bottom=”” padding_top=”” padding_right=”” padding_bottom=”” padding_left=””][fusion_builder_row][fusion_builder_column type=”1_1″ layout=”1_1″ spacing=”” center_content=”no” link=”” target=”_self” min_height=”” hide_on_mobile=”small-visibility,medium-visibility,large-visibility” class=”” id=”” background_color=”” background_image=”” background_position=”left top” background_repeat=”no-repeat” hover_type=”none” border_size=”0″ border_color=”” border_style=”solid” border_position=”all” padding_top=”” padding_right=”” padding_bottom=”” padding_left=”” dimension_margin=”” animation_type=”” animation_direction=”left” animation_speed=”0.3″ animation_offset=”” last=”no”][fusion_text columns=”” column_min_width=”” column_spacing=”” rule_style=”default” rule_size=”” rule_color=”” class=”” id=””]

“At MTM, we deploy the Goliath Application Availability Monitor as an advanced troubleshooting tool. GAAM’s automatic screenshots allow us to see a picture of the exact point at which the application launch failed, then ID and resolve the underlying problem that caused the application or infrastructure to be unavailable quickly, and we can share the images directly with customers, so they can see exactly what issue occurred and where.”
-Joe Byrne, Director of NOC Technologies, MTM Technologies

MTM Technologies, Inc., is a Citrix Service Provider and leading national provider of next-generation IT solutions and services to Global 2000, enterprise organizations, and mid-size companies. MTM is a National Platinum Citrix Partner and VMware Premier Partner. MTM, who maintains all four Citrix specializations, works with Citrix to assist companies with the demands of today’s mobile workforce. Whether on premise or in the cloud, by combining Citrix’s product suite with MTM’s branded professional and managed services enterprise, commercial and government organizations are provided a robust solution to serve their mobile workers their applications and data in a highly secure manner.

Click Here to see if Goliath can Power your Recurring revenue services business

The Customer’s Infrastructure: Citrix XenServer 6.5, Citrix XenApp, XenDesktop & Citrix NetScaler


The Business Challenge: Current Monitoring Vendor has Performance Visibility Gaps with Citrix XenServer, XenApp, XenDesktop, NetScaler, & End User Experience

As a Managed Service Provider (MSP), MTM Technologies designs SLAs that are unique to each customer but essentially focus on delivering a positive end user experience. MTM’s monitoring backbone to deliver these services had been Nimsoft for infrastructure and SolarWinds for the Network.

These are good tools but neither product offers purpose-built functionality for Citrix Monitoring and specifically the ability to proactively determine if there is a problem with Citrix Logon Initiation, Logon Duration or Session Performance.

Goal of Being Proactive

There are products that can tell MTM if something failed after the fact, but they needed something to give them advance warning before Citrix end users were impacted. MTM deemed it critical to use proactive Citrix Monitoring technology to ensure that performance-based SLAs were met when offering Remote Infrastructure Monitoring (RIM), Monitoring as a Service (MAAS)  and Desktop as a Service (DaaS).

Unsure of Root Cause of End User Experience Issues

MTM wanted absolute visibility and predictability in their Citrix Performance Monitoring for XenApp and especially around the Citrix End User Experience in situations where they were providing RIM, MaaS or delivering DaaS. Essentially, MTM needed advance notice and alerts when logon initiation failures or slowness occurred.

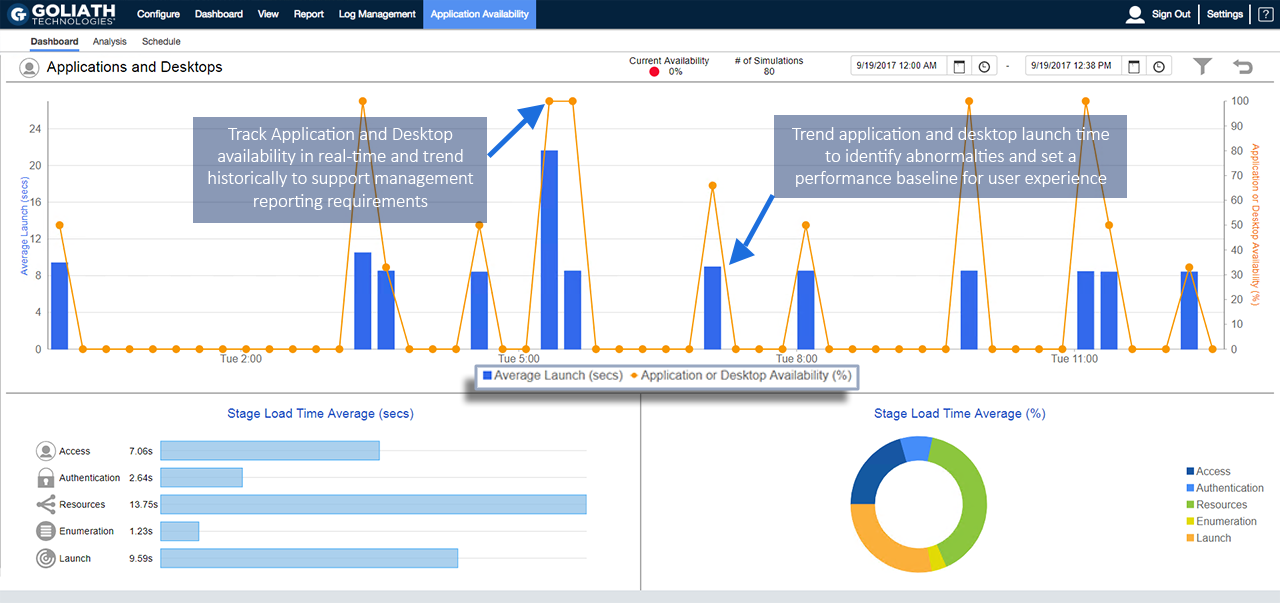
Then, if there was a failure or degradation of service, MTM needed the correlated data from the end point through the NetScalers and the backend Citrix delivery architecture to determine the root cause so they could deploy remediation actions. This required logon simulation alerting and logon duration analysis as depicted in the below real-time screen shot of the Goliath Application Availability Monitor.

Real-time Application Availability Dashboard

GAAM Application and Desktop Dashboard

Many times the logon initiation process was successful but the logon process was sluggish. In this case, MTM used the logon duration drill down which dissects 33 different, though interrelated, steps in the logon process as depicted below. Armed with this logon duration detail MTM was able to pinpoint the true root cause of logon duration slowness and resolve the issue permanently—before end user performance is impacted.

Real-time Citrix Logon Duration Drill Down

GPM Citrix Logon Duration Drill down

“Citrix is Slow!” Alerts

With MTM supporting many customers and SLAs, some running over 2500 VDI sessions, they needed alerts for the ambiguous “Citrix is slow” complaint.

Citrix CSPs, and especially Citrix Administrators, know that Citrix gets the blame when performance issues arise, which is why comprehensive Citrix monitoring is critical. Often, the true culprit of session performance issues are some element in the supporting infrastructure. MTM’s other base requirement was to have the visibility into the entire Citrix delivery infrastructure by having two unique capabilities; one, a drill down into a specific Citrix user’s session and two, a break down of the HDX latency and session performance in real-time.

Real-time Citrix ICA/HDX Channel Drill Down

Citrix ICA/HDX Channel Drill Down

Real-time Citrix Session Performance Drill Down

Citrix Session Performance Drill Down

Finally, MTM needed to run historical reports and analysis to determine long-term performance trends because if they couldn’t see what happened, it would be impossible to be proactive. The requirement was to have the necessary reports available out-of-the-box. Armed with this data, MTM can customize Goliath’s Citrix Monitoring software to send threshold-based alerts and simultaneous remediation actions before end users are affected.

Citrix XenApp & XenDesktop End User Experience Report

XAXD End User Experience Report

Citrix XenApp & XenDesktop Logon Duration Report

XAXD Logon Duration Report

Citrix XenApp & XenDesktop ICA Latency Report

XAXD ICA Latency Report

Goliath has 66 of these types of performance and end user experience reports for Citrix and VMware, all of which come out-of-the-box with Goliath Performance Monitor.

The Solution: Choose a Proactive End-to-End Solution

Based on MTM’s criteria to proactively manage end user experience and satisfy their SLAs—ICA Latency, Logon Simulation, Logon Duration, and Session Performance—Goliath was the clear solution.

MTM chose Goliath Technologies Citrix Monitoring to solve visibility gaps, end user experience issues and meet SLAs, but there was more than just deep metrics that factored into their decision, which include:

  • Service Level Agreements: Goliath’s suite of proactive IT performance monitoring and management technology allows MTM to meet their SLAs.
  • Multi-tenancy: MSPs like MTM can use Goliath to proactively manage environments by criteria such as customer, location, application, infrastructure, etc.
  • Master “Intelligent” Agent: This is an ultra-low resource utilization (0.1% CPU) agent to monitor remote locations without maintaining an external connection. The “Intelligent” Agent gathers numerous metrics like the ICA/HDX Channel and the Hypervisor, and it can execute remediation actions on XenApp Servers, XenDesktop VDI, Citrix Role Servers, & End Points.
  • MSP Management: Centralized management of the end user experience for MSPs.
  • Share Data with other Tools: Can send data to Nimsoft, SolarWinds, etc.
  • Custom Reporting: Real-time dashboards and historical reports that are branded with MTM’s logo.

As you can see from the above screenshots, MTM is able to use Goliath Performance Monitor and the Goliath Application Availability Monitor for Citrix to gain complete visibility into the end users’ sessions, XenServer and XenDesktop performance data, and end user experience metrics in a single view.

With Goliath, MTM can trend utilization over time and see exactly what is happening with remote users to troubleshoot the root cause of performance issues and proactively deploy remediation actions to ensure a positive end user experience.

Further Reading

Goliath Performance Monitor for Citrix XenServer

Goliath Performance Monitor for Citrix XenApp & XenDesktop

Goliath Application Availability Monitor for Citrix

Independent Reviews of all Goliath Technologies’ Proactive IT Operations Software

[/fusion_text][/fusion_builder_column][/fusion_builder_row][/fusion_builder_container]

Simplify Troubleshooting your IT Healthcare Virtual Architecture with Goliath Technologies

Simplify Troubleshooting your IT Healthcare Virtual Architecture with Goliath Technologies

Simplify Troubleshooting your IT Healthcare Virtual Architecture with Goliath Technologies

Virtual architecture is complex to standup and deploy, and when it comes to the ability of your support team to fix an issue it needs to be done fast and when possible – proactively.  This is extremely important from the business user perspective in all organizations, but even more importantly in healthcare where there is another person’s health and possibly even their life on the line.   With this level of criticality, It becomes imperative to simplify troubleshooting your IT Healthcare virtual architecture, and the Electronic Medical Record (EMR) applications such as Epic and Cerner to name a couple.  Let’s dive deeper into this topic by first discussing a real-world problem scenario, then do some discovery around how users will work around the system if they do not get what they need, and then we will do some discovery around how purpose-built monitoring can ensure the uptime of your EMR deployment.

Getting the right care – let’s start with the Emergency Room

The last thing your Information Technology team wants to hear is that the healthcare provider cannot do their patient charting, medicine administration, or place an order for a chest x-ray for a critical patient in the emergency room due to slow performance when they are trying to login to the system.  In all cases, the emergency room will come with the need for treating their patients quickly.  Waiting is not an option.

I have personally experienced this first hand when I brought one of my children to the emergency room of a medical facility that used an EMR application.  My son ended up with a cut that required stitches, and while it’s been many years now, this scenario showcases how a slow EMR application can impact the healthcare providers ability to do their job efficiently.  The emergency room care provider was very professional, but the login to the system was moving very slowly.  So much that they were standing there with the pain medication in hand for my child, but couldn’t move forward until the system let them in. Thankfully in this case it worked out ok, but what would happen in a more critical situation?

According to a survey of 50 healthcare institutions by the International Journal of Medical Informatics (Sittig DF, et al. Int J Med Inform. 2014;83:797-804, http://bit.ly/2xSHOAy), 96% of responders reported at least one unplanned downtime in the three years prior to the survey. More alarming, 70% had at least one unplanned downtime that lasted more than eight hours.  This survey highlights that my ER experience was not an isolated incident, and that we need both awareness and action to ensure that the technology IT departments provide is stable and meeting the needs of the enterprise.

It is the IT departments responsibility to know what is going on even before the user (healthcare provider) reports a problem.  Ensuring that all patients are cared for in an expedited manner when needed.  Having a monitoring solution that can report logon initiation, logon duration, and session performance is significant. It’s also important that the data is accurate, meaningful, and actionable.  This ensures that the EMR application can maintain and/or resume the performance it needs to successfully treat patients.

Working around the System

To the IT professional or business leader there is nothing more disheartening than to learn that their healthcare professionals have stopped reporting problems because they just gave up on the issues, and/or that they found a way around the issue. The risk with both examples is high, because hospitals need to deploy systems that ensure security and HIPAA compliance.  IT Professionals also strive to ensure their systems run well, and if they don’t know something is wrong they cannot fix it.  That’s where a great monitoring tool can come in.  Even if your users aren’t reporting the problems, a monitoring tool can proactively let the IT support team know they have issues to resolve.  The downstream impact of this is that the patients seen by the hospital will get the healthcare they deserve.

Thoughts for consideration

Healthcare organizations spend hundreds of millions of dollars ensuring that they have selected and then implemented the right EMR solution for their patient care.  The teams that deploy and support these systems must ensure that once the system is in use that they can keep their healthcare providers up and running proactively.  When this is not possible, then it can be critical to get the healthcare provider up and running as quickly as can be.  In healthcare an EMR application is critical, but don’t forget that purpose-built monitoring tools can help ensure that every patient cared for gets the care they need and deserve, because the healthcare providers have the systems online and available to do their jobs successfully.

Last, but not least it is worth some time to watch this video that highlights the point that there is so much more that needs to be evaluated when troubleshooting a problem. When one of your users calls in and states “EPIC is not working”, or “Cerner is slow” finding and answer quickly is critical, so they can get back to serving patients as soon as they can.

Now think about this more, can you relate to what it means to ensure that your healthcare providers can put the patient first no matter what?  Having the right tools that keeps both the patient at heart, and allows for quick resolution of problems is necessary.

Sponsored by Goliath Technologies

Goliath Technologies provides IT operations software with embedded intelligence & automation that enables users of Desktop Virtualization to anticipate, troubleshoot & prevent end-user experience issues regardless of where IT workloads or users are located. In Healthcare IT this translates into better patient care.

Click here to read this blog post on 24×7 IT CONNECTION


MSPs Use Application Availability Monitor for Troubleshooting

MSPs Use Application Availability Monitor for Troubleshooting

MSPs Leverage the Goliath Application Availability Monitor for Advanced Troubleshooting and Increased Revenue

The Goliath Application Availability Monitor (GAAM) received significant interest from many industries and clients when it was launched in October 2017, but Managed Service Providers such as MTM, HCL, CSC, CDK Global, CloudShape, Dizzion, and others embraced this new technology quickly and enthusiastically.  This technology is purpose-built to help ensure SLA’s are achieved by reducing end user experience issues when Citrix XenApp, Citrix XenDesktop or VMware Horizon are part of the service offering. In addition, most service providers use the application availability monitor functionality as the basis for a new recurring revenue offering “daily application availability testing service”; an automatic daily confirmation that applications and infrastructure are ready and available before end users get to work.

John Byrne, MTM Technologies Director of NOC Technologies, shares why:

“At MTM, we deploy the Goliath Application Availability Monitor as an advanced troubleshooting tool,” Byrne explained.  “GAAM’s automatic screenshots allow us to see a picture of the exact point at which the application launch failed, then ID and resolve the underlying problem that caused the application or infrastructure to be unavailable quickly, and we can share the images directly with customers, so they can see exactly what issue occurred and where.”

Figure 1: The Goliath Application Availability Monitor automatically logs in from any end point; providing information on where an issue occurred, a screenshot documenting the specific error, and details in the failure point in the logon process.

Managed Service Providers use the Goliath Application Availability Monitor to meet strict SLA’s when delivering Desktop as a Services (DaaS), Platform as a Service (PaaS), Software as a Service (SaaS), Infrastructure as a Service (IaaS), Remote Monitoring and Management (RMM) and other services. Pre- empting issues and solving them before end users are impacted is the “holy grail” for service providers, but if issues do occur, quick resolution is a close second in terms of priority.

The key to this new technology is the Goliath Virtual User which can be installed at any location or endpoint to provide an automated early warning system for any application issues. This monitoring can be scheduled according to the specific needs of either, the MSP or the end customer — such as time or shift based monitoring, maintenance/patched based monitoring, or constant monitoring throughout the working day. The below reference architecture shows how an MSP can deploy the Goliath Virtual User to monitor multiple end points – though specific use cases may use a different model.

msp application availability monitor

The monitoring provides a valuable early warning system, but Goliath’s automatic screenshot feature provides an additional immediate impact for MSPs. The Goliath Application Availability Monitor allows companies to schedule an automated logon from any system endpoint and exactly mirrors the logon sequence users use to access the system, while capturing screenshots to document the success, or failure, and specific error messages at each step of the process. These screenshots capture the specific root cause of a problem, whether it’s a network, infrastructure, or an application issue, and provides administrators with objective evidence detailing the error and failure point.

“We use this technology as part of our client demonstrations and offer the screenshots as an option in our customer portal,” Byrne continued. “The new user interface is tremendous – and well-designed for proactive management and troubleshooting of end user experience issues.”
In addition to troubleshooting, MSPs see another significant benefit – meeting and exceeding their Service Level Agreements (SLAs). Providers automatically schedule the logons to occur at critical times, such as before a major shift change. Then, they either document system availability, or proactively fix issues – before customers are impacted. The screenshots then allow them to clearly and automatically document the resolved problems, even if they are resolved before clients see them directly.

“The screenshot feature is a real value-add for us,” concluded Byrne.

Some MSP’s now offer this “daily test” of application and infrastructure availability to customers as a high margin recurring revenue service. In many cases this serves as easy entry to acquire new customers because the prospective customer doesn’t need the same level of commitment required for other full-service offerings such as DaaS, MaaS, IaaS, etc. This early warning system offers a way to both generate revenue and build an initial relationship with a new customer that can be expanded over time.

MSPs are unique in that they have SLAs to provide availability for external customers, but any IT administrator can use the same tool to automatically document system status or troubleshoot issues for internal clients and stakeholders – all before end users even know the problem exists. The application can be deployed for Citrix XenApp and XenDesktop, VMWare Horizon, AWS, Azure, as well as EMR/EHR applications like Epic, Cerner, Meditech, AllScripts  

To learn more about the Goliath Application Availability Monitor or to request a personalized demonstration of how this technology can help you proactively solve issues before your customers or end users are impacted, please contact us at techinfo@goliathtechnologies.com or start a free 30-day Trial by clicking the link below.

Technical Review: Examining Goliath’s Early Warning System for Citrix, VMware, & RDS

Technical Review: Examining Goliath’s Early Warning System for Citrix, VMware, & RDS

Technical Review: Examining Goliath’s Early Warning System for Citrix, VMware, & RDS

The Goliath Application Availability Monitor is an industry-first software that provides organizations of all sizes with an early warning system, alerting IT administrators of access and performance issues with business-critical applications before their end users ever attempt to logon.

IT professionals everywhere can now receive customizable alert notifications and warnings to exact failure points in the workflow for desktop virtualization platforms like Citrix, VMware or RDS. To proactively monitor the availability of Citrix XenApp & Xen Desktop, VMware Horizon View, and Microsoft RDS effectively, the Application Availability Monitor must confirm that the applications will be available and that the entire delivery infrastructure and workflow are executing properly. This is all made possible by the Goliath Virtual User – a small-footprint technology that automates the process of logging on to Citrix/VMware Horizon/RDS to confirm application availability, and that the workflow is operating properly. The Goliath Virtual User is deployed on-premises or remotely (wherever end users are located), automatically logs on like a real user to confirm applications will launch and is configured exactly like a real user with the same permissions within Active Directory.

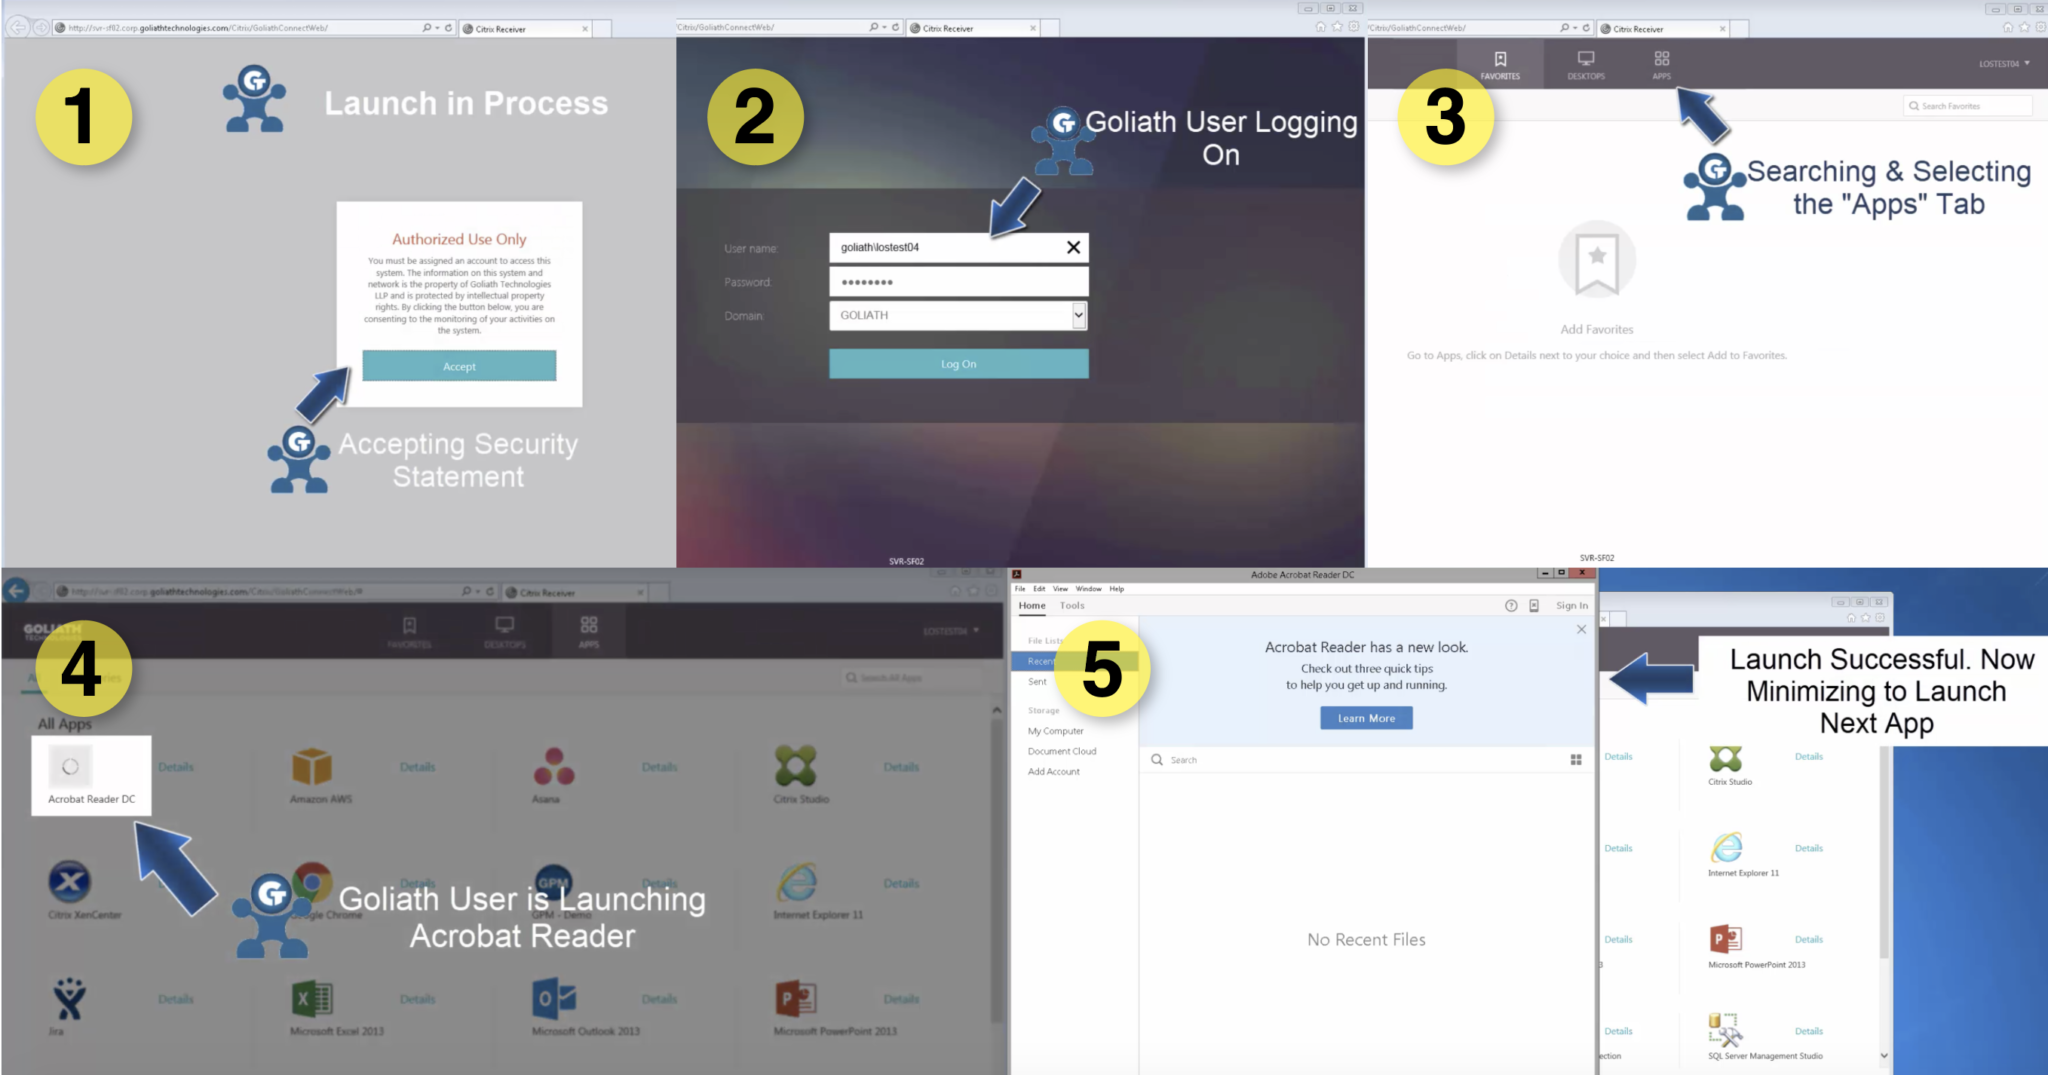
Below is a depiction of the Goliath Virtual User in action – automatically initiating a connection to the application and in doing so confirming that the entire application delivery infrastructure and workflow are working properly to launch applications:

confirm the application delivery infrastructure

Screenshot Analysis

When each phase of the logon process for Citrix XenApp/XenDesktop, VMware Horizon View or Microsoft RDS is executed by the Application Availability Monitor, a screenshot is taken to provide visual evidence and objective proof of logon success or logon failure. This allows IT administrators to see the potential impact that typically elusive items like disclaimers, error messages, secondary authentication, and multiple launch sequences may have on the outcomes of the logon process. This provides objective evidence of the root cause of the logon issue that can be shared with management, vendors, and counterparts to end finger pointing and put permanent fix actions in place.

As illustrated below, you can quickly drill down to investigate failures right from the application availability dashboard by clicking on the magnifying glass. In just three steps, you can then see where the logon issues occurred during the logon process and what the issue was:

screenshot analytics

  1. In this case, failure occurred at the launch stage (marked by the ‘1’)
  2. The screenshot (2) proves that the application failed to launch and shows the root cause of the Citrix workflow and application launch failure as being the result of a licensing problem
  3. By navigating to the “Details” or “Analytics” section (3), we can see that the launch failed at the point of verifying that Internet Explorer launched

Scheduling and Automation

Unlike other technologies, the Goliath Application Availability Monitor has built-in logon scheduling functionality. This provides an easy to use, templated approach to constructing launch sequences. This gets you scheduled in minutes – not hours – without the need for custom scripting or recording sequences. The Application Availability Monitor can be scheduled to run automatically and continuously across multiple applications, determining logon performance across different locations and/or different types of users as needed. For example, it can run throughout the day so your IT staff will know immediately if/where there is a problem and at which stage of the process the problem is occurring. Launches can be scheduled to execute, for example, before Doctors or Nurses start their shift so that healthcare IT can be alerted to issues before these end users feel the impact of an application/desktop performance issue.

Below is an example of the scheduling display showing the ease of setup and the frequency of launches throughout the day:

scheduling

scheduling #2

Alerting

Alert notifications can be sent immediately if a validation of the workflow fails by email, SNMP, SYSLOG, or to the customer’s ticketing or enterprise monitoring solution. This allows critical uptime and availability information to be delivered prior to end users knowing there is a problem.

Below is an example of the alert notification feature within the scheduling display:

early warning system altering

Deployment

The Application Availability Monitor can be deployed however you desire. You can deploy it on-premises or in the cloud to identify individual, site or geographic application availability issues. Because the logon attempts can be scheduled and remotely deployed, it can be strategically positioned at the location users sign in from to provide visual proof regarding logon success, logon failure or logon slowness from the user’s unique access location. This way, IT admins can diagnose whether issues are location specific or global in nature, providing the help desk with relevant data regarding availability and performance.

This is an illustration of how a deployment is configured for ten remote locations that logon daily to centralized applications hosted in the internal cloud.

proactive deployment architecture for application availability monitor

Remediation

There is also an integrated remediation engine within the Goliath Application Availability Monitor. The remediation engine is customizable; however, it comes with a large number of prebuilt rules geared toward quick, automated resolution and prevention of further issues or complications. For example, a XenApp server could be set into maintenance mode to prevent future failed logon attempts, or key dependencies on role servers could be checked to automate the investigation process.

Below is a screenshot of the remediation feature within the scheduling display:

remediation

Integration with Goliath Performance Monitoring

The Goliath Application Availability Monitor is also fully integrated into the Goliath Performance Monitor. As a result, IT professionals not only can identify application availability issues but also the root cause. Other technologies called “logon simulators” may be able to simply ‘identify’ a logon failure, but without full integration into an enterprise monitoring product, there is no way of identifying why a performance issue occurred. If applications are being monitored individually, they are being gauged separately and may look fine. It is only when executing the fully integrated launch process by multiple users – including remote access, application/desktop availability and the delivery infrastructure – that you not only trigger issues but see contextual, objective evidence of where the root cause of these issues is actually sourced.

Summary

Goliath’s Application Availability Monitor is the only solution available today that proactively gauges logon performance by exercising the entire delivery infrastructure in concert exactly as an end user does. The Goliath Virtual User can do this over the same network using the same profile permissions/setup as the actual end user. The result is an advanced warning system that accurately reports issues, empowering administrators to identify and resolve end user experience issues related to logon initiation and logon duration before productivity is hindered.

The technology can deliver these capabilities through proactive, real-time threshold-based alerts, the live dashboard, detailed drill-downs/screenshots for logon process analysis and rich historical reporting.

Those features, combined with a fast and simple process for deployment, configuration and operation allow organizations to preemptively identify issues before users are impacted. It also enables them to identify where the issue is occurring, pinpoint the root cause and collaborate toward resolution faster than ever before.

Want to see a personalized demo or access a 30-day free trial of
the Goliath Application Availability Monitor? Contact us today!

techinfo@goliathtechnologies.com  |  (855) 465-4284

User Story: VMware Horizon View DaaS Provider Proactively Confirms Desktop Availability

User Story: VMware Horizon View DaaS Provider Proactively Confirms Desktop Availability

User Story: VMware Horizon View DaaS Provider Proactively Confirms Desktop Availability

The Organization:  A VMware Horizon View DaaS Provider

The Organization’s Infrastructure:  VMware vSphere & VMware Horizon

The Organization’s Performance Monitoring Products: Goliath Application Availability Monitor for VMware Horizon Monitoring


Tech Challenge: Early Warning Before Users Know if VMware Horizon Desktops are not Available

A large desktop-as-a-service (DaaS) and remote VMware vSphere monitoring managed service organization delivers VMware Horizon View applications and desktops. One of the key challenges for this service provider has been not having the ability to provide advance warning when VMware Horizon application and desktop availability is compromised. This had an impact on the DaaS provider’s ability to meet their Service Level Agreements. It was critical to deliver a solution to their clients that would provide them with an early warning as to when application and/or desktop logon issues were going to arise – before actual end users are impacted.

The Solution

Goliath Technologies’ Application Availability Monitor for VMware Horizon View was selected by the DaaS provider to deliver VMware Horizon View availability testing services to their customers. This selection was made because of the unique, industry-first, monitoring capabilities that only Goliath could deliver.

These capabilities are listed below:

  • Scheduled Logon, Desktop and Application launches for VMware Horizon View
  • Real-Time Alerting – Early warning alerts to VMware Horizon View application or desktop failure or logon/launch slowness
  • Reporting – On-demand or scheduled historical analysis of launch success and failure
  • Dashboard – Real-time view of logon tests and success/failure validation

The service does not require software in the customer’s data center and is fully delivered by the service provider to the customer. Logon and launch validation is provided in the form of real-time metrics, real-time alerts, and historical reports. The service allows for the testing of customer published applications and/or virtual desktops on a scheduled basis, regardless of the testing location.

The Summary: Preventing End User Logon Issues – Before They Happen

Goliath now provides the technology and enterprise capabilities that the DaaS provider requires to deliver a truly proactive VMware Horizon View application and desktop availability service. The service launches VMware Horizon View-delivered applications and desktops, and tests and confirms that they are available – all before production end users try to access VMware Horizon View. If the logon fails or is slow, alerts are generated before end users are impacted. The result is that the service provider can now offer application and desktop availability testing to their customers that ensure they will meet their Service Level Agreements.