Law Firm With 5,000 Users Troubleshoots Citrix Latency Issues

Law Firm With 5,000 Users Troubleshoots Citrix Latency Issues

How We Did It User Story: Law Firm With 5,000 Users Troubleshoots Citrix Latency Issues

In this post, the Goliath Support Team shares a story and troubleshooting workflow pertaining to a law firm with over 5,000 users. The law firm leveraged Goliath to troubleshoot Citrix and solve slow Citrix XenApp session issues by using the End-User Experience and HDX Latency Reports in Goliath Citrix Monitoring.

Problem: IT Operations lacked visibility into the end-user experience of 5,000 people in 30 offices  

Last week, I was working with a customer who is using Goliath for Citrix Monitoring and troubleshooting of their XenApp 7.6 environment. This law firm uses our technology to ensure their end users around the world have seamless access to their Citrix-delivered applications.

With 30 offices located worldwide and a Citrix XenApp environment of over 5,000 users, it was challenging for their IT Operations team to understand how many end users were experiencing poor performance, in what frequency and, most importantly, why.

By configuring our Citrix Monitoring and troubleshooting technology, the IT team was able to track and report on people who had poor Citrix end-user experience by using two reports that come out-of-the-box with Goliath’s Citrix Monitoring:

These reports are part of Goliath’s Citrix troubleshooting functionality and were scheduled to run on a daily and weekly basis and sent via email to the law firm’s Citrix Admins.

Step 1: Configure the End-User Experience Report & Schedule to Run Automatically for Citrix Troubleshooting

The first step in the process to understand the end-user experience was to bring in their Citrix XenApp 7.6 environment through our ‘First Time Run Wizard’ using our APIs for Citrix. Once the Citrix infrastructure was listed in the inventory, we deployed our Intelligent Agent.

The first report they configured was the End-User Experience Report, which is essential for Citrix troubleshooting. This report was scheduled to run every morning at 9:30 am so it landed in the Citrix Admins’ inbox first thing in the morning.

With the End-User Experience Report, the Citrix Admins could quickly determine if:

  1. An end user was experiencing Citrix session slowness (as indicated by HDX latency)
  2. The Citrix slowness was caused by a slow connection speed
  3. Citrix itself determined the connection to be slow and adjusted experience accordingly

The Citrix End-User Experience Report also provided information around the connection times and what application was used. So, instead of being caught off guard by calls from frustrated end users complaining about slow Citrix sessions, the administrator can be more proactive, anticipate the issues and, ultimately, prevent them altogether.
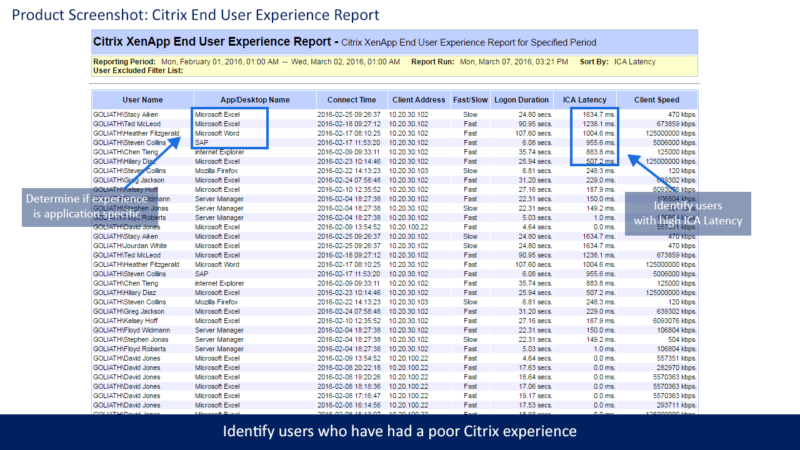
XAXD End User Experience Report

Step 2: Configure the HDX Latency Report & Troubleshoot Citrix End-User Experience Issues

The other Goliath report this law firm used was the Citrix HDX Latency Report. Citrix ICA latency is a key metric because when we look at performance and end-user experience problems, if there is a problem stemming from a server’s ability to process the user’s request or their connection, it will manifest in our Citrix troubleshooting functionality for Citrix HDX latency. 

This is the starting point for determining if the user’s poor experience issue is caused by something related to what they are doing or how they are connecting to the environment. In addition to scheduling the Citrix End-User Experience Report, the Citrix HDX Latency Report is also scheduled to run on a weekly basis and sent to the Citrix Admins.

Step 3: Set Threshold-Based Alerting for All End Users with Latency Higher than 300 Milliseconds

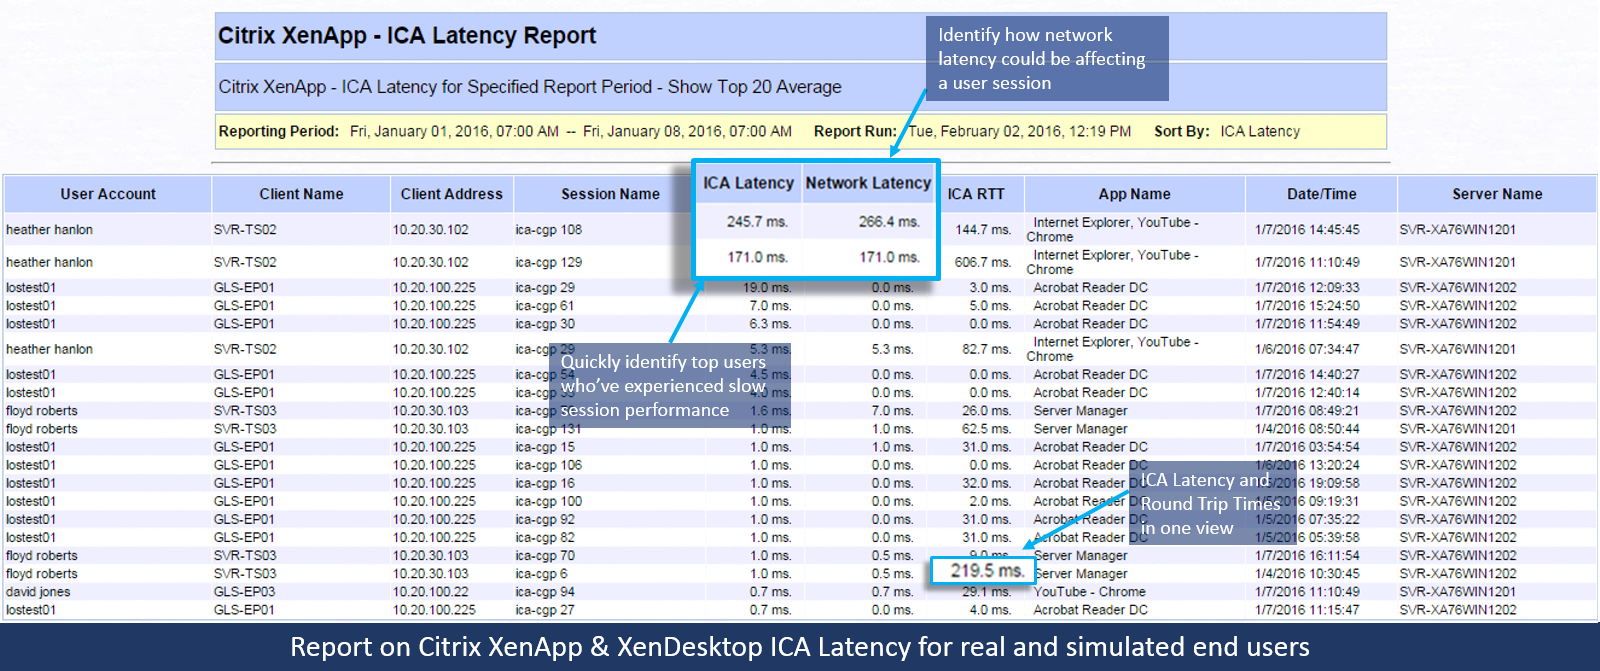
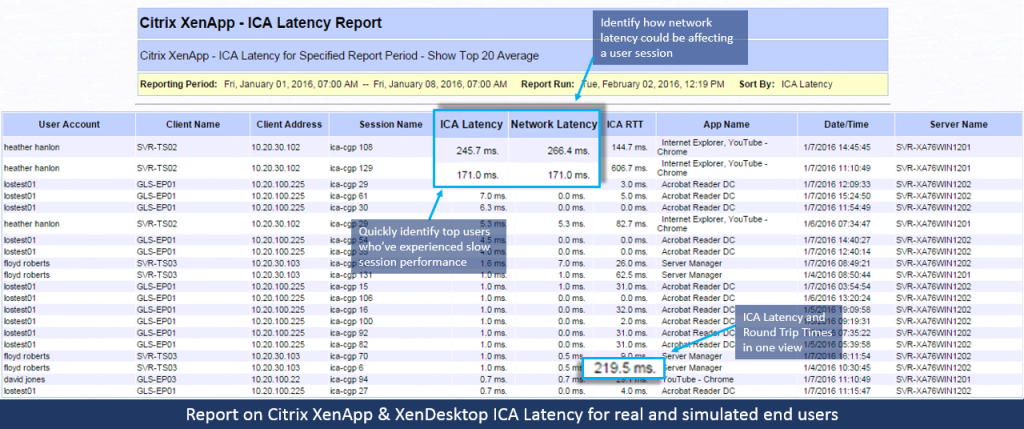
To enable proactive Citrix troubleshooting, the law firm configured the Citrix HDX Latency Report to show all users with a latency higher than 300 milliseconds, which is the threshold at which users begin noticing performance problems.

In multiple cases, the law firm identified network latency as being the cause of HDX latency for users from certain offices and used this report to forward the evidence (the report) onto the network team and management.

Citrix XenApp - ICA Latency Report

By using these reports in Goliath’s Citrix troubleshooting functionality, the Citrix Admins were able to quickly end the finger pointing between teams and provide objective evidence to management and the end users when performance complaints are reported.  The Citrix End-User Experience and HDX Latency Reports continue to be leveraged to maintain visibility to the Citrix end-user’s experience without depending on a phone call and to provide objective evidence when problems occur.

Tech Guide Upload Promotion

For more information on how Goliath Performance Monitor can help you and your team be proactive and anticipate, troubleshoot and prevent end user experience issues:


Send us an email: techinfo@goliathtechnologies.com

Give us a call: 855-465-4284
About the Author: 

MTM Hits End User Uptime SLAs with Goliath Technologies

MTM Hits End User Uptime SLAs with Goliath Technologies

MTM Meets Customer SLAs with Goliath

 
MTM Technologies Logo

“Goliath Technologies is the only truly proactive end-to-end monitoring and management solution for Citrix. Goliath provides deep metrics and analysis necessary for organizations to get ahead of issues in the three key areas that often cause pain for end users: logon initiation, logon duration and session performance.” 
– John Byrne, MTM Technologies Director of NOC Technologies

MTM Technologies, Inc., is a Citrix Service Provider and leading national provider of next-generation IT solutions and services to Global 2000, enterprise organizations, and mid-size companies. MTM is a National Platinum Citrix Partner and VMware Premier Partner. MTM, who maintains all four Citrix specializations, works with Citrix to assist companies with the demands of today’s mobile workforce. Whether on-premises or in the cloud, by combining Citrix’s product suite with MTM’s branded professional and managed services enterprise, commercial and government organizations are provided a robust solution to serve their mobile workers their applications and data in a highly secure manner.

The Customer’s Infrastructure: Citrix XenServer 6.5, Citrix XenApp, XenDesktop & Citrix NetScaler

The Business Challenge: Current Monitoring Vendor has Performance Visibility Gaps with Citrix XenServer, XenApp, XenDesktop, NetScaler, & End User Experience

As a Managed Service Provider (MSP), MTM Technologies designs SLAs that are unique to each customer but essentially focus on delivering a positive end user experience. MTM’s monitoring backbone to deliver these services had been Nimsoft for infrastructure and SolarWinds for the Network.

These are good tools but neither product offers purpose-built functionality for Citrix Monitoring and specifically the ability to proactively determine if there is a problem with Citrix Logon Initiation, Logon Duration or Session Performance.

Goal of Being Proactive

There are products that can tell MTM if something failed after the fact, but they needed something to give them advance warning before Citrix end users were impacted. MTM deemed it critical to use proactive Citrix Monitoring technology to ensure that performance based SLAs were met when offering Remote Infrastructure Monitoring (RIM), Monitoring as a Service (MAAS)  and Desktop as a Service (DaaS).  

Unsure of Root Cause of End User Experience Issues

MTM wanted absolute visibility and predictability in their Citrix Performance Monitoring for XenApp and especially around the Citrix End User Experience in situations where they were providing RIM, MaaS or delivering DaaS. Essentially, MTM needed advance notice and alerts when logon initiation failures or slowness occurred.

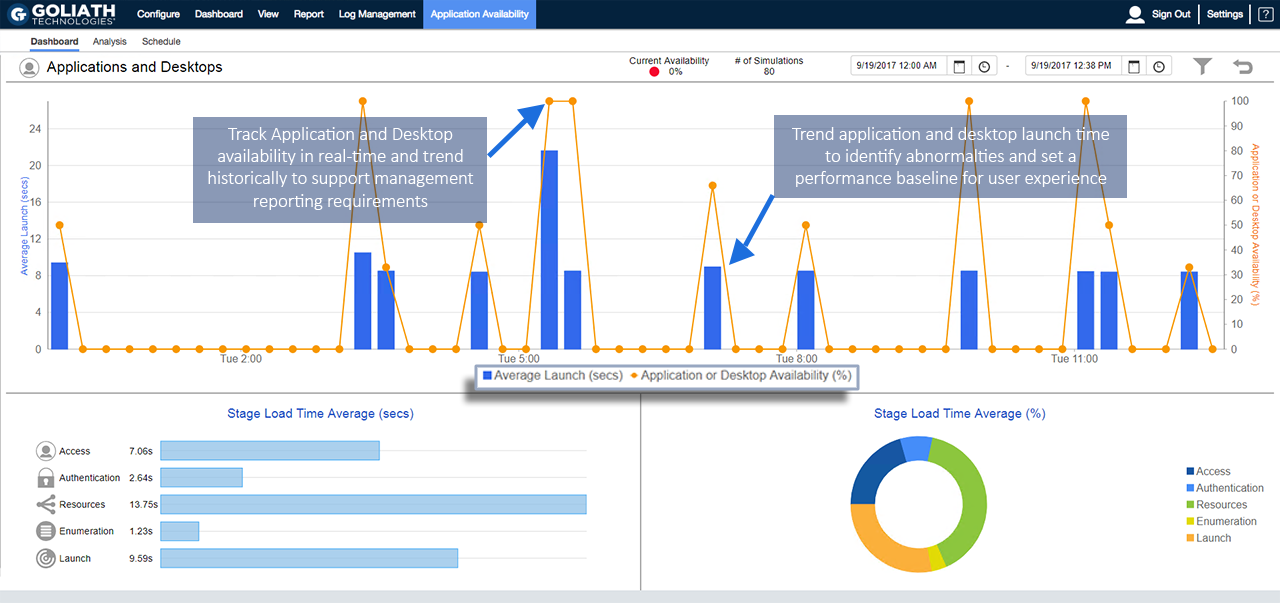
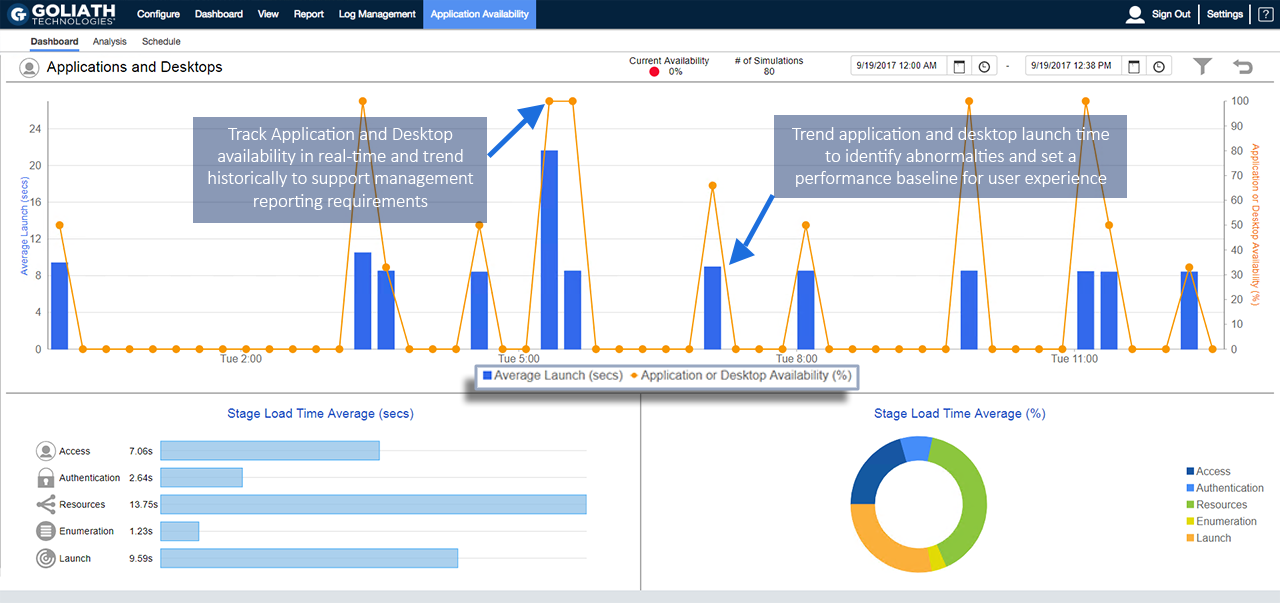
Then, if there was a failure or degradation of service, MTM needed the correlated data from the end point through the NetScalers and the backend Citrix delivery architecture to determine the root cause so they could deploy remediation actions. This required logon simulation alerting and logon duration analysis as depicted in the below real-time screen shot of the Goliath Application Availability Monitor. 

Real-time Application Availability Dashboard

GAAM Dashboard

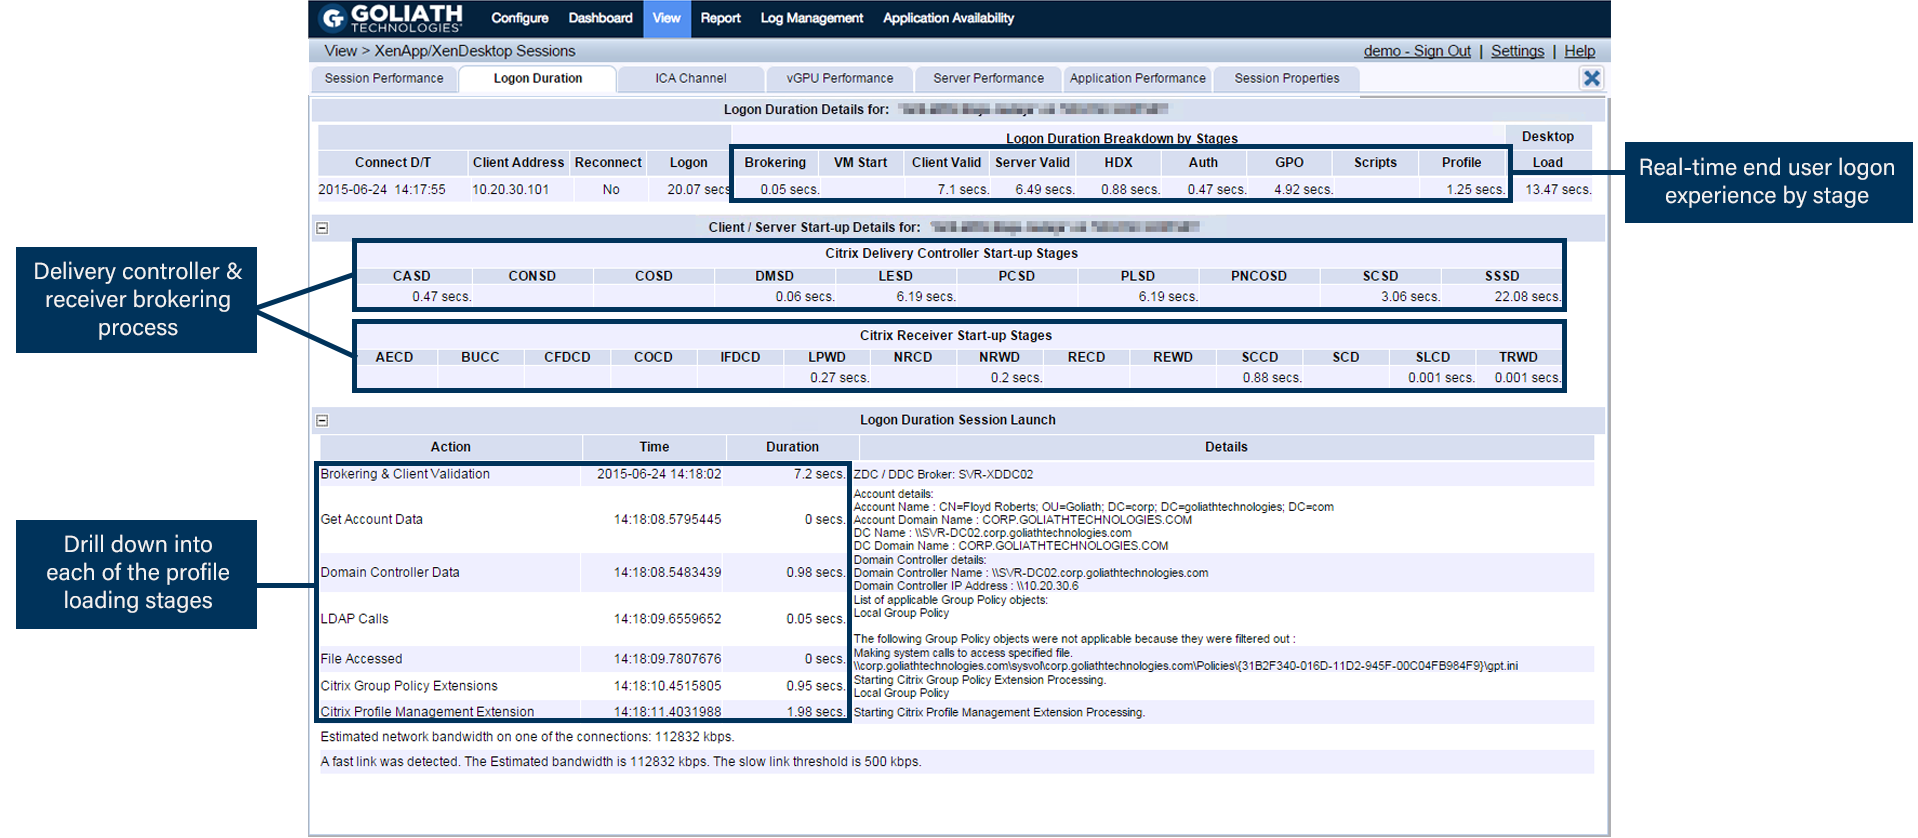
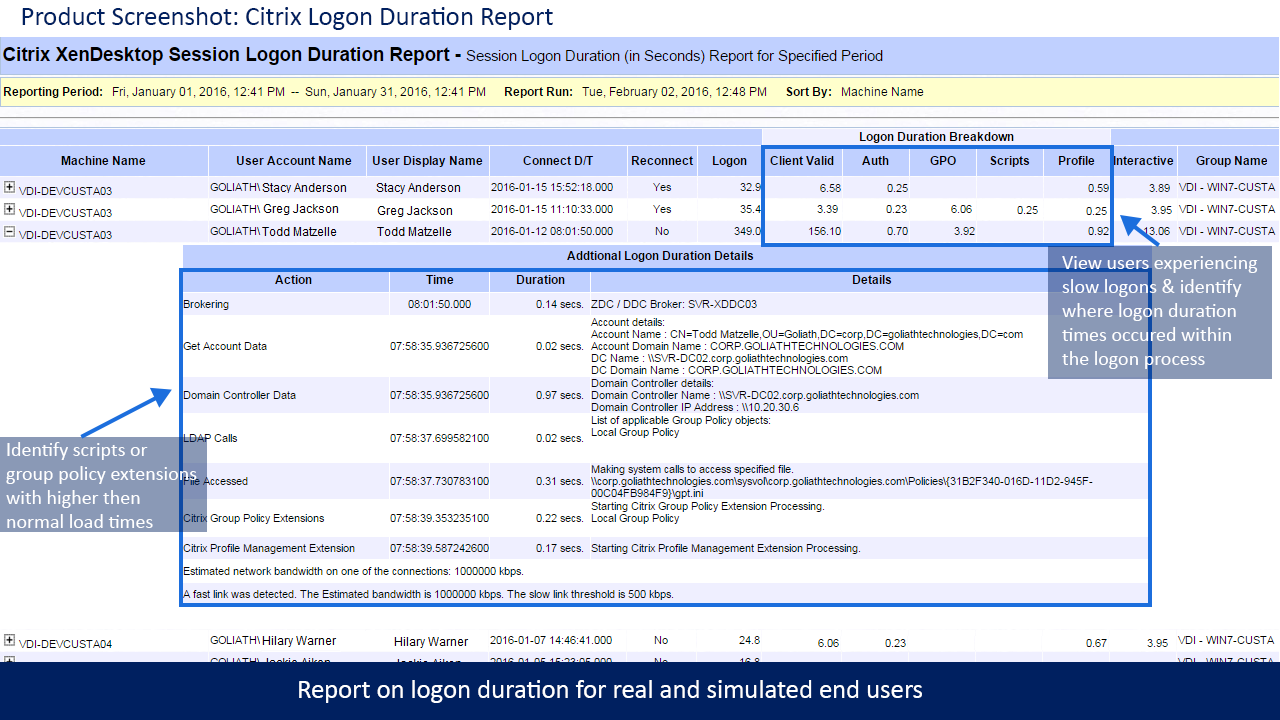
Many times the logon initiation process was successful but the logon process was sluggish. In this case, MTM used the logon duration drill down which dissects 33 different, though interrelated, steps in the logon process as depicted below. Armed with this logon duration detail MTM was able to pinpoint the true root cause of logon duration slowness and resolve the issue permanently—before end user performance is impacted. 

Real-time Citrix Logon Duration Drill Down

GPM Citrix Logon Duration Drill Down

“Citrix is Slow!” Alerts

With MTM supporting many customers and SLAs, some running over 2500 VDI sessions, they needed alerts for the ambiguous “Citrix is slow” complaint.

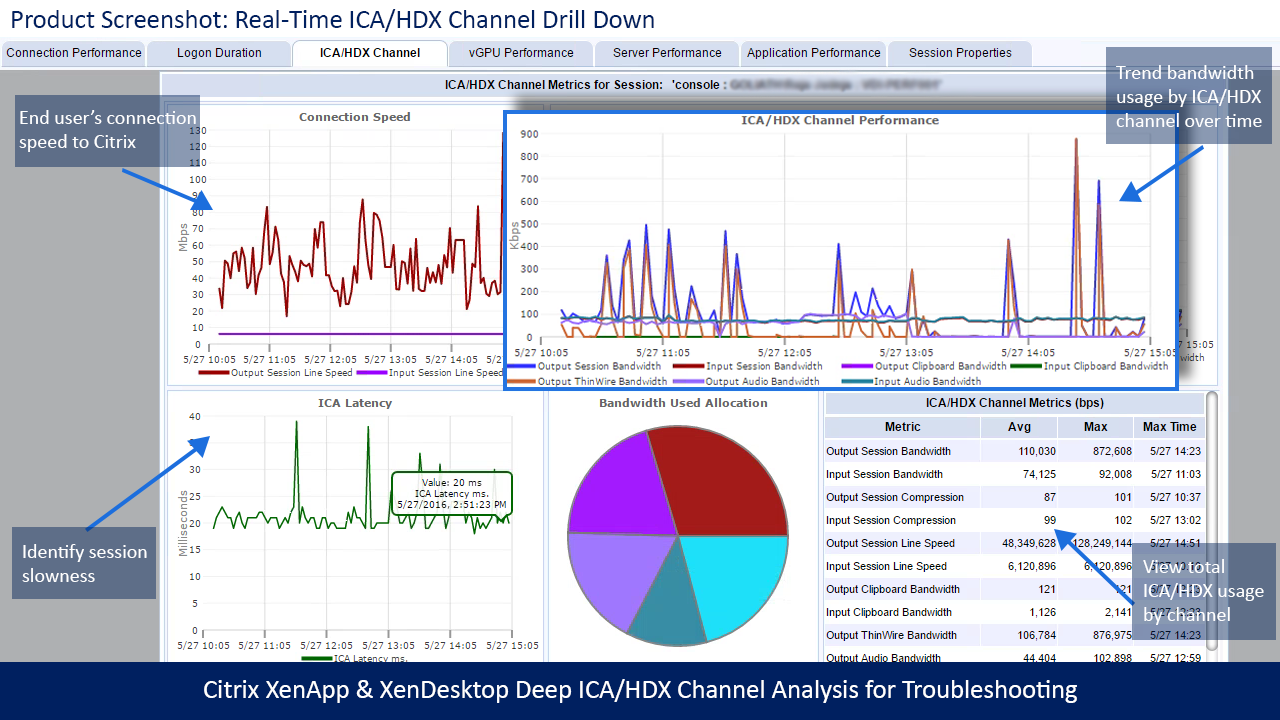
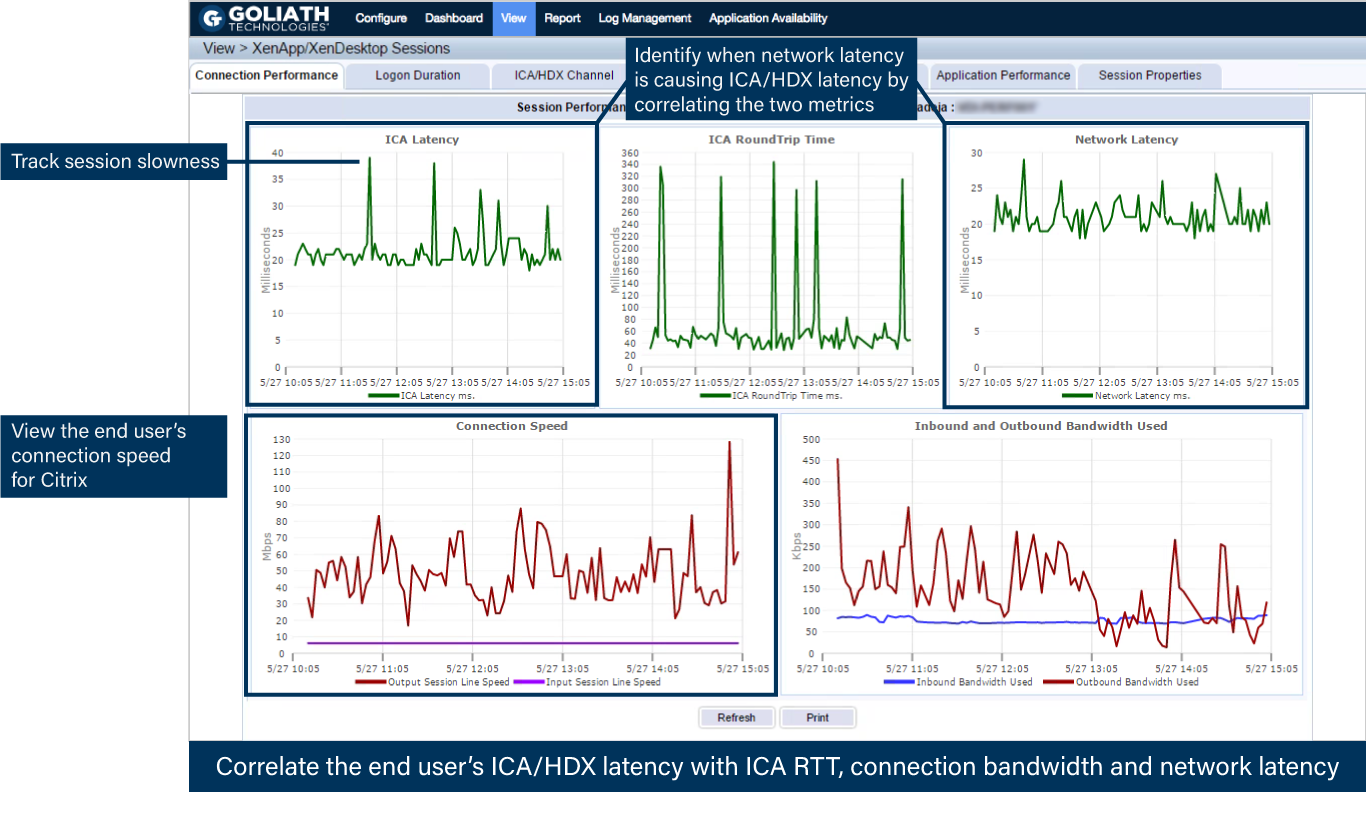
Citrix CSPs, and especially Citrix Administrators, know that Citrix gets the blame when performance issues arise, which is why comprehensive Citrix monitoring is critical. Often, the true culprit of session performance issues are some element in the supporting infrastructure. MTM’s other base requirement was to have the visibility into the entire Citrix delivery infrastructure by having two unique capabilities; one, a drill down into a specific Citrix user’s session and two, a break down of the HDX latency and session performance in real-time.

Real-time Citrix ICA/HDX Channel Drill Down

Citrix ICA/HDX Channel Drill Down

Real-time Citrix Session Performance Drill Down

Citrix Session Performance Drill Down

Finally, MTM needed to run historical reports and analysis to determine long-term performance trends because if they couldn’t see what happened, it would be impossible to be proactive. The requirement was to have the necessary reports available out-of-the-box. Armed with this data, MTM can customize Goliath’s Citrix Monitoring software to send threshold-based alerts and simultaneous remediation actions before end users are affected. 

Citrix XenApp & XenDesktop End User Experience Report

XAXD End User Experience Report

Citrix XenApp & XenDesktop Logon Duration Report

XAXD Logon Duration Report

Citrix XenApp & XenDesktop ICA Latency Report

Goliath has 66 of these types of performance and end user experience reports for Citrix and VMware, all of which come out-of-the-box with Goliath Performance Monitor.

The Solution: Choose a Proactive End-to-End Solution  

Based on MTM’s criteria to proactively manage end user experience and satisfy their SLAs—ICA Latency, Logon Simulation, Logon Duration, and Session Performance—Goliath was the clear solution.  

MTM chose Goliath Technologies Citrix Monitoring to solve visibility gaps, end user experience issues and meet SLAs, but there was more than just deep metrics that factored into their decision, which include:

  • Service Level Agreements: Goliath’s suite of proactive IT performance monitoring and management technology allows MTM to meet their SLAs.
  • Multi-tenancy: MSPs like MTM can use Goliath to proactively manage environments by criteria such as customer, location, application, infrastructure, etc.
  • Master “Intelligent” Agent: This is an ultra-low resource utilization (0.1% CPU) agent to monitor remote locations without maintaining an external connection. The “Intelligent” Agent gathers numerous metrics like the ICA/HDX Channel and the Hypervisor, and it can execute remediation actions on XenApp Servers, XenDesktop VDI, Citrix Role Servers, & End Points.
  • MSP Management: Centralized management of the end user experience for MSPs.
  • Share Data with other Tools: Can send data to Nimsoft, SolarWinds, etc.
  • Custom Reporting: Real-time dashboards and historical reports that are branded with MTM’s logo.

As you can see from the above screenshots, MTM is able to use Goliath Performance Monitor and the Goliath Application Availability Monitor for Citrix to gain complete visibility into the end users’ sessions, XenServer and XenDesktop performance data, and end user experience metrics in a single view.

With Goliath, MTM can trend utilization over time and see exactly what is happening with remote users to troubleshoot the root cause of performance issues and proactively deploy remediation actions to ensure a positive end user experience.

product discussions for MSPs promotion

Law Firm Reduces Citrix Support Tickets by 60%

Law Firm Reduces Citrix Support Tickets by 60%

How We Did IT

Law Firm Reduces Citrix Support Tickets by 60%


Law Firm banner

“We reduced Citrix ticket escalations by 60%”

– Pete Chim, Systems Engineer

Infrastructure

Citrix XenApp

Challenge

A national law firm has attorneys and staff attempting to access Citrix delivered applications from all over the world. Because they use various methods to connect to the internet, the connection quality is variable and Citrix monitoring and troubleshooting tools are essential. The firm has users connecting from remote offices, homes, hotels, and even airplanes, which can result in connection and latency issues. This leads to an increase in the number of end users contacting the help desk for advice on improving the quality of service, even when the cause was a low-quality hotel or airline network.

The majority of these Citrix tickets were escalated to their Citrix Architects, who are responsible for deploying Citrix but continually were being pulled to respond to end user tickets as the help desk didn’t have the knowledge or tools to resolve end user complaints related to “Citrix is Slow” complaints. In addition, they did not have the objective evidence in the form of reports or documentation to prove root cause of the problem to those end users.

Solution

The IT team needed a Citrix End User Experience Monitoring & Troubleshooting solution that would allow them to do two things:

  1. Offer them granular visibility root cause of slowness when using Citrix and Citrix delivered applications.
  2. Provide the help desk with an easy to use troubleshooting tool that would empower non-Citrix experts to troubleshoot and potentially resolve end user performance issues. And, if the issue could not be resolved because it was solely related to end user behavior talk to the end user provide documentation to prove root cause was either a result of their actions or their connection into Citrix.

As a Citrix Platinum customer, this law firm did have Citrix Director deployed in their Citrix XenApp environment. As with most free utilities, these are designed to provide some metrics but it didn’t offer the broad and deep visibility necessary to anticipate, troubleshoot and document Citrix end user experience issues. Citrix Director, beyond being inadequate from a Citrix monitoring and troubleshooting perspective, was too confusing to be useful to the help desk staff.

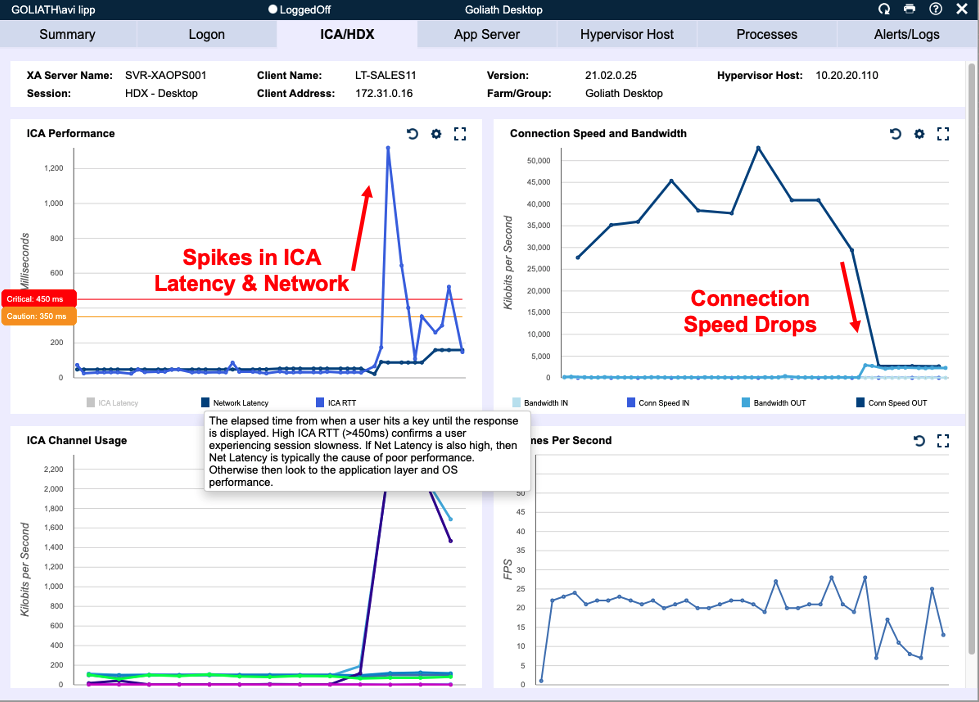
After looking at several Citrix monitoring and troubleshooting vendors, the firm decided to do a proof of concept with Goliath Technologies. They discovered that Goliath gave—in real-time—very deep and complete visibility into the Citrix end user experience. Of particular value was its ability to quickly identify the root cause of a remote user’s issue—whether it is the connection, stage of the logon sequence, or another program competing for network resources, such as YouTube, Netflix, or a gaming site. With Goliath’s Citrix monitoring and troubleshooting solution, they can see, in real time, if a user’s slow connection is due to internet network quality or a competing program as seen below.


Screenshot

Results

Armed with Goliath’s Citrix monitoring and troubleshooting solution, the IT team was poised to integrate it into their internal processes so they could improve the end user experience through faster response times, improved communication, and an empowered help desk. Pete Chim, Systems Engineer, put a checklist in their ServiceNow knowledge base so the help desk staff could use Goliath’s Citrix monitoring and troubleshooting to conduct a series of checks against this knowledge base when a ticket was opened from an end user complaining about Citrix slowness or disconnects. Now, the help desk staff resolves issues more easily on their own, which has reduced the need to escalate to Citrix engineers by an estimated 60%.

Browse Citrix Webinars

ABOUT ORGANIZATION

The firm has a reputation for providing high-quality legal services across a wide range of practice areas, including corporate law, real estate, litigation, and intellectual property.

Headquarters location: Northeast, USA
Founded: over a century ago
Employees: >500
Industry: Legal

Guest Post: ICA Latency Isn’t Enough

Guest Post: ICA Latency Isn’t Enough

Guest Post: ICA Latency Isn’t Enough

This post is republished on our blog with permission from Alexander Ervik Johnsen, Blogger, Senior Solution Architect, Technology Evangelist, Author and Speaker, based in Oslo – Norway. The original post appears here on Alexander’s blog. Check out Alexander’s latest blog around the topic of Citrix ICA.

Troubleshooting End User Experience with Advanced Citrix ICA/HDX Metrics and Analysis

By: Alexander Ervik Johnsen

“Citrix is slow” is one of the most common end user complains that frustrates both the end users themselves and the support teams and administrators tasked with resolving the issue.  The challenge is finding the key metrics that identify the true root-cause of the problem so that Citrix XenApp and XenDesktop administrators can proactively monitor, troubleshoot and prevent end user experience issues quickly and confidently.

The ICA/HDX remoting protocol delivers critical applications and resources to users across geographic distances and various connection mediums on different devices.  This means the network layer is enormously responsible for delivering a good end user experience.  For this reason, many people and monitoring solutions use ICA Latency as their end-all measure for understanding end user experience issues over Citrix ICA/HDX.  It’s a convenient and broadly available, but to truly understand what specific factors are contributing to the problem, you need a tool that breaks down ICA Latency into its detailed components. 

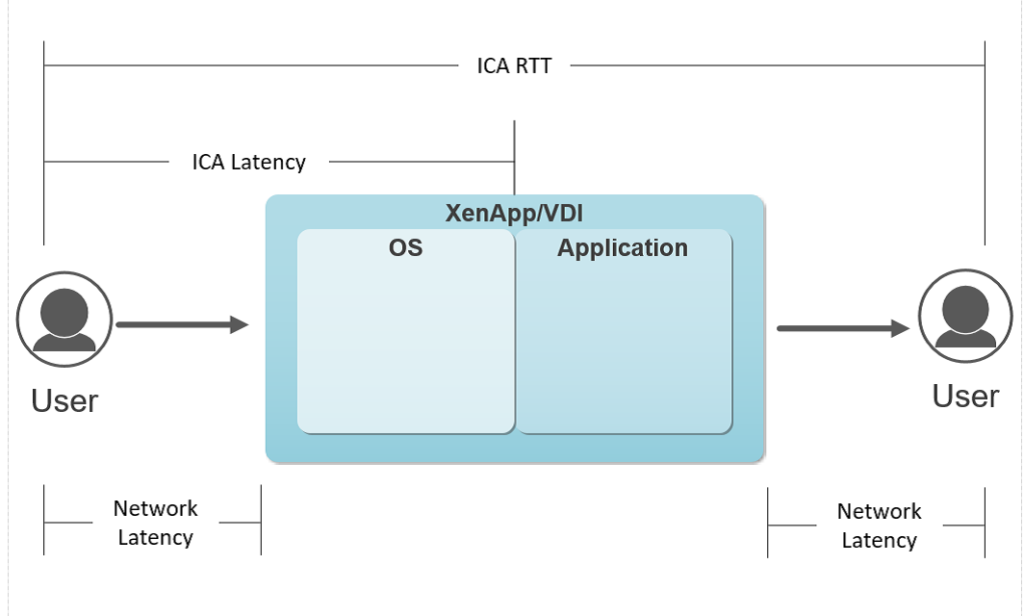
ICA Latency is the time from when a user executes a keystroke or mouse click to when it is processed on the session host.  It includes both network latency and any delay on the session host to process this request.  To best understand the cause of end user issues, administrators require an application that can break out and track these sub-components separately to identify and address the true root-cause.

ICA Round Trip Time (RTT) is the elapsed time from when the user hits a key until the response is displayed back at the end point, as calculated by the session experience monitoring service. The difference between the ICA Latency and RTT is the application processing time on the session host.  

ICA Network Latency is the amount of time it takes data to reach the server.  ICA Network Latency may be higher than ICA Latency, as underlying Citrix protocols are designed to will smooth out ICA Latency spikes to improve experience for the end user.  The delta between ICA Network Latency and ICA Latency can be attributed to server performance.

By breaking ICA Latency into ICA RTT and ICA Network Latency, IT Administrators can take the general complaint ‘Citrix is slow’ and quickly identify specific reasons driving that issue – be that bandwidth, server performance, or application performance issues.  Using this information and more detailed metrics available from Goliath Performance Monitor, administrators can confidently take specific action to remediate problems with the network, or with resource issues at the server.

For more information on how to confidently troubleshoot end user experience issues using Citrix ICA/HDX please download our whitepaper: 


Separate Troubleshooting Products from Monitoring Utilities

Separate Troubleshooting Products from Monitoring Utilities

Selecting a Citrix Monitoring Vendor? After doing that often over the last 15 years I Developed These “Litmus Test” Questions To Help

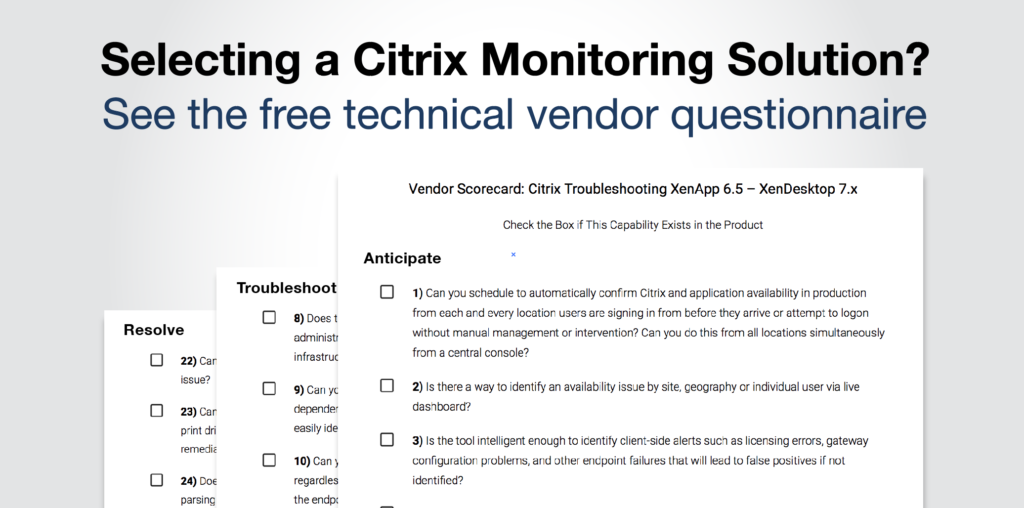
If you have a Citrix environment there will come a time when you have to troubleshoot an issue or two– an obvious understatement. As an IT Administrator and Consultant, I often found my monitoring solution would give me performance metrics but wouldn’t help me troubleshoot the root cause of a performance issue because they just didn’t get enough detail and couldn’t deliver it in a way that allowed me to avoid an issue or objectively prove root cause. Frustrated, I thought of all the missing data, blind spots and failure points and developed a series of 26 questions that would determine, before I purchased a solution, if the vendor could get the specific details and render them in such a way that I would be able to isolate root cause and resolve the issues I had experienced. In other words, IF the vendor WOULD be able to troubleshoot an issue when the time came.

Every monitoring vendor says that they can monitor everything—HDX, Logon Process, End User Experience—but the devil is in the details, and there are a lot of details. So, I tell the vendor to put aside the marketing feature presentation and just tell me if they can do the following 26 things. It is in a Yes/No answer form because I want problems avoided or fixed. No credit for “partial” SLA’s in IT.    

Vendor Scorecard: Citrix Troubleshooting XenApp 6.5 – XenDesktop 7.x

Check the Box if This Capability Exists in the Product
Download the Questions Here

Anticipate

  • 1) Can you schedule to automatically confirm Citrix and application availability in production from each and every location users are signing in from before they arrive or attempt to logon without manual management or intervention? Can you do this from all locations simultaneously from a central console?

  • 2) Is there a way to identify an availability issue by site, geography or individual user via live dashboard?

  • 3) Is the tool intelligent enough to identify client-side alerts such as licensing errors, gateway configuration problems, and other endpoint failures that will lead to false positives if not identified?

  • 4) Can you trigger alerts based on thresholds, events, and failures, and then execute automated remediation actions to resolve those problems?

  • 5) Does the solution allow for dynamic grouping and policy assignment to ensure that proactive rules are assigned accordingly upon migration (i.e. hybrid cloud)?

  • 6) Can the solution allow me to know when a system level issue will have an upstream impact on user experience from a single dynamic screen?

  • 7) Can the technology monitor and alert on file level changes, including file/folder growth, cut/copy/paste actions and specific file edits?

Troubleshoot

  • 8) Does the technology have the ability to gather data and analytics from the entire stack so an administrator can determine an end user’s experience and trace that back to the underlying infrastructure element impacting it?

  • 9) Can you see your entire Citrix environment in one graphical view that shows the dependencies and relationship between Citrix & supporting IT elements, so at a glance you can easily identify the location or IT element that is experiencing a performance issue?

  • 10) Can you isolate as the root cause of a logon duration issue and identify root cause regardless of where it manifests from? Some example of this include, Citrix Receiver startup on the endpoint, waiting for session host readiness, policy execution of the specific policy, DNS resolution during the ICA/HDX connection creation, or any of the other 33+ stages?

  • 11) Can you drill into session logon to know how long the domain controller takes to obtain GPOs and determine if they are applicable?

  • 12) Can you troubleshoot the root cause of random consistent slowness and isolate it as an unreliable Wi-Fi connection or available connection speed to the endpoint for Citrix?

  • 13) When troubleshooting can the technology correlate slow ICA Round Trip Time directly to storage performance on a specific datastore, or hypervisor host CPU Ready issues that the session host resides on?

  • 14) Can you analyze and compare logon, connection, and session performance for both on premise and/or cloud workloads to identify and troubleshoot end user experience issues?

  • 15) Does the solution support rapid deployment for environments where cloud bursting is leveraged for temporarily increasing available compute resources?

  • 16) Can the technology provide visibility into ICA Round Trip Time, ICA Latency, Network Latency and session bandwidth available? Can it help to identify the root cause of session slowness as either the network connection, the underlying systems infrastructure performance, or application performance?

  • 17) Does the technology provide me with visibility into user activity via ICA channels and application usage statistics? For example, does it allow me to correlate high Thinwire bandwidth utilization directly to the user watching YouTube from Chrome in session?

  • 18) Can performance counter data from monitored resources be graphically presented, historically trended and analyzed for root cause analyses of performance related issues?

  • 19) Can your solution generate a report of all user’s sessions from the last 6 months? Can it identify if the sessions were active vs idle?

  • 20) Does the technology allow for the visibility to troubelshoot down to the endpoint? This includes performance monitoring, alerting and event log analysis.

  • 21) Can you furnish me with at least two references that will speak to how they used your product to isolate root cause and troubleshoot issues or avoid them completely?

Resolve

  • 22) Can you generate reports to prove that an issue is an infrastructure, resource, or Citrix issue?

  • 23) Can you generate root cause reports that show faults or errors causing application failures, print driver problems, user GPO faults, and configuration problems such that strategic, targeted remediation activities can be initiated?

  • 24) Does the solution provide a comprehensive log (syslog and event log) correlation engine for parsing and analyzing log data to find root-cause?

  • 25) Can you put alert resolution instructions or knowledge base in the product so that level 1 support, when an alert is triggered, can resolve issues usually solved by level 3?

  • 26) Can you implement self-healing, auto remediation actions without customization? Such as restarting a service, killing a process, running a script or application?

Total Score         /26         Vendor Name:

Using these questions and this overall “paper evaluation” process allowed me to make the best recommendations for my clients during my time as a Citrix consultant. The reason for this is that the key is to ensure that vendors are questioned deeply about the way the product will assist in troubleshooting and resolving Citrix end user experience and/or performance issues. This is especially true today as there are a multitude of products on the market with the ability to address XenApp and XenDesktop monitoring requirements.

I know the reference question is old school but I would really suggest you speak with customers who used a vendor’s technology to troubleshoot an issue. As a matter of fact the more references the better, and three is generally the magic number. When you talk to the reference, find out what their specific issue was and how they used the product to determine root cause. Also ask about the support they received with deploying and using the product. Quality of support is as important as functionality in the grand scheme of things. The technical people you work with should be experts in the product and the platforms that you are using the product to monitor.