

Forthright Hits 99.9% Citrix Uptime SLAs with Goliath

Forthright Hits 99.9% Citrix Uptime SLAs with Goliath

Forthright

Forthright Hits 99.9% Citrix Uptime SLAs with Goliath

citrix uptime

“Goliath enables us to proactively prevent about 70 Citrix support tickets per day. Their Citrix XenApp Monitoring & Troubleshooting provides us with a centralized view of Citrix, our virtual infrastructure and correlates this with real time end user experience metrics. Coupled with the fact that they have proactive logon simulation functionality, is why we selected Goliath as a critical component in our managed services offerings.”  – Ricardo Ceballos, Director of Enterprise Managed Services, Forthright

As an enterprise managed service provider (MSP), Forthright offers SLAs that are unique to each customer. All of which are focused on maintaining uptime and performance at 99.9% while delivering a positive end user experience. They were facing a challenge as their current XenApp Monitoring Vendor, N-Able, couldn’t provide a way to proactively predict Citrix logon experience and troubleshoot logon failures or slowness. With an infrastructure consisting of VMware, Citrix XenApp, XenDesktop 7.6 they knew they needed a purpose-built tool that would enable them to hit the 99.9% uptime mark on all customer SLAs.


Infrastructure

VMware, Citrix XenApp, XenDesktop 7.6


Challenge

Over the past few years, Forthright has experienced significant demand for their managed services. Many of these clients depend on Citrix to access their mission-critical applications, so tools purpose-built for Citrix XenApp monitoring and troubleshooting were required. These customers wanted commitments or SLAs from Forthright relative to uptime and good end user experience. So the technical team decided they needed specific functionality that would allow them to determine if there is a problem with Citrix Logon Initiation and Logon Duration–before end users were impacted.

In looking for a solution, Forthright’s technical team evaluated a myriad of XenApp monitoring products. To ensure success, there were two crucial elements the XenApp monitoring solution needed to address:

  1. Proactive and/or Preemptive LogonFailure or Slowness Alerting: There are a few products that can tell if something failed after the fact, but they needed something to give them advance warning before end users were impacted. Real-time XenApp monitoring, alerting on thresholds, events, and failures relative to Citrix logons was something that they deemed critical to ensure that performance-based SLAs are met when offering Remote Infrastructure Monitoring (RIM) and Desktop as a Service (DaaS).
  2. Root Cause Analysis and Citrix XenApp Troubleshooting: This is largely a byproduct of the above limitation. Most XenApp monitoring and troubleshooting offerings don’t provide real-time alerting on logon issues because their products simply don’t see or monitor the failure points. They don’t go deep or broad enough into the Citrix XenApp and virtualization layers. As RicardoCeballos, Director of Enterprise Managed Services puts it, “If a XenApp monitoring product can’t see an IT element, then it can’t monitor, alert, or isolate that IT element as the root cause. Simply alerting me that something went wrong – after the fact – and without the detail to isolate and document root cause – is just not helpful.”

Solution

Goliath Application Availability Monitor (GAAM) for Citrix and Logon Duration Troubleshooting was implemented to help Forthright achieve 99.9% uptime on their SLAs.

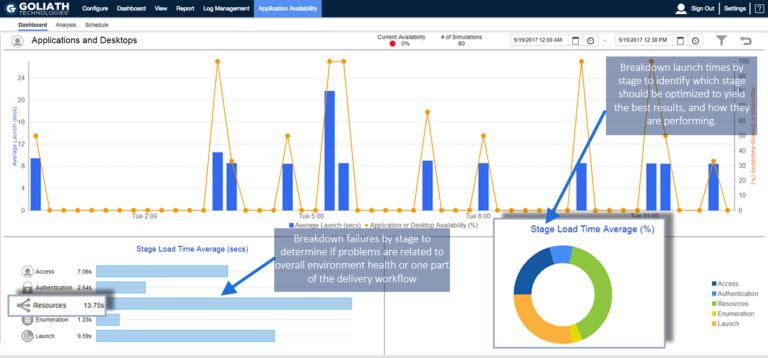
GAAM for Citrix XenApp and XenDesktop was deployed to customer locations and was used both on-premises and remotely to ensure that Citrix applications and desktops would launch. In the image above, you can see the real-time dashboard that displays each logon attempt and whether it was a success or failure.

It is the only technology they could find that conducts simulations such that it confirms the entire Citrix Delivery Infrastructure would work. It tests the NetScaler, Storefront, Delivery Controller, VDI and XenApp Server. This technology will send alerts in real time if there is a failure and is offered both as an on-premises software or a hosted service.

This technology provided great value to Forthright beyond simply its preemptive alerting capabilities. GAAM for Citrix eliminated the need to manually confirm Citrix Applications would launch, saving up to 3 hours per environment per day. Utilizing Goliath, this process is automated and has been reduced to 30 minutes.

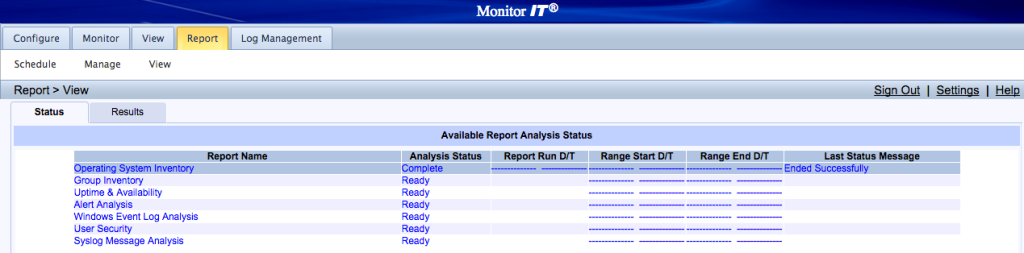
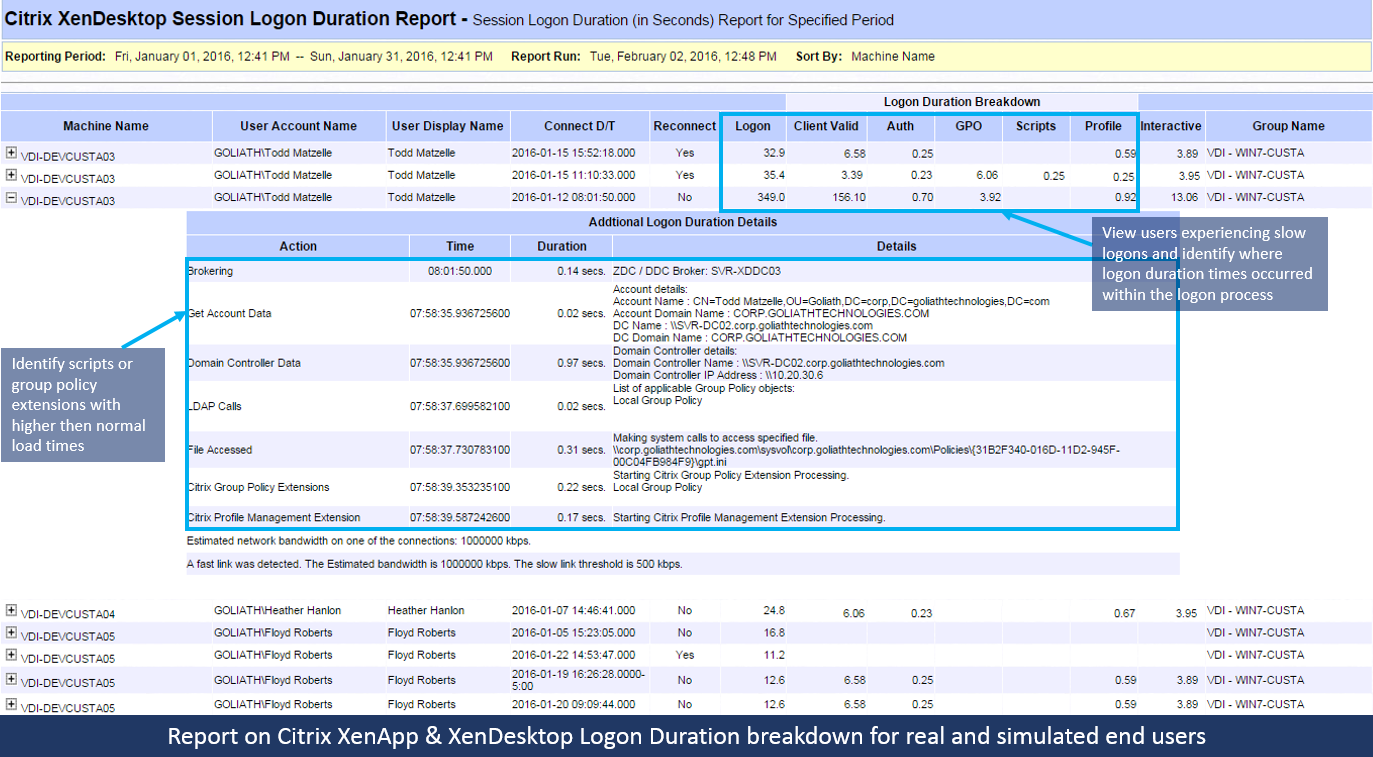
They also use the reporting capability of the product to run historical reports for analysis of the overall success or failure of the Citrix Logons or to drill down by user. The report below is an example.


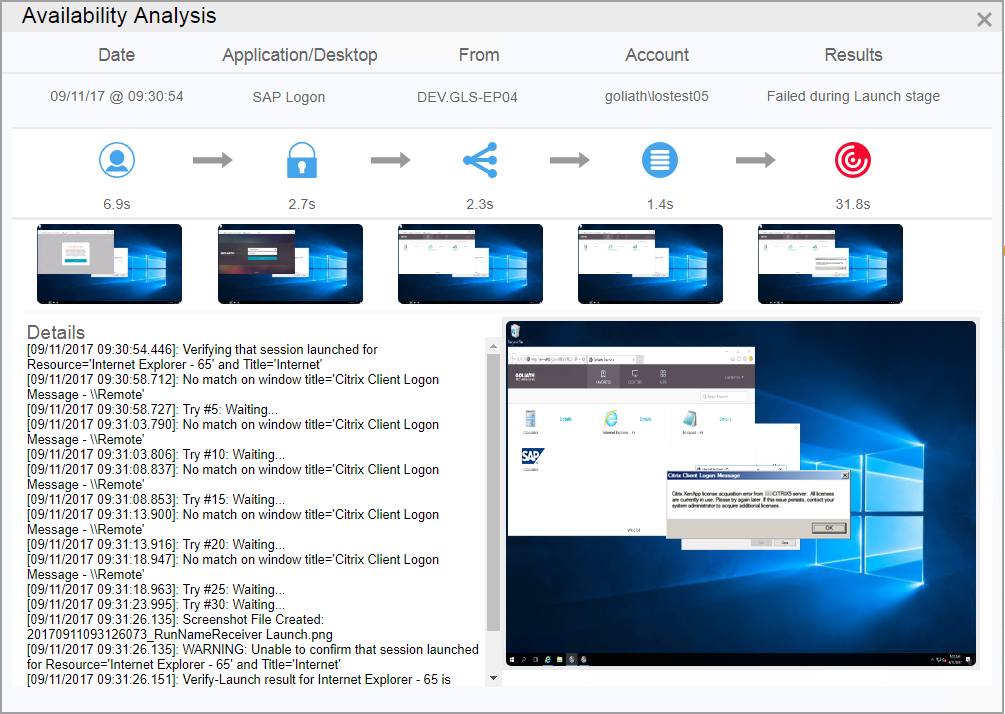
Many times the logon initiation process was successful, but the logon process was sluggish. In this case, Forthright used the logon duration drill down which dissects 33 different, though interrelated, steps in the logon process as depicted below. Armed with this logon duration detail they were able to pinpoint the true root cause of logon duration slowness and resolve the issue permanently—before end user performance is impacted.

Real-time Citrix Logon Duration Drill Down

Logo Duration Product Screenshot


Citrix XenApp & XenDesktop Logon Duration Report

Forthright needed to run historical reports and analysis to determine long-term performance trends enabling them to be proactive in managing customers’ environments. The requirement was to have the necessary reports available out-of-the-box. Armed with this data, they could tune Goliath’s XenApp monitoring software to send threshold-based alerts and simultaneous remediation actions before end users were affected.

xenapp-xendesktop-logon-duration-breakdown-goliath-forthright

Results

The Forthright team was also pleased to find out that Goliath has 66 of these types of performance and end user experience reports for Citrix and VMware, all of which come out-of-the-box with Goliath’s XenApp Performance Monitoring product.

Based on Forthright’s selection criteria to proactively manage end user experience and meet their SLAs with a purpose-built solution for Citrix XenApp monitoring, Goliath was the clear solution.

In addition to the two core requirements listed above, Goliath Technologies offered additional features that were specifically designed for Service Providers that were helpful in making a decision and having the product become a success:

  • Multi-tenancy: MSPs can use Goliath to proactively manage environments by criteria such as customer, location, application, infrastructure, etc.
  • Master “Intelligent” Agent: This is an ultra-low resource utilization (0.1% CPU) agent to monitor remote locations without maintaining an external connection. The “Intelligent” Agent gathers numerous metrics like the ICA/HDX channel and the hypervisor, and it can execute remediation actions on XenApp Servers, XenDesktop VDI, Citrix role servers, and end points.
  • MSP Management: Centralized management of the end user experience for MSPs.
  • Share Data with other Tools: Can send Citrix XenApp monitoring and troubleshooting data to Nimsoft, SolarWinds, etc.
  • Custom Reporting: Real-time dashboards and historical reports that are branded with Forthright’s logo.

As you can see from the above screenshots, Forthright is able to use Goliath Performance Monitor for XenApp Monitoring and the GAAM for Citrix to gain complete visibility into the end users’ logon experience in a single view.


Instantly Download this New Complete Guide to Understanding the Citrix Logon Process for XenApp/XenDesktop

In this free how-to troubleshooting guide to solving Citrix logon issues, a Citrix Engineer breaks down each step of the complex Citrix logon process. The guide explains all 33 stages of the Citrix logon sequence and the role each stage plays in delivering a successful logon. You will also learn the challenges inherent in isolating the specific stage/stages causing slow or failed Citrix logons so you can improve end user experience.

forthright-goliath-technologies

ABOUT FORTHRIGHT

Forthright Technology Partners stands out as a prominent provider of user-centric IT solutions and services.

Headquarters location: Weston, Florida
Founded: 1992
Employees: >30
Industry: Information technology

User Story: Retailer Monitors 10k NetScaler Transactions/Second

User Story: Retailer Monitors 10k NetScaler Transactions/Second


User Story: Retailer Monitors 10k NetScaler Transactions

Per Second

Editor’s note: The retailer featured in this post has given us permission to tell their story to help their fellow IT Operations teams solve similar challenges. Their brand name has been redacted for competitive and privacy reasons.   

The Retailer’s Business Challenge: Lack of visibility into the performance of their complex environment

A top 5 global retailer uses Citrix Platinum Edition SDX NetScaler Application Delivery Controllers to reverse proxy their main retail website. The problem, however, was that management faced a lack of visibility into the responsiveness of the site to information requests and transaction performance.

Full View into the End User’s Entire Transaction Journey 

Specifically, the retailer needed an enterprise NetScaler ADC monitoring product that could scale to support packet throughput above 10,000 NetScaler transactions per second. And, a product their enterprise IT team could use to monitor the entire end user transaction journey — from website request initiation through transaction execution — and remediate transaction slowness or failures should they occur. 

It’s about Business Too 

To help people like product category managers, the retailer’s IT operations team uses the reports in Goliath for NetScaler to see how many requests are being made to each of the retailer’s product category VIPs (Virtual IP addresses), which show high latency or are generating error codes, which servers are generating errors such as timeouts, and how the traffic is distributed to the backend servers. 

The retailer’s IT Operations team attempted to use NetScaler Insight Center to get the visibility and data they needed to effectively manage their NetScaler ADCs which typically can process over 10,000 eCommerce website transactions per second through the Citrix NetScaler Application Delivery Controller. Unfortunately, Insight Center was unable to scale to meet their enterprise IT needs, so they turned to Goliath for help. 

In addition to being able to monitor the end user’s entire transaction journey (and not lose business to their competitor Amazon), the retailer needed a NetScaler performance and IT analytics solution that provided answers by giving them real-time dashboards, threshold based alerts, historical reports with unrestricted time frame reports, the ability to export performance data, and collaborate in real time.

The Retailer’s Environment Challenge: Managing NetScalers ADC & up to 10,000 NetScaler transactions per second 

In the retailer’s environment there are 10 SDX NetScalers (see above), each load balancing multiple VIPs (Virtual IP addresses). Each VIP represents a product category in their retail operation (groceries, pharmacy, electronics, housewares, clothing, etc.).

Behind each VIP is one or more application servers. There are over 400 servers in total. Each cluster of app servers is connected to a database. All of this infrastructure controls information for over 10 million individual product items.

goliath-it-analytics-netscaler-transactions

During normal operations, about 3,000 to 4,000 NetScaler requests are handled each second. During peak shopping hours that rate climbs to 10,000 NetScaler VIP transactions per second. Requests for product information come in from a variety of sources: the retailer’s eCommerce website, mobile apps, inventory management systems, etc.

The Retailer’s Solution

When this retail giant needed to get insight into their environment, they turned to Goliath for NetScaler to collect AppFlow messages broadcasted by their SDX NetScalers. 

The retailer uses Goliath for NetScaler to understand the transaction behavior including performance, traffic routing from user to content loaded from the back end server, and reporting.

Each NetScaler request generates AppFlow messages containing the following data:

  • The VIP
  • The actual server selected
  • The requested URL
  • The returned status code
  • The response in milliseconds

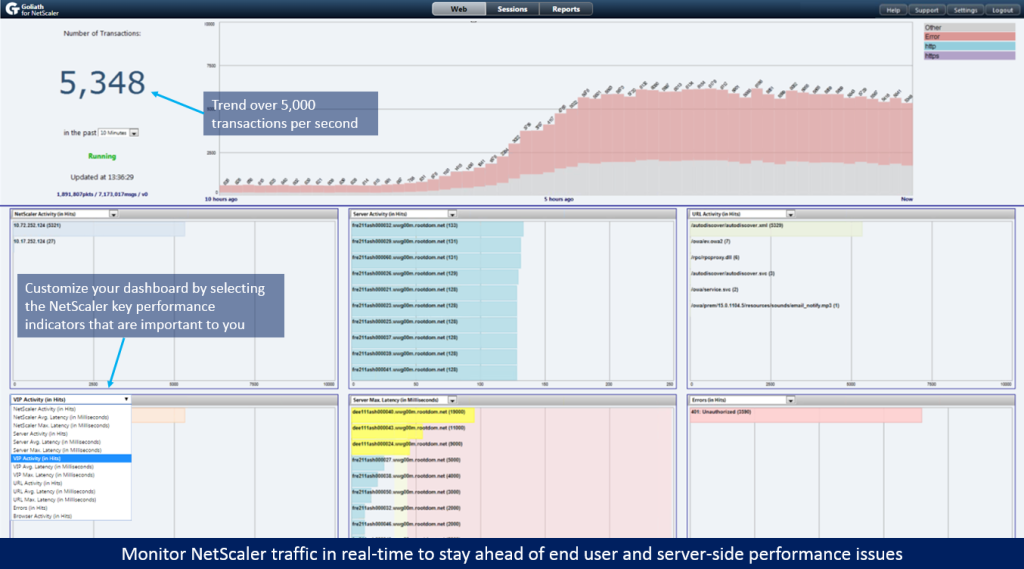
Goliath for NetScaler in turn, collects all of this information, stores it in a database, and provides a real-time dashboard showing the flow of traffic and details about latency, VIP activity, error codes, etc. At a glance, IT staff can see which servers are taking the longest to respond.

Management Gets Access to Critical Historical Performance Reporting 

By using the historical reports feature in Goliath for NetScaler, the retailer’s management can get full visibility into their environment’s performance. Specifically, their management can now see:

  • Requests being made on each VIP (this data is critical to the managers of the different product categories, like pharmacy, home products, etc.)
  • Traffic distribution to the back-end web servers
  • VIPs showing the highest latency

If requests coming to a VIP are taking too long, this indicates that additional app servers are needed on the VIP. If latency is low, the number of servers can be reduced:

  • VIPs generating errors

An HTTP 404 error code would indicate that one of the upstream systems is requesting information for a product that doesn’t exist:

  • Server errors

Errors such as Timeout on a server indicates server trouble or misconfiguration:

  • Traffic pattern trending over time. By generating reports over long timelines, management can get a crystal clear picture of how many requests are being processed. This gives them insight into future expansion needs

The retailer is able to use Goliath for NetScaler to get this data without changing a single application server component, deploying agents, or causing negative impact on the actual server performance.

Why Goliath for NetScaler Solved the Retailer’s Problems

Because Goliath for NetScaler scales to support packet throughput above 10,000 NetScaler transactions per second while providing visibility into each step of the end user’s journey from website request initiation through transaction execution, the retailer’s IT operations team knew the technology would solve their problems. 

There are several key points to derive from this success story:

  1. Goliath is the only product in the market, that can handle 10,000+ NetScaler transactions per second
  1. It has real-time threshold based alerts that are triggered by slow transaction performance
  1. Collecting all of the data is possible without changing a single application server component
  1. All of the performance data and metrics are available via AppFlow from the existing NetScalers
  1. Gathering the data has zero impact on the actual server performance
  1. No agents are needed to collect the data

By deploying Goliath’s technology, the retailer’s enterprise IT team can monitor the performance of their 10 SDX NetScalers, gain full visibility into the entire transaction journey in a single pane of glass, from the end user request through to the backend application server, and get alerted to interruptions or latency that would cause an end user to abandon their transaction.


For more information on how Goliath Performance Monitor can help you and your team be proactive and anticipate, troubleshoot and prevent end user experience issues:

Send us an email: techinfo@goliathtechnologies.com

Give us a call: 855-465-4284
 

RCH Holdings Drops Citrix Slow Logon Times 5 Min to 30 Sec

RHC Holdings

RCH Holdings Drops Citrix Slow Logon Times 5 Min to 30 Sec

citrix slow logon

Kaleb Propst“We were hosting our IT Infrastructure and moved it in house to improve overall SLA’s, end user experience, and specifically Citrix logon times. When we moved IT back on premise, we knew we needed a technology that was purpose built for Citrix XenDesktop 7.6 that enabled us to look at the logon process from the end user’s perspective. Goliath has the most detail we have seen in any technology and we used it effectively to significantly reduce our Citrix logon times.”
 

-Kaleb Propst, IT Technician at RHC Holdings 

Infrastructure

Citrix XenDesktop 7.6 & XenServer

Challenge

Stop the “Logon Bombs” & Proactively Troubleshoot & Remediate Slow Citrix Logon Issues

Kaleb Propst and his team were not satisfied with the public cloud provider they were using. Being unable to consistently meet SLA’s, the decision was made by the executive team to build their own data center.

In the hosted environment, there were any number of issues but certainly the one that caused the most pain was Citrix XenDesktop 7.6 logon times that were averaging between 2-5 minutes. It was not a tenable situation and one they decided to address when they moved IT on-premise.

In an attempt to troubleshoot the Citrix logon issues, Kaleb and his team used the standard methods. They made sure they were up to date on any hot fixes from Citrix, scoured forums, and opened tickets with Citrix. All of these efforts failed to yield a result that helped them identify the root cause of the logon issues, and the long Citrix XenDesktop 7.6 logon times persisted.

Solution

The IT Team selected Goliath Technologies because of the broad and deep visibility into all aspects of the Citrix delivery infrastructure. Virtually any IT element that can impact the end user experience is proactively monitored right out of the box.

Goliath shows the logon process in real time and for each end user. For advanced troubleshooting and analysis the logon process is broken down by each of the 9 stages including brokering, virtual machine start, client and server side validation, HDX connection, authentication, group policy, logon scripts, and profile load.

In addition, for each stage the IT administrator can drill down in each stage to get information such as:

  • Domain Authentication
  • Policy Loading
  • Policy Execution
    • Scripts
    • Printer Mapping
    • Fileshare
    • Registry Extensions
    • Powershell
  • Folder Redirection

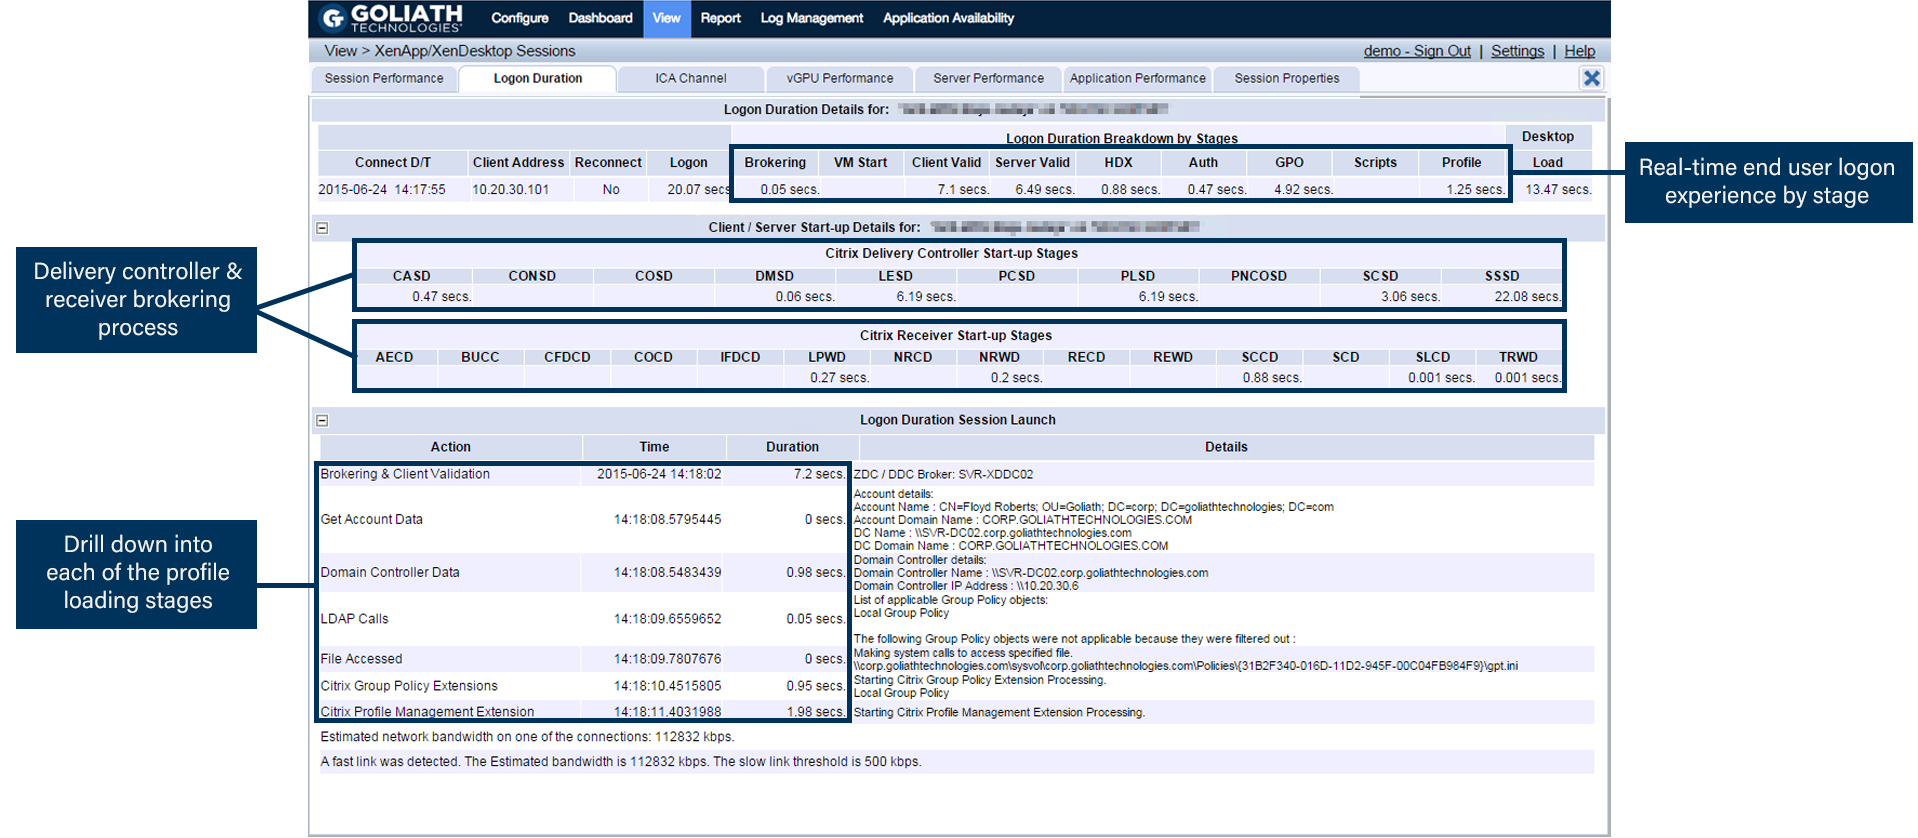
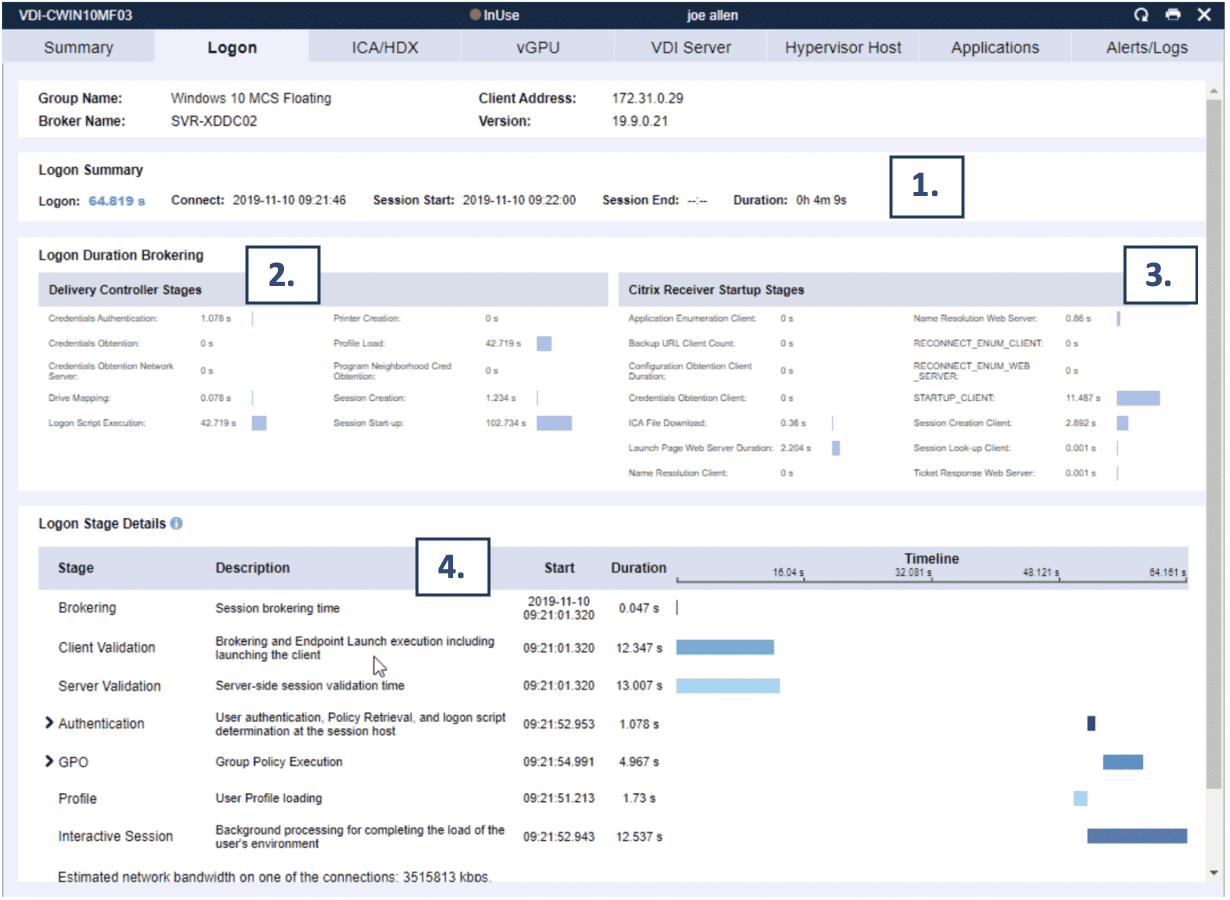
Here is an example of the real time logon duration breakdown screen that Kaleb and his team uses to proactively troubleshoot and remediate slow Citrix logon issues:


(1) The Logon Summary identifies in real-time the actual logon duration time as well as session start, duration, and end time if applicable.

(2) The Delivery Controller Stages identifies where in the delivery controller performance problems maybe manifesting themselves. 

(3) The Citrix Receiver Startup Stages will help identify if there are issues with Receiver that could be impacting performance. 

(4) The Logon Stage Details section of the Logon tab is unique to Goliath Performance Monitor and presents a granular breakdown of the login process by combining all of the logon metrics above in the screen with other information included in the Goliath logs. 

Armed with this real time data, Kaleb and his team were able to isolate the exact stage of the Citrix logon process that was causing the delay. As a result of this drill down they were able to isolate anti-virus software as the root cause. They changed some of the anti-virus settings and logon times improved almost immediately.

With that critical issue solved, they are now able to be more proactive and run cause and effect tests to see how their IT infrastructure changes and how adjustments impact the duration of the different stages of the logon process.

Results

Logon Times Dropped to 20-40 Seconds 

RHC Holdings was able to reduce Citrix XenDesktop 7.6 logon times from 2-5 minutes to 20-40 seconds by using the powerful, purpose built Citrix Logon Duration Breakdown analysis within Goliath Performance Monitor. This functionality, combined with the other key features allow them to proactively manage and monitor end user experience in their Citrix XenApp 7.6 environment.

vSphere Monitoring Improves Time to Resolution for Grace Mayer

User Story: Proactive vSphere Monitoring Improves Time to Resolution for Grace Mayer

grace-mayer-goliath-technologies vSphere

“For over 10 years I’ve monitored my entire infrastructure with Goliath Performance Monitor, which includes VMware vSphere monitoring. I meet with many companies and vendors in my daily activities and I believe this product provides the best overall combination of features and functionality. GPM is the best value I have seen.”

– Jim Vigotty, IT Manager at Grace/Mayer Insurance Agency

The Business Challenge

Eleven years ago as a newly hired IT Manager, I did an assessment of the IT infrastructure, which included how we monitor VMware vSphere, for which I was now responsible. One of the key areas that I targeted was the automation of our vSphere monitoring.

My goal was to procure a vSphere performance monitoring solution that would allow me to accomplish my goals of capacity planning, predictive failure analysis, troubleshooting and automated remediation. Without adequate technology, these goals are either impossible or very time-consuming and, as a result, I would be in danger of breaking one of my key IT Rules: Thou shalt be the first to know if a system goes down.

The chosen technology had to have the ability to capture adequate data from disparate VMware vSphere servers and work stations and present the vSphere metrics in such a way that they were actionable. Furthermore, the vSphere performance monitoring functionality had to be both deep and flexible enough to allow me to set thresholds that alert and/or initiate fix actions. Finally, the cost of the required functionality needed to fit within a tight budget.

The selection criteria, though straightforward, proved to be a challenging set of requirements for vSphere performance monitoring vendors. I evaluated a host of free ware products as well as HP Openview, Tivoli, Kaseya, SolarWinds, and Goliath Performance Monitor for monitoring vSphere and the rest of my infrastructure. During the course of our evaluation, we disqualified products for one or more of the following reasons:  ease of use, functionality, scalability, flexibility, or cost.

The Solution

We selected Goliath Performance Monitor for vSphere performance monitoring because the solution has the best combination of my key criteria for vSphere performance monitoring. I believe that first aspect was noticed with the ease of installation and configuration. The preconfigured VMware vSphere monitoring rules allowed me to easily begin proactive VMware vSphere monitoring.  

I was able to customize my trending reports, alert notifications, and filtering events so that I received essential information and not the “noise.” Then I set up event triggers that would send e-mail and text notifications so I was aware of any potential issues and initiate automated recovery actions so that I could manage these critical events immediately without human interaction. I have Goliath Performance Monitor send me both, as I want the immediacy of a text message and the history of the email notification for my logs.

The Result

I was able to automate my system monitoring because of Goliath’s deep understanding of key metrics to monitor within the infrastructure. The technology comes with out-of-the-box monitoring rules and alerts so they took most of the guesswork out of installation and management. The ease of use, functionality, scalability, flexibility and cost of the Goliath Performance Monitor provided us with the most comprehensive tool, for the best value, we found in the marketplace, which is why we selected Goliath Technologies.

About Grace/Mayer Insurance 

Jim Vigotty, IT Manager at Grace/Mayer Insurance Agency, Inc, is responsible for monitoring the entire IT infrastructure.Grace/Mayer is one of leading independent insurance agencies in the Midwest. The agency’s foundation, since 1917 has been providing Property and Casualty, Employee Benefits, Financial and Estate, and Personal insurance business services. While we are proud to be locally owned and operated out of Omaha, Nebraska, we provide coverage for clients throughout the United States, as well as internationally.

Try a Fully Supported 30-day Free Trial of Goliath Performance Monitor

To see if Goliath is a good fit to consolidate your monitoring tools, reduce costs and improve remediation time, get a fully supported 30-day free trial of Goliath Performance Monitor today. 

    Do you think Goliath can add value to your organization? Reach out.
    Email us at  techinfo@goliathtechnologies.com or schedule a demo, consultation or free trial.

    Independent Review: Proactively Manage VMware with Goliath

    Independent Review: Proactively Manage VMware with Goliath

    Independent Review: Proactively Manage VMware with Goliath Technologies

    Editor’s note: this review is from Bilal Hashmi, an accomplished and respected VMware vExpert. Bilal also holds specialized certifications like ISA, MSCITP-SA and VCP-3/4/5. You can connect with Bilal on Twitter.

    This unique monitoring solution allows you to be proactive in the management of VMware vSphere infrastructure while at the same time simplifying operations. In this review I will talk about how you can leverage the functionality and unique architecture to accomplish this dual purpose.

    Just recently, I had the pleasure to work with the good folks at Goliath Technologies and review their solution, Goliath Performance Monitor (GPM).

    My first impressions of GPM were pretty positive. If you’re unfamiliar with GPM, for VMware vSphere it’s a single solution for providing monitoring across the 5 layers of the virtual stack including Application, OS, VM,Hypervisor and Hardware. So it’s a single pane of glass to monitor your entire stack. The version of GPM I am reviewing is 11.6.0.6.

    The GPM Installation Process – Up & Running within Minutes

    Goliath does an excellent job in creating an installation guide for the tool so I won’t go into detail about that. I just glanced over it and my deployment may have taken about 30 minutes or so.

    Within minutes, I was playing with the monitoring tool’s consoles. One thing I would like to point out from the installation guide is the pre-requisites. You will need a VM or Physical Machine with the following settings:

    • Windows Server 2008 R2 – 2012 R2
    • At least 8 vCPUs and 12GB RAM (these are soft limits but probably a good idea to follow these when deploying in production)
    • .NET 3.5 SP1 installed on the Virtual Server or Physical Machine
    • Internet Explorer Enhanced Security disabled
    • TCP ports 80 & 82 opened inbound
    • Download the Goliath Performance Monitor software
    • Proper credentials for the environments you would like to add to inventory (vCenter, XenServer, ZDC, DDC, etc.)

    Goliath Performance Monitor vs vCOPs/vRealize Operations

    Why XenServer credentials? Unlike some other popular tools in the space like vCOPs/vRealize Operations, GPM supports VMware vSphere and also XenServer, Hyper-V along with XenDesktop, XenApp and Horizon View.

    So remember what I said about simplifying IT operations? You can use Goliath’s product to monitor VMware vSphere and everything else too. Not to mention you don’t have to fall prey to licensing that limits your functionality. Basically, you get full functionality with Performance Monitor on the base product, unlike some of its direct and indirect competitors.

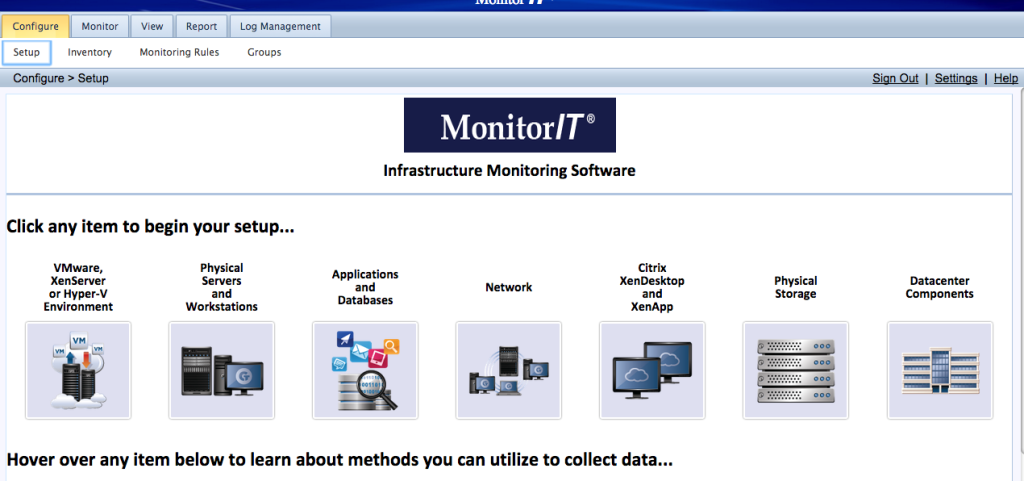
    As soon as the installation was complete, I pointed my browser to the IP address of the server the tool was installed on and this is where I landed.

    From here on, it was pretty straight forward. I selected the first obvious choice, provided credentials for vCenter, and within seconds my whole lab was presented before me.

    About GPMs vCenter Plugin & Impressive “Intelligent Agent”

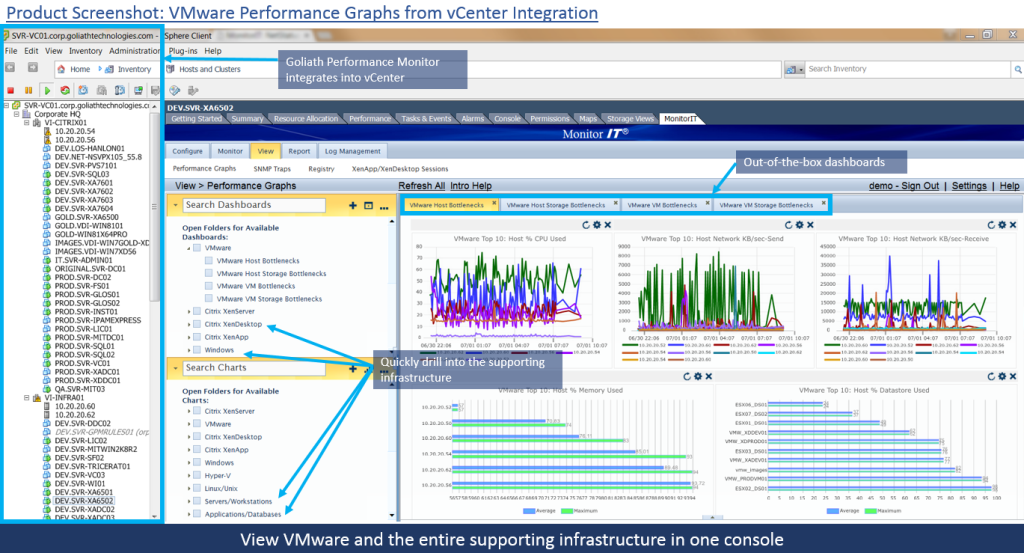
    The tool has a vCenter plugin that provides a single dashboard to monitor both physical and virtual infrastructure in vCenter. If you are not a VMware only shop, you will be happy to know that GPM has API integration with both ESXi and XenServer that captures key metrics about the host, virtual machines and storage agentlessly.

    So what exactly does the agent do?

    First of all, this is by far the most impressive agent deployment process I have witnessed. They call it the “Intelligent Agent” and I think for good reason.

    It literally takes seconds for the Intelligent Agent to be deployed and communicating back to the mother ship. It is able to capture deep diagnostic metrics with little resource utilization, typically less than 0.1% of CPU & Memory utilization, and a 1.5 MB footprint.

    GPM Can Monitor any Application

    Once I deployed the agent on one of my windows machines, I started seeing this tool’s true potential apart from being hardware/hypervisor agnostic. You can literally tune it to monitor any application.

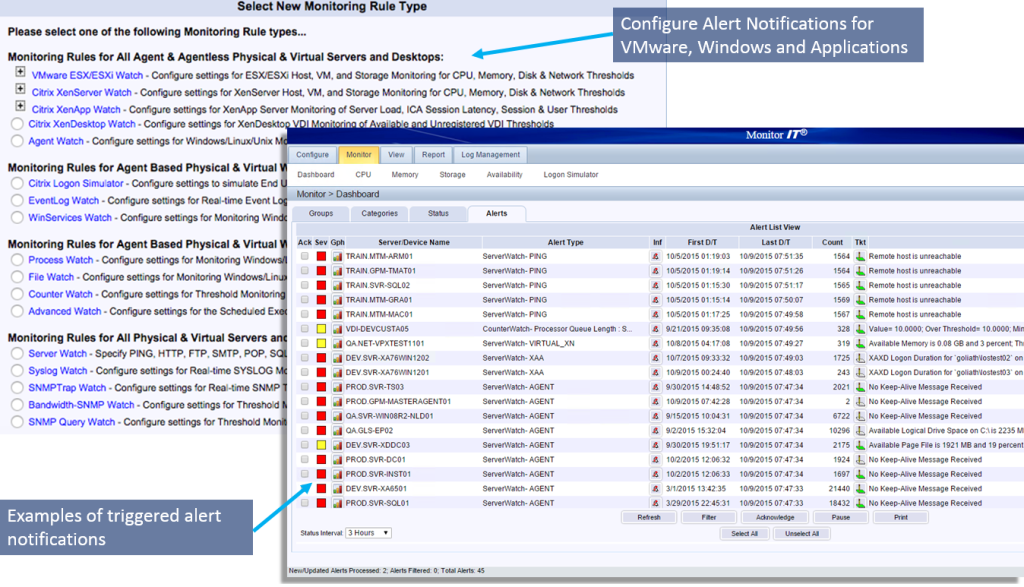
    Take a look at the types of monitoring rules and alerts that can be set and think of your current gaps in monitoring. This is what I gathered; as long as the individual understands what the application does, Goliath Performance Monitor can monitor it effectively.

    Needless to say, the agent provides a new level of monitoring that enables you to monitor services that are critical to your business, not just VMs and OSs, etc. And yes, it can be deployed from within the console as long as proper credentials are provided. The agent can get deployed on both Windows and *nix machines.

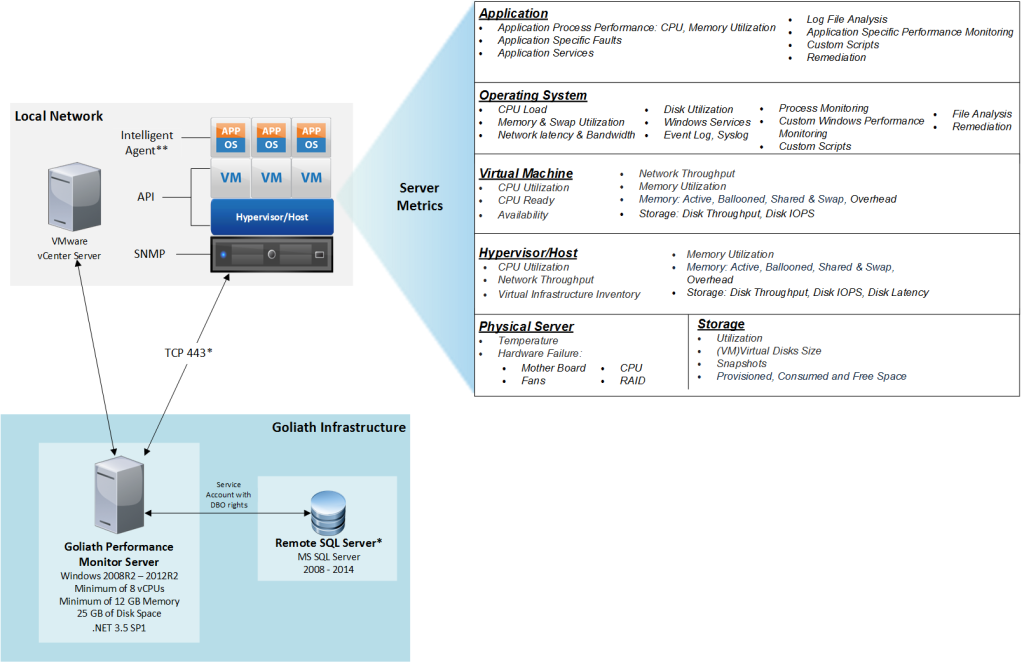
    Some of the metrics that are captured are detailed and useful. The key is that they use both agentless (API) and agent based approaches to get all of the below metrics in one product. Also, each agent has log management capability built in for troubleshooting.

    GPMs Metrics Will Help You Keep Your Sanity

    This is the 5 layers of visibility:

    Those are some critical metrics to monitor your infrastructure which will eventually help you keep your sanity. But what makes these even more valuable is the way they are reported.

    Not only does it give you a detailed view of what’s happening with your environment at the moment, you can also get some real-time trending on the data and historically go back as far as you wish, or at least to the point where data began to be collected.

    All the hypervisor metrics mentioned above can be retrieved in similar fashion. Apart from that, there are some canned reports that come with the solution and there is the option of creating more.

    But it’s information like this across multiple aspects of your infrastructure that makes this tool stand out. You are able to run these types of reports for your entire stack.

    If you have multiple sites or hybrid clouds in play, you will love the “Master Agent” functionality. I think this is the part that I really liked due to its simplicity.

    GPM makes it Easy to Monitor & Manage Remote Sites

    The Goliath Performance Monitor Intelligent Agents make it easy to proactively monitor and manage customer sites remotely. Any agent can be designated as a “Master Agent” at a remote site, behind a ­firewall, and con­figured to proactively reach out to the central Goliath Performance Monitor server if a condition is met and trigger an alert.

    There is no need to deploy a separate server or proxy at a remote location. Note: Intelligent Agents are less than 0.1% CPU/ 30 MB Memory, click to deploy and easy to use. So basically the agent we talked about earlier is all that is needed to make one of the boxes at any of the remote sites serve as the proxy for communicating with the GPM server.

    Obviously because of its tiny footprint, performance should not be a big concern. But what if this remote server goes down? Well I would imagine GPM would trigger an alert as soon as that happens.

    Also, there are notification capabilities that will allow you to integrate these alerts with most ticketing solutions. These are configurable at the alert level so each alert can follow a different notification method if need be.

    A Few Areas of Needed Improvement

    With all its greatness, the solution does have some areas of improvement. The Goliath team was very interested in hearing my feedback on this. They were keen to know how to make this tool even better.

    In all honesty, I have been pretty impressed with what GPM offers. However, its GUI can use a little help. The navigation is not the most straightforward like many other monitoring tools. But it does solve an extremely complex problem; allowing you to monitor your entire infrastructure through a single pane of glass, the ultimate fantasy for most people in IT.

    The Goliath team was very receptive about my comment on how I keep forgetting how I got to a certain screen because of the confusing navigation. They quickly acknowledged that and pointed out they are currently working on revamping their GUI to address those issues and will continue to come back to the community for further enhancements to the product. Look for my blog post later on the new UI when it is released.

    The Verdict about Goliath Performance Monitor

    In conclusion, I think Goliath Performance Monitor is a true winner. I can’t seem to pinpoint a tool that does everything it does. There are tools that compete with it in certain areas obviously, but I am not sure if there is any that delivers everything it does, the way it does.

    It should appeal to businesses of all sizes. The support I got from the Goliath team in getting me familiar with the tool was phenomenal. If their actual support team has the same attitude, then you cannot go wrong with making an investment in them.

    Speaking of investments, here is a link that will give you an idea on how much it will cost you to run this tool in your environment. But before you do that, I suggest you download a fully supported 30-day free trial of GPM and let the technology do the talking.

    Citrix Troubleshooting Improves Logon Time for 1k Users

    Citrix Troubleshooting Improves Logon Time for 1k Users

    User Story: Citrix Troubleshooting Improves Logon Time for 1k Users

    Earlier this week, I was working with a customer who is using Goliath for Citrix Monitoring and Citrix Troubleshooting for Citrix XenDesktop 7.6 applications. This customer is a law firm that has 19 offices located all over the world. In total, they have over 1,000 end user and 300 VMware vSphere virtual machines supporting their Citrix XenDesktop 7.6 environment.

    Citrix Troubleshooting Issue: Complaints about Slow Logon Times 

    The Citrix Troubleshooting engagement was to focus on was reducing end user complaints resulting from application and server issues, specifically with slow logon times. By configuring our product they were able to isolate the root cause of slow logon times and be alerted to impending issues proactively so they will now have time to react and solve problems before end users complain. This blog will speak to how the law firm achieved their goal.

    Citrix Troubleshooting Step #1 – Deploy the Intelligent Agent to Collect Data 

    So the first Citrix Troubleshooting step was to bring in their VMware vSphere and Citrix XenDesktop 7.6 environment through our ‘First Time Run Wizard’ using our APIs for VMware and Citrix. Once the Citrix infrastructure was listed in the inventory, we deployed our Intelligent Agent.

    Our agent is not like most agents. It is very lightweight and uses less than 0.1% CPU, 1.5 MB on disk, and about 50 to 80 MB RAM. The agent deployed to the environment within minutes and instantly started to collect data. Once deployed, we were then able to jump right into configuring the product.

    Citrix Troubleshooting Step #2 – Analyze Logon Times & Drill Down into Logon Duration

    The second Citrix Troubleshooting step was to start analyzing their logon times and drill down into the logon duration breakdown, the customer went to the XenApp/XenDesktop Session Display. From this display, you can view current and historical Citrix sessions and see metrics including logon duration, ICA latency, connection times, and more.

    Since the customer primarily wanted us to troubleshoot slow logon duration times, we then sorted this display by clicking the ‘Logon’ header to bring the sessions with the slowest logon times to the top of the screen, as shown in the below screenshot.

    The customer was then able to click into the sessions and view 3 levels of Logon Duration information. These levels included the following and are pictured below:

        1. The high level breakdown of the logon duration for each of the logon stages
        2. The breakdown of the logon as seen by the broker/controller
        3. The logon details as seen by the session itself

    “The real-time logon analysis enables admins quickly isolate root cause of logon slowness.”

    When the customer saw all of logon data that Goliath received they were blown away and stated that the detail was “amazing” and that they “didn’t know this detail was possible.”

    Citrix Troubleshooting Step #3 – Drill Down into Group Policy & Logon Duration Detail to Identify End User Issues

    With the ability to drill down into group policy information, they were able to view what their group policies were actually doing. The customer was able to see each of the shared drives being mapped, printer mappings, and group policy extensions being processed.

    Using this Logon Duration detail, the customer was able to identify multiple problems in the users’ sessions loading right away. One item included a group policy extension for the VDI drive map that was taking 108 seconds.  This is often indicative of a 3 minute timeout which means that the drive in this case may not be available.  Using this information, the customer was able to identify the group policy object that it came from, open it, and see the root cause was a driver mapped incorrectly.

    Overall, having visibility into the logon duration process was hugely impactful for this customer. Since implementing our technology, they have been able to identify multiple areas that were causing logon times to increase. They have also implemented alerting and reporting around logon duration as well.

    Citrix Troubleshooting Step 4 – Get Proactive by Configuring Preemptive Alerts Based on Thresholds

    The final Citrix troubleshooting step was to use the root cause information to be proactive by configuring preemptive alerts based on thresholds we determined from the issue isolation trending analysis. If leading indicators begin to occur, an alert will be triggered so they now have time to proactively address the issue before users are impacted.

    It is very rewarding to implement the product and achieve these types of results for customers who have been frustrated in the past. Stay tuned for additional “proactive stories from the IT front lines”.

    Download Our Citrix Logon Process Technical Guide

    Do you think Goliath can add value to your organization? Reach out.
    Email us at  techinfo@goliathtechnologies.com or schedule a demo, consultation or free trial.