vSphere Monitoring & Alerting Reduces Performance Issues by 32%

vSphere Monitoring & Alerting Reduces Performance Issues by 32%

User Story: Proactive vSphere Monitoring & Alerting Reduces Performance Issues by 32%

The following is a real use case about how a large health system with a VMware vSphere & MEDITECH environment deployed vSphere performance monitoring to proactively fix end user performance issues.

About a month ago I was working with a new customer who was implementing the Goliath’s VMware vSphere Performance Monitoring for the first time. This healthcare system includes 4 acute care hospitals and a number of other healthcare related facilities.

The healthcare system has over 200 VMware vSphere VMs supporting their 5,000 MEDITECH EMR/EHR users. Their primary concern was putting a stop to “end user alerts” resulting from application and server issues.

The goal was to help our customer set up our proactive vSphere performance monitoring technology to send real-time alerts of impending issues so their team can troubleshoot VMware vSphere and MEDITECH problems before end users are impacted. This proactive approach to vSphere performance monitoring, using our threshold-based alerting and remediation, allowed them to reduce support tickets by 32% in 90 days.

In the remainder of this post I will explain how our team at Goliath achieved this goal, and how we took this a step further using the VMware vSphere monitoring, troubleshooting, and remediation facility in our product. Our customer was pretty pumped about the results when we finished.

Why VMware vSphere performance issues are difficult to catch in time

In my experience, performance issues in the VMware vSphere stack are difficult to catch in time because there’s either a lack of visibility (some element isn’t being monitored), there are too many different tools monitoring VMware vSphere the whole stack, or sometimes people don’t even know what to monitor.

Eliminating monitoring tool bloat

Goliath Performance Monitor for VMware vSphere brings together functionality in one product that I typically see in multiple products. I will not bore you with feature dumps in my post but there are two meaningful points to make:

  • Goliath has one for VMware vSphere monitoring. We monitor the full virtual stack including Host, VMs, Applications, OS, and Hardware. This is important because it both reduces the complexity of VMware vSphere performance monitoring and eliminates blind spots and false positives which are common in products that don’t monitor the full virtual stack.
  • Goliath gives you real-time alerts based on thresholds, events, and faults to proactively keep you aware of performance issues before end users complain. Note: products that use WMI can’t be real time. If you ever used it, you already know this.

Setting up VMware vSphere monitoring rules & alerts

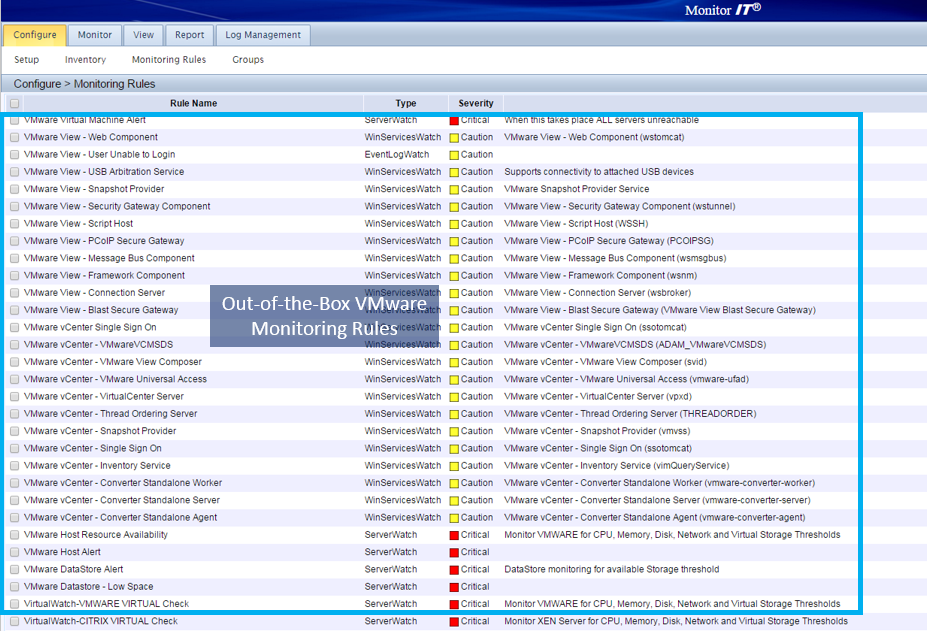
First we set up our VMware vSphere Monitoring Rules and real-time alerts. Keep in mind these are all out-of-the-box, meaning that the VMware vSphere monitoring expertise of knowing what conditions to look for or monitor are already pre-loaded into the base product, as are the alerts.

So the vSphere monitoring rules tell the product what conditions to look for on the hypervisor, virtual machines, OS, applications, and hardware. The vSphere monitoring rules also contain the alerts that will tell you in real time if a trigger event has taken place.

Below is a screen shot of some of the alerts that are automatically deployed post-install (not the actual customer’s). You can see that the product is looking for conditions such as resource utilization and threshold breaches for VMware host and VM resource utilization.

It is also checking to make sure VMware vCenter and its dependencies are running, and if they are not, restart the service. There are also alerts regarding VMware DataStore usage as well and log analysis for VMware failures and errors.

Out-of-the-Box Monitoring Rules Trigger Real-Time Alerts

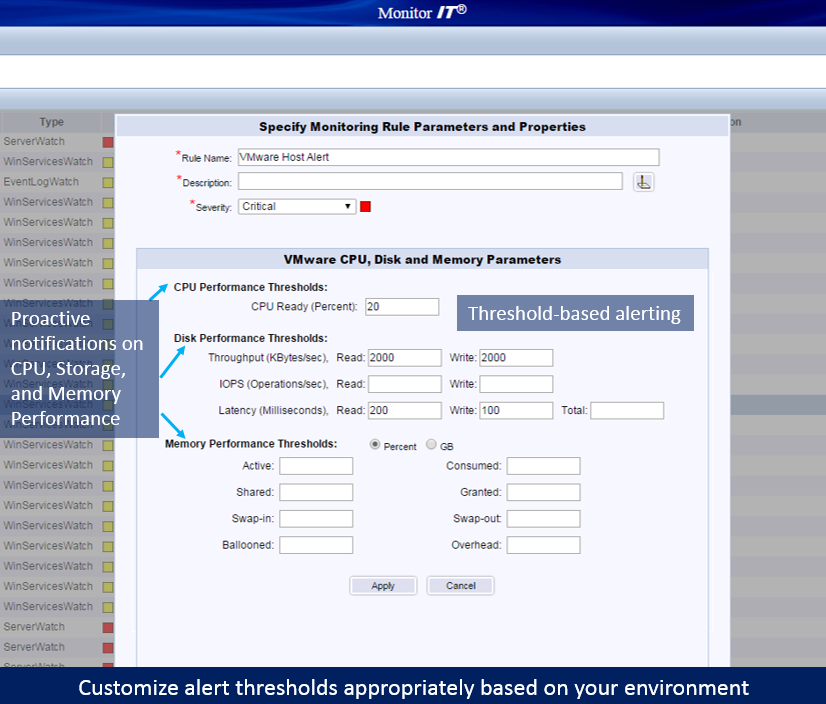
The customer then wanted to configure alerts based on specific thresholds that took into consideration the unique requirements of an “always on” Healthcare IT department. Specifically, they wanted thresholds on the VMware vSphere servers hosting MEDITECH, set lower than we typically would, at least initially, to give quite a bit of advanced notice so they could be sure they could fix the issue before anyone was impacted.

In the screenshot below, they used the VMware Host and VM Alert to configure VMware alert to alert on a host with high CPU, Storage Latency, IOPs, Throughput Utilization, as well as Memory Provisioning Thresholds.

The key vSphere performance monitoring metrics they were particularly interested in alerting on was Storage Latency, CPU Ready, Memory Swapping, and Ballooning as they were good indicators of resource conditions affecting application experience and a cause of slowness.

Will threshold-based alerts cause “alert storms”?

Now, with all of these alerts the question was, as it always is, “will I be inundated with alert storms?” We want to send useful alerts and minimize the noise because too many are as bad as none.

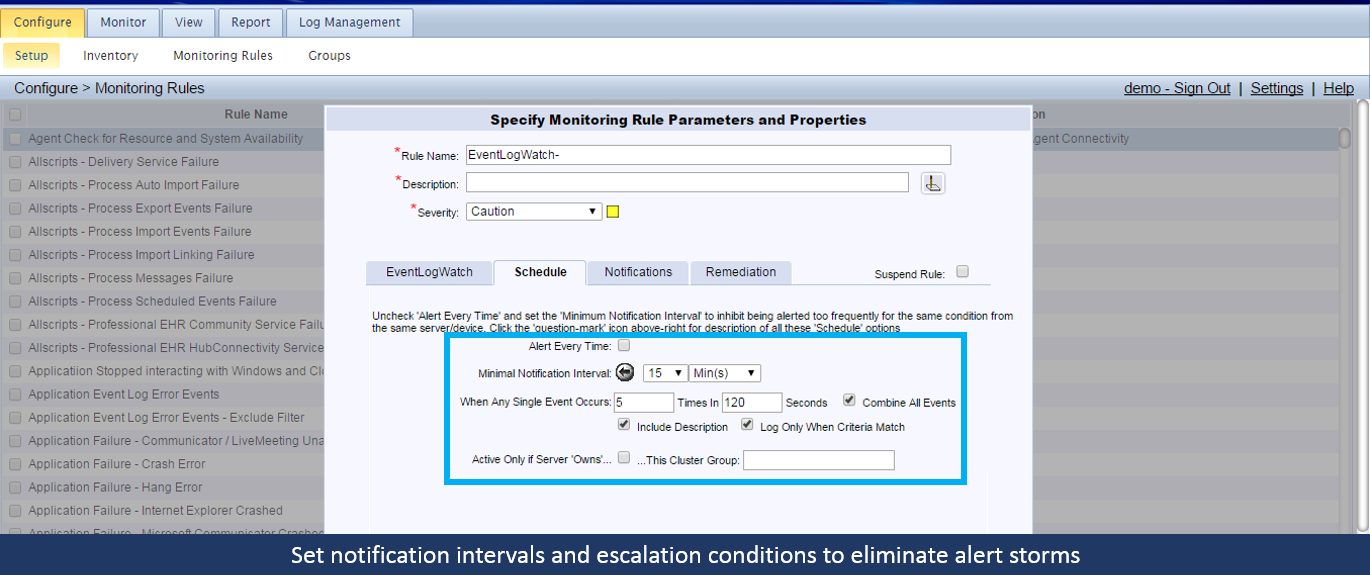
In the screenshot below, we use the ‘Schedule Tab’ of a vSphere performance monitoring rule to specify how often we’d like to be alerted. In this case, you can see the rule is set to alert immediately and then every 15 minutes for an ongoing condition. So, the vSphere performance monitoring is customizable.

Furthermore, it will group together concurrent events when there is a flapping condition into a single alert, to mitigate alert flooding.

Setting up remediation actions

Finally, we set up remediation actions. The customer was super impressed with this functionality. They were aware that the Goliath Performance Monitor for VMware vSphere monitoring had functionality in this area, but they didn’t know the power of it until we were able to dig in deep while activating and configuring the vSphere monitoring technology.

There are a few things to point out here. First, remediation actions only happen automatically if you want them to. It is your call and you are in control. Second, they can happen simultaneously with an alert being triggered so you know that there is a vSphere remediation sequence taking place.

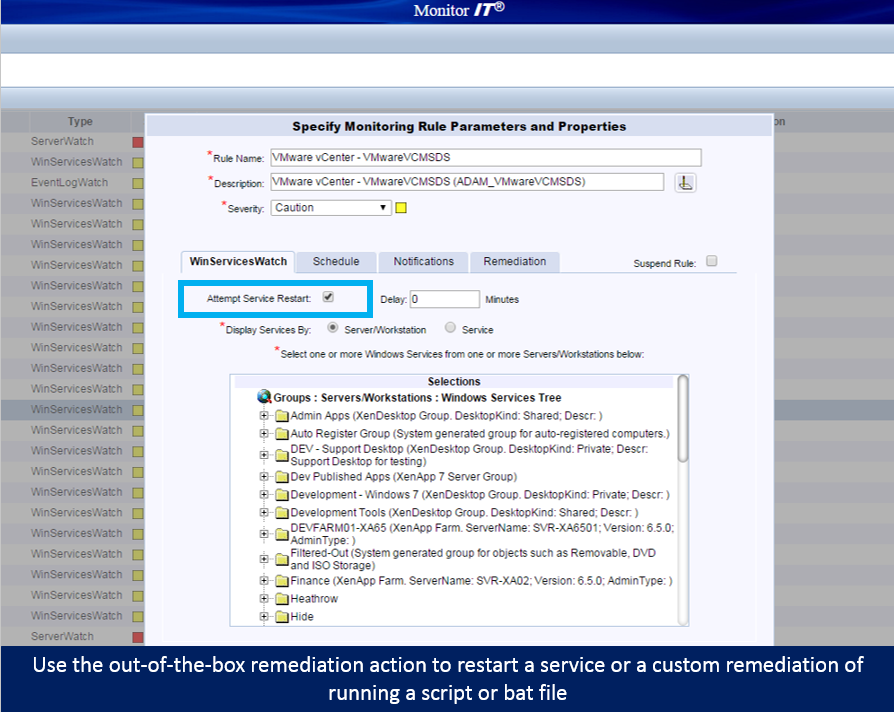
Common vSphere remediation actions I have seen are simple actions like restarting a vSphere VM or throttling an application with a CPU or memory leak and executing a workflow to reset a hung backup job and then kicking it off again from the main controller. Also, you can execute any .bat file, powershell, or script so the possibilities of what you can do with our remediation engine are pretty much endless.

In the screen shot below, you can see that this particular vSphere performance monitoring rule is utilizing Goliath’s out-of-the-box remediation action of restarting a service. Therefore, if this particular VMware Directory Services service is stopped for any reason or affecting authentication to vCenter, GPM will alert you in real-time and then restart the service to get it back up and running.

These are only a few key functions, but they were hugely impactful to this customer. Over the last month, they reported that downtime has significantly decreased. They have also adjusted thresholds to higher levels as they have become more comfortable with the environment’s performance level and capacity.

As a result of the deployment of a comprehensive VMware vSphere Performance Monitoring Solution support tickets dropped by 32%. In other words – success!

If you have a comments or question, please leave it in the comments section and I will be quick to respond. And to see all of this for yourself, try a 30-day free trial or demo of Goliath’s proactive VMware vSphere performance monitoring software.

Health System Isolates Root Cause & Resolves EHR and Nuance Dragon Dictation Speed & Reliability Issues

Health System Isolates Root Cause & Resolves EHR and Nuance Dragon Dictation Speed & Reliability Issues

How We Did IT

Health System Isolates Root Cause & Resolves EHR and Nuance Dragon Dictation Speed & Reliability Issues 


dragon dictation issues

Infrastructure

Citrix XenApp, Windows 7, Nuance Dragon Dictation 

Challenge

Complex software causes complex problems for physicians 

The technical lead and his team from this Health System needed a solution to help them identify and resolve a complex problem impacting speed & reliability of their clinical applications and Nuance and Dragon Dictation, as well as clinician experience. This Dragon Dictation issue left hundreds of clinicians outraged and with no ability to use the dictation system. 

The health system’s Emergency Department implemented Dragon Dictation to help their physicians document their findings in their EHR. 

“Given the complexity of the Dragon Dictation software, combined with the complexities of our Citrix XenApp-based Windows 7 desktops leveraging roaming sessions, we had many challenges presenting a USB microphone in the Citrix session and getting the dictation software to recognize the device and work reliably. After a significant amount of engineering by some of our talented staff, we felt we had a stable environment, and the Dragon Dictation software worked reliably.” 

Solution

Troubleshooting became ‘troublesome’ 

Terralogic, a managed service provider selected Goliath Technologies due to its embedded intelligence and automation for monitoring and troubleshooting Citrix and the end user experience for their managed services customers. Goliath automatically discovers the entire Citrix delivery infrastructure, identifies what to monitor, the thresholds to set, and then alerts when thresholds are exceeded for all potential events, conditions, and failure points. 

How they used Goliath’s Event Log Management Software to Troubleshoot & Remediate

“While pouring through various log files during our troubleshooting process, we utilized Goliath Technologies Event Log Management Software and fine-tuned the filters to see what we could uncover in Windows application logs. With the help of Goliath’s software, we uncovered a relatively new and previously unseen Event ID 1000 error in the Windows Application Log that referred to a GeneralTel.dll faulting module.” 

“GeneralTel.dll has nothing to do with the microphone audio from what we could tell, but we traced back a change related to Microsoft KB2952664 where an update to the GeneralTel.dll had been applied.” 

The update in question, KB2952664, has been issued from MS several times and it appears that running a single uninstall of the KB does not remove ALL installs of it. It took multiple uninstalls to get ALL the updates cleaned off the systems. The team built a script that runs during login, checks for the presence of the generaltel.dll file, and, if it finds it, executes a command to uninstall KB2952664. Unfortunately, the actual uninstall does not take place until the next reboot, so a few reboot cycles needed to occur to clean everything up. 


Results

The issue was caused by a simple Microsoft update that had not been applied correctly. They used Goliath’s Performance Monitor Event Log Viewer for troubleshooting because it consolidated all the logs across our Citrix virtual desktop environment. This aggregated view allowed them to see a trend that would have otherwise been nearly impossible to find looking through individual workstation logs where the error may have only occurred once. This would have appeared as noise and easily overlooked. 

If you’re experiencing a similar complex Citrix or EHR speed & reliability issues and want to see if our software can help, contact us at techninfo@goliathtechnologies.com.  See why Goliath is the “Standard in Health IT.” 

Try Goliath For Free

Give us a little information, download our software solution, and start using the same day.

User Story: Augusta Health Proactively Manages MEDITECH

User Story: Augusta Health Proactively Manages MEDITECH

Hospitals do not close and EHR applications do not go to sleep at night – which presents a continuous problem and challenge that Healthcare IT teams must solve. And what keeps everyone from the CIO to the System Administrators up at night?

It’s managing the applications, infrastructure, and end user experience that allow physicians and healthcare workers to deliver patient care around the clock.

For those reasons, Augusta Health, a Community Hospital with 4,000 MEDITECH users and 255 physicians agreed to give a view into their data center to show how they proactively manage MEDITECH, Citrix, VMware, and the underlying infrastructure.

MEDITECH, Citrix & VMware Performance Data in a Single View

In this upcoming free live webinar, Mike Tremel, Augusta Health’s Sr. Systems Engineer, will show how he uses Healthcare ITs only technology that correlates, in a single view, MEDITECH, Citrix and VMware to proactively monitor and manage the entire end user experience.

You will get a comprehensive view of the application and delivery infrastructure and you will see how this technology’s built remediation functionality enables Augusta to proactively anticipate, troubleshoot, and resolve end user performance issues, ultimately delivering better patient care.

To register now for this free live webinar, please go here. And if you have a question about the webinar or the proactive EHR performance monitoring technology that will be shown, please leave a comment or tweet at us now.

 
Browse EHR Monitoring & Troubleshooting Webinars

User Story: How MaaS Provider Ensures IBM WebSphere Availability for Retailer

User Story: How MaaS Provider Ensures IBM WebSphere Availability for Retailer

Editor’s note: This post tells the story about a MaaS provider who deployed advanced technology to ensure IBM WebSphere application availability and proactively troubleshoot and resolve end user performance issues for a large online athletic retailer. This is a guest post from Bill Karounos, CEO of TransformaTech and a trusted Goliath Service Provider. Transforma Tech utilizes Goliath Performance Monitor to deliver MaaS or Monitoring as a Service for IBM WebSphere to their customers.

The gift-giving rush of the holiday season can make or break a retailer and downtime, performance degradation, and delays in order processing in their online shopping experience during this time can be incredibly damaging to the business. Thus, proactively monitoring and maintaining these environments using the most state-of-art IBM WebSphere application monitoring solutions available is understandably a high priority for members of the retail industry.

As a MaaS, IT service provider, my team at TransformaTech Inc. is often asked by clients to solve these types of problems. Consequently, when we were selected by a billion-dollar athletic retailer to ensure the application availability of IBM WebSphere Message Broker and MQ Environments during peak times, we knew that we could make a big improvement in performance in IBM WebSphere performance based on our past history of doing this for other MaaS customers.

The Challenge and the Pain in Delivering MaaS

Our client was operating an unsupported IBM WebSphere Message Broker (WMB) version 6 in the production environments responsible for supporting their critical retail stores and web based operations. They also had major components of their HR and backend warehouse systems running on these WMB and MQ environments.

Our job was to not only upgrade these IBM WebSphere applications but also to provide a 24/7 MaaS performance monitoring, troubleshooting, and support services with the expectation of 100% availability of the IBM WebSphere and MQ environments that support their critical business applications during the client’s crucial holiday season.

The Problem and Pain Solution

After designing an upgrade path for both WMB and MQ; our performance monitoring, troubleshooting and support plan included deploying the TransformaTech Monitor product for WMB and MQ monitoring and the Goliath Performance Monitor solution for complete system monitoring of servers and resources.

This MaaS solution kept tabs on several key performance metrics including:

  • Application availability
  • Application Errors and events for the applications
  • Server performance
  • Application incident management and resolution of production issues
  • Weekly, management-level reporting on incidents, environment health and related metrics
  • Application Maintenance, troubleshooting, and development resolutions for the WMB Production environments

The Goliath Performance Monitor solution provided advanced application monitoring capabilities such as the ability to set up custom alerts as well as alert resolution options that kept us two steps ahead of any problems, and equally important, provided consistency across our team when troubleshooting support issues.

And when 100% availability is the client’s requirement, you cannot possibly be proactive enough.

The Results

Our client achieved continuous, efficient operations throughout the peak holiday season including 24/7 availability and high performance of WebSphere Message Broker and MQ. Based on this success, we were retained to continue to provide monitoring and support, subject matter expertise, development support, and knowledge transfer as our client continues to optimize their overall architecture and support additional business requirements.

At TransformaTech, we pride ourselves on “doing whatever it takes” to meet our clients expectations through expert knowledge, dedication, commitment, and hard work, and our partnership with Goliath Technologies has been pivotal in meeting this and other client’s needs as they share this work ethic and philosophy.

We first partnered with Goliath Technologies a few years ago when we were engaged in monitoring the server performance of the Pennsylvania Department of Revenues, and it has been a strong and fruitful business relationship ever since. As MaaS provider, we value Goliath’s willingness to provide flexible business terms and develop solutions that meet our exact requirements.

Goliath offers a fully supported 30-day free trial of their Proactive IT Performance Monitoring Software.

More User Stories:

User Story: Citrix DaaS Provider Reduces Support Tickets

User Story: Citrix DaaS Provider Reduces Support Tickets

In this brief post, I will discuss how specific functionality in our products helped our Citrix service provider partner avoid downtime and improve the economics of his business.

Headquartered near Dallas, XenWinGo, a Citrix Service Provider (CSP) provides customers completely hosted Citrix virtual desktops  that can be accessed by end users anywhere and from any device. XenWinGo’s DaaS service is sleek, streamlined, and simple.  All of the applications customers’ needs (email, office programs, financials, CRM, etc.) are bundled together into one platform that is hosted in a Citrix-based cloud environment.

A problem free Citrix end user experience is essential to retaining their impressive customer base and maintaining an efficient cost structure for delivering those services.  We have partnered with XenWinGo for over five years to help with both.

Mark Gigliotti, President of XenWinGo and its parent company USACI, recently told me that the proactive aspects of our software made it easier to meet their service level agreements and commitments to customers. In addition, he leverages other functionality to support the XenWinGo business model.

Proactive software functionality makes it easier to meet SLA’s

In a recent conversation, Mark explained that XenWinGo initially sought out Goliath back in 2010, because we were “the only true solution with preconfigured tools built to work with Citrix virtual desktops.  This means that we don’t have to write 150 to 200 lines of custom code, nor do we need consultants to configure the software to monitor our Citrix XenApp environments.”

Our development teams have spent countless man hours taking what we have learned about monitoring Citrix XenApp and XenDesktop environments and transforming this knowledge into software functionality designed to provide an out of the box solution for Citrix. Literally, hundreds of monitors are automatically deployed to key points of the infrastructure that must be monitored because they are known failure points. In addition, the technology includes a self-healing capability or remediation actions that are critical in managing a Desktop-as-a-Service (DaaS) business.

For XenWinGo customers, Goliath’s solutions have completely eliminated many previous issues from the customer’s line of vision.  For example, prior to working with Goliath, Mark noted that if one of the print drivers failed, it may not have been noticed by his team until a customer called in to complain about the problem and then the troubleshooting  would begin.

Since employing Goliath’s Proactive Performance Monitoring solution, Mark’s team is proactively notified of impending problems like the print manager issues or other problems such as apps exceeding CPU through alerts that are triggered using thresholds.  This allows the XenWinGo IT staff time to troubleshoot the problem before it impacts the customer. This ultimately reduces support tickets.

Supporting the Service Provider Business Model

Goliath’s technologies have improved XenWinGo’s business economics as well.  With the help of Goliath’s out of the box audit reports, XenWinGo can more accurately report monthly usage to their vendors such as Microsoft, Intuit and Citrix. These reports give detailed information on which users access applications and for what period of time. These reports, and others, can be created as XenWinGo branded reports for distribution to customers.

According to Mark, Goliath has helped XenWinGo to be proactive rather than reactive in managing their business.  “Goliath’s solutions have materially improved both the experience for our customers as well as our operating procedures and at the end of the day, this contributes to a better bottom line for XenWinGo.”

Grow your Service Provider Business with Goliath Technologies

Service providers were some of our earliest customers, so our technology has deep support for the virtual infrastructure including, both server and desktop. We have also taken into consideration the unique business challenges facing service providers and included functionality to support their business model. Many of our customers are providers of DaaS, MaaS, IaaS, RIM, Hosted Applications and Hosted Workspaces.

Please take a moment to learn more about how you can grow your business through Goliath’s Service Provider program.

About the Author: 

The team members collaborated to bring together this blog post by calling on their past Customer Experiences and Expert Knowledge of Citrix Troubleshooting. Beyond writing technical documents this team supports Goliath Customers and provides product feature and function guidance to development.

Citrix Troubleshooting & Proactive Citrix Monitoring Drops Support Tickets by 20%

Citrix Troubleshooting & Proactive Citrix Monitoring Drops Support Tickets by 20%

Val Verde Regional Medical Center

Citrix Troubleshooting & Proactive Citrix Monitoring Drops Support Tickets by 20%

citrix troubleshooting

You know what it’s like to be a part of a Healthcare IT operations team—between the seemingly endless support tickets, Citrix troubleshooting, resource constraints and demand to continually improve the quality of IT services, it’s a lot of pressure. Especially when budgets either stay the same or get slashed.

These are challenges facing most Healthcare IT CIOs. Once such CIO who faced these challenges is Val King, CIO of Val Verde Regional Medical Center (VVRMC). In spite of these challenges Val and his team dropped the overall number of support tickets by 20% and reduced the cost to resolve level 1 support tickets by 98% using Goliath’s automatic resolution and Citrix troubleshooting features.

When Val took over as CIO of VVRMC, his vision and mission became clear: improve patient care by ensuring that physicians and healthcare workers have the ability to seamlessly access vital applications, specifically McKesson Paragon—all while reducing costs.

It’s no small feat, but Val has a plan, which is a proactive approach to Citrix monitoring and managing his organization with and technology that are built for Citrix troubleshooting if the need arises. For Val, this means identifying IT operations challenges and getting ahead of them before they become serious problems.

Infrastructure

Citrix, VMware


Challenge

Reduce IT Support Costs & Improve Quality of Services Delivered

At the top of Val’s list of challenges was the ongoing cost of IT support and the quality of the IT services his team delivered to doctors and healthcare workers. He knew that in transitioning to digital systems there would be a constant increase in the number of projects, but the IT staff would remain capped.

Val knew that to achieve his goal he would need to decrease the frequency of performance issues with proactive Citrix monitoring and thereby reduce the number of support tickets and the cost to service those support tickets. In addition, since there are always performance issues at some point, having a comprehensive Citrix Troubleshooting tool. This would improve the experience of physicians, healthcare workers, and ultimately patients.

In implementing his plan to reduce costs, Val found significant obstacles in four key areas:


  1. The existing legacy IT infrastructure was not sufficient to support the delivery of McKesson applications to every user.
  2. A lack of any cohesive Citrix monitoring strategy that focused on improving.
  3. The need for a proactive technology that could act as an early warning system for the McKesson application that would let the team know there were issues, so they could fix them before end users were impacted. And, if there is an issue, a good Citrix troubleshooting tool.
  4. Finding a andMcKesson performance monitoring solution that was budget-friendly and didn’t require a lot of initial customization and ongoing support from a staff member or specialized consultants.

Solution

Steps to Success

The first step was to ensure that VVRMC had a solid IT infrastructure base that could support the number of end users who needed uninterrupted access to their applications. Val worked to gain the support of the hospital CEO and Board to upgrade the IT delivery infrastructure, including the network, and implementing Citrix to deliver McKesson applications to physicians and healthcare workers.

The second step was to establish a proactive Citrix monitoring strategy that focused on the end user experience with McKesson, while also incorporating information from Citrix, VMware, and the supporting infrastructure. This would provide his team with visibility into all the elements, allowing the team to quickly isolate root cause and undertake real resolution actions.

This step proved especially difficult for Val and his team. Most products on the market are expensive, difficult to implement, and are architected for a different time when server and desktop virtualization didn’t exist. Most importantly, these products lack the ability to correlate Citrix end user experience, McKesson application performance data, and supporting infrastructure performance metrics, including VMware. This makes Citrix Troubleshooting practically impossible.

Eventually, Val found Goliath Technologies, which is purpose-built for proactive Citrix monitoring, analysis, reporting, troubleshooting and remediation and offers an application module for McKesson. Goliath’s software was able to bring together Citrix, Virtual Servers, such as VMware, End User Experience, McKesson, and existing legacy infrastructure into a single view—all at a price point that was lower than any alternative solution.

Results

By upgrading the infrastructure and implementing Goliath’s Proactive Citrix Performance Monitoring & Citrix Troubleshooting software, Val was able to both lower support ticket costs and improve access to applications.

Leveraging Goliath’s alerting functionality, support ticket volume dropped by 20%. Goliath’s software made this reduction in support tickets possible by proactively identifying problems and triggering alerts before end users were impacted.

The escalation costs of support tickets also dropped significantly. Level 1 support tickets normally cost $22 at VVRMC, but with Goliath’s automated fix actions, the software can fix the problem without having to get a person involved. This led to the cost of a Level 1 ticket dropping to only 50 cents, which is a 98% cost reduction.

Of course, these reductions, while positive, are ultimately second to the actual experience of the physicians and healthcare workers that rely on Val and his team. After implementing his Proactive approach to IT Operations and deploying Goliath’s Citrix monitoring software, an internal survey found that the team’s Quality of Service Rating among end users improved by 17%, leading to an overall approval rating of 93%.

Even with all these positive outcomes, Val admits that there is still work to be done. However, he and his team know they are on the right track and are confident that when a physician or healthcare worker is meeting with a patient that they will be able to access the applications they need to deliver the best patient care possible.

If you would like to learn more about Val’s proactive approach to managing IT Operations, view a recording of his CIO Insight Webinar

Chris Hughes

ABOUT VVRMC

Val Verde Regional Medical Center is a healthcare facility located in Del Rio, Texas, providing a range of medical services to the community. Known for its commitment to quality patient care, the center offers comprehensive healthcare solutions, including emergency services, diagnostics, and specialized medical treatments.

Headquarters location: Texas, United States
Founded: 1959
Employees: >700
Industry: Healthcare