Amazon AWS Monitoring & Troubleshooting for a Top 10 Retailer

Amazon AWS Monitoring & Troubleshooting for a Top 10 Retailer

User Story: Proactive Amazon AWS Monitoring & Troubleshooting for a Top 10 Retailer

The Organization: Top 10 Online Retailer

The Organization’s Infrastructure: VMware vSphere, Citrix XenDesktop, AWS EC2

The Organization’s Performance Monitoring Products: Goliath for Monitoring AWS

The Business Challenge: AWS

The retail organization discussed in this post faced challenges with the influx of web traffic to their online store during the holiday season. Their plan was to move to a hybrid cloud infrastructure during the busy season. This required them to expand their private cloud or on-premises to Amazon AWS to leverage Amazon AWS resources during the busy season. Leveraging Amazon AWS allowed them to expand capacity only when needed. The strategy to burst to the AWS cloud made it so they did not have to make a substantial capital investment that would only be leveraged two months per year. However, for the solution to make economic sense, they needed an AWS monitoring and AWS troubleshooting solution that would allow them to monitor their existing resource utilization and their cloud resource consumption simultaneously. It was critical to monitor AWS and the on-premise infrastructure, which included Citrix XenDesktop on VMware vSphere, with the same technology to ensure they were delivering the most efficient and cost effective experience to their customers.

As seen in the image below, with Goliath for AWS Monitoring, the administrators can separate their on-premise infrastructure in the data center, Amazon AWS and Citrix XenDesktop environment into groups within the same console for a central view of all infrastructure. This heat map allows the administrator to monitor AWS and on-premise infrastructure and have icons register as red if there is an issue.


The Solution

The retail organization chose Goliath for AWS Monitoring and AWS Troubleshooting as their Hybrid Cloud monitoring solution. Ease of use, flexibility, real-time alerting and historical reporting made Goliath an obvious choice for monitoring AWS and their internal cloud infrastructure. As depicted above, in addition to monitoring AWS from Goliath provided them with visibility into their cloud infrastructure allowing them to understand the health and resource consumption status of all compute resources.

AWS Monitoring Includes Real-Time Alerting on Resource Consumption

Flexible, real-time alerts were configured as depicted below based on resource location. This provided the flexibility to monitor cloud resources differently than on premise. On premise, resources are monitored to understand the best time to “burst” into the cloud, while Amazon AWS resources are monitored to ensure that consumption costs are understood and controlled. In the image below Goliath for AWS Monitoring enables an administrator to set alerts based on consumption thresholds and consumption duration for example which are triggered when the threshold is breached. This allows the administrator to know exactly what resources are being used and the corresponding cost. This is designed to help IT control costs and increase awareness resource utilization in real-time.


Managing Dynamic Workloads Out-Of-The-Box 

In a hybrid cloud, infrastructure workloads are dynamic and may move from one infrastructure location to another for various reasons including general migration, resource expansion (bursting) or component integration. As previously discussed, monitoring requirements change depending on their location. To support this, monitoring rules must be as dynamic as the workloads themselves. If they are not, resources will not be monitored properly, and the solution will be ineffective. Furthermore, if the solution is not as dynamic as the workloads themselves, there will be a significant amount of administrative overhead manually reassigning rules as workloads move. Goliath for AWS Monitoring provides dynamic flexibility through group-based policy assignments, as depicted below. When workloads move from one location to another, simply changing the workload’s group membership ensures that the appropriate monitoring policies are assigned to the workload instantly. This functionality was a significant requirement for the retailer as their hybrid infrastructure was dynamic by design.


In the below image an administrator can receive real-time alerts from AWS monitoring right to their phone. Importantly, Goliath has out-of-the-box monitoring rules preconfigured to look for resource consumption and other performance metrics. Also, to facilitate AWS troubleshooting the pre-configured monitors look for failure points and can alert in real time if they are detected. This can improve time to resolution


AWS Monitoring Includes Real-Time Dashboards

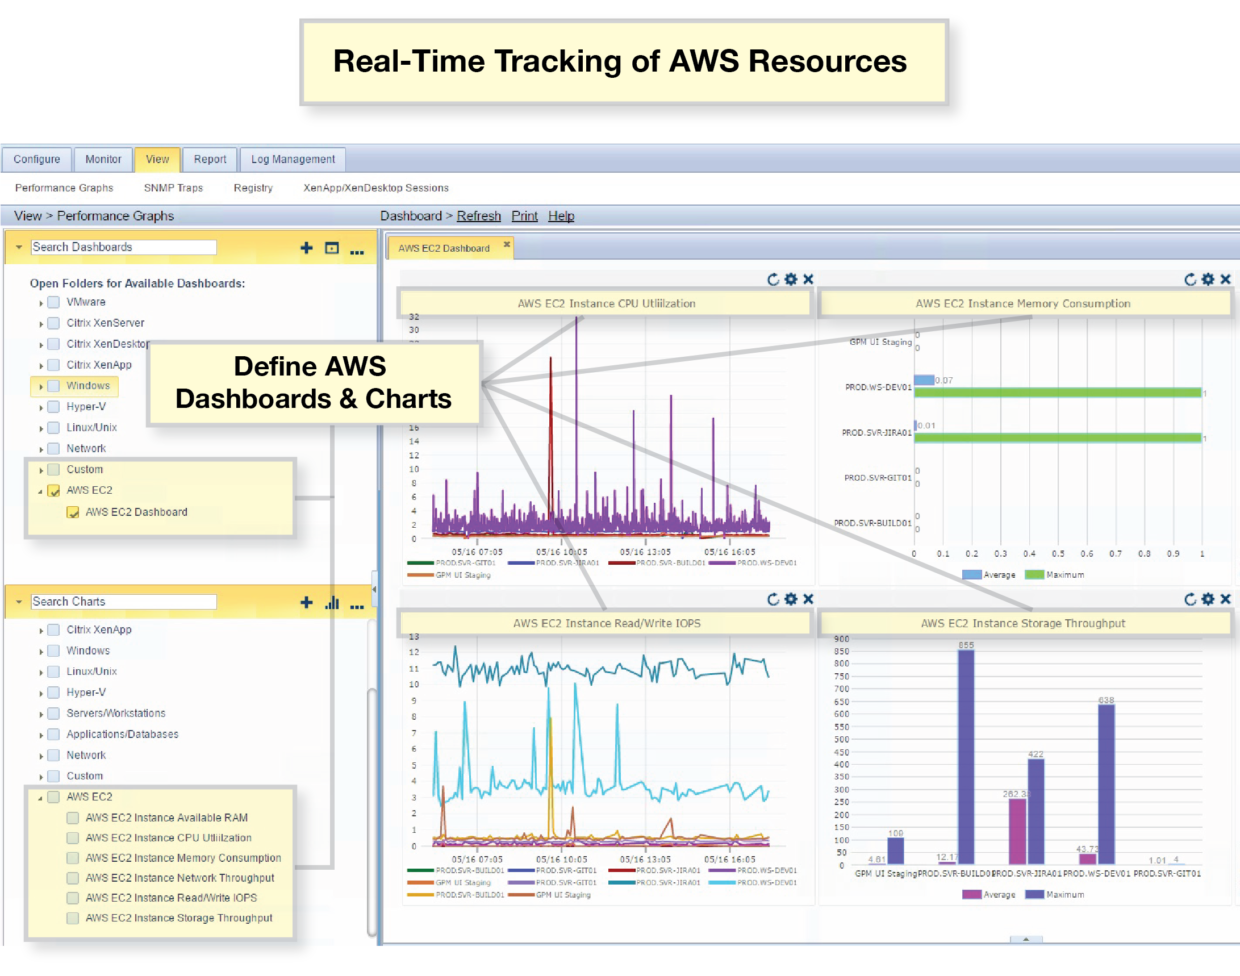
Pre-configured and therefore out-of-the-box dashboards provide both a real-time health check and historical trending perspective to the environment. In just a few clicks, the performance of the Amazon AWS infrastructure, the private cloud or both is instantly visible. In the screenshot below, on the left-hand pane, you can just select any set of IT elements from either Amazon AWS or the internal cloud you want to monitor and it will draw the chart on the right. This allows an administrator to proactively, and in real time, identify any concerning trends or assist in AWS troubleshooting.


The Summary of AWS Monitoring and AWS Troubleshooting for Hybrid IT

Many organizations are faced with new challenges when managing hybrid cloud infrastructures, and the retailer discussed today is no different. The metrics gathered, monitored and alerted on provide different value based on whether the workloads are hosted on-premise, or in the Amazon AWS cloud. But, one thing is clear—AWS monitoring and AWS troubleshooting—is important as part of this hybrid infrastructure. If an IT group doesn’t have a single complete view of the entire hybrid infrastructure there is an inherent risk.

Goliath provides the flexibility, visibility and analysis tools needed for modern, dynamic hybrid architectures and it is also flexible enough to deliver the metrics in a way that applies to every scenario—on-premises or in the AWS cloud.

Get a 30-day Free Trial of Goliath’s Proactive IT Operations Software

All of the proactive IT performance monitoring and management products featured in this article are available for you to try in your own environment. You can download a fully supported 30-day free trial today. Simply click below to access.


Get a 30-day Free Trial of Goliath’s Proactive IT Operations Software

All of the proactive IT performance monitoring and management products featured in this article are available for you to try in your own environment. You can download a fully supported 30-day free trial today. Simply click below to access.

Access Cloud GPM Free Trial

About the Author: 

The team members collaborated to bring together this blog post by calling on their past Customer Experiences and Expert Knowledge of Citrix Troubleshooting. Beyond writing technical documents this team supports Goliath Customers and provides product feature and function guidance to development.

User Story: Citrix Troubleshooting Assessment Reduces Support Tickets by 25% in 30 days

User Story: Citrix Troubleshooting Assessment Reduces Support Tickets by 25% in 30 days

Citrix Printing Issues Troubleshooting Assessment Reduces Support Tickets by 25%

The Business Challenge: A customer was experiencing persistent Citrix XenApp and XenDesktop performance issues related to printing and the logon process. After trying to troubleshoot the issues on their own, the root cause could not be determined without the assistance of Goliath Technologies.

The Solution: To start, the client requested a Citrix troubleshooting engagement to investigate the root cause of persistent performance issues. Before seeing the observations and reports that Goliath was able to provide, it’s important to understand the customer’s infrastructure elements at the initial stage of the Citrix Troubleshooting Assessment. Goliath’s Citrix Monitoring solution was deployed to the following infrastructure elements:

After the implementation, out-of-the-box rules and dashboards were automatically applied to the inventory. A follow-on configuration effort was then initiated to deploy agents and build custom rules and reports to identify printing and profile issues; it was essential to deploy agents to the delivery infrastructure in order to achieve end-to-end visibility and determine the root cause. After collecting data for two weeks, the Goliath Support team came back with observations related to:

  • Printing Issues
  • Profile Problems
  • Other Citrix Troubleshooting findings

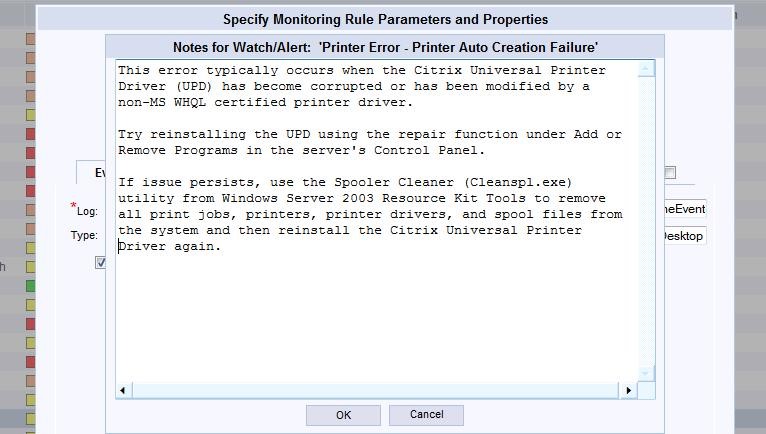
Using Out-of-the-Box Monitoring Rules, like the one pictured below, were useful to identifying and preventing these Printing Issues from occurring in the future. Having the ability to enter Notes into the specific rule allowed the Help Desk and other IT Administrators to collaborate on issues and troubleshoot issues more effectively and efficiently.

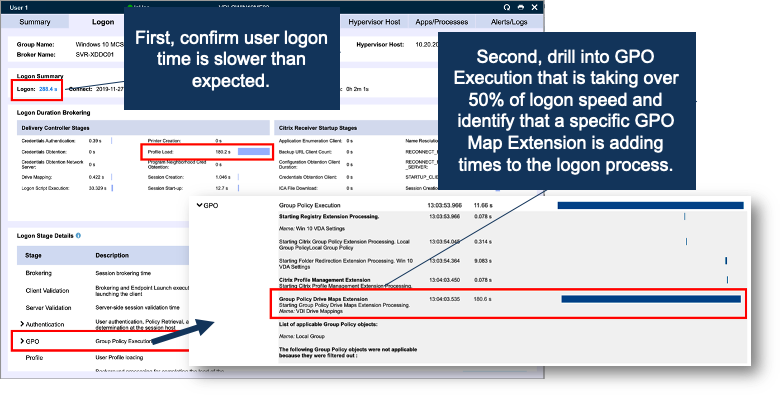
After identifying the specific Printing issues, Profile problems appeared to stem from underlying registry and security issues, outlined below:

Finally, as the Goliath Support team worked through the issues and problems related to Printing and Profiles, other Citrix Troubleshooting findings were documented.

The Summary: By completing the Citrix troubleshooting assessment and implementing the recommended fix actions provided by Goliath Performance Monitor and Goliath Application Availability Monitor, Citrix support tickets decreased by 25% within 30 days.

Goliath vs. Citrix Comparison

About the Author: 

The team members collaborated to bring together this blog post by calling on their past Customer Experiences and Expert Knowledge of Citrix Troubleshooting. Beyond writing technical documents this team supports Goliath Customers and provides product feature and function guidance to development.

How We Did It: Augusta Health IT Resolves MEDITECH and Citrix End User Issues & Improves Patient Care

How We Did It: Augusta Health IT Resolves MEDITECH and Citrix End User Issues & Improves Patient Care

How We Did It: Augusta Health IT Resolves MEDITECH and Citrix End User Issues & Improves Patient Care

Augusta Health Logo

Editor’s note: this post is from Mike Tremel, Sr. Systems Engineer VCP5-DCA at Augusta Health. Mike explains how his Healthcare IT team proactively reduces troubleshooting tickets and improves remediation time by combining data from MEDITECH, Citrix and VMware in a single performance monitoring console.

The Challenges Facing IT

Augusta Health is a community hospital with 4,000 MEDITECH end users and 255 physicians. The challenge was that we lacked a purpose-built technology that brought together the three key components of the IT infrastructure that impact the end user experience with our EHR application:

  1. MEDITECH
  2. Citrix XenApp
  3. VMware

Not having a single software solution that gave us visibility and performance data from MEDITECH, Citrix XenApp and VMware caused significant issues when we attempted to resolve complaints or support tickets that claimed MEDITECH was slow.

Historically, our IT team deployed multiple products and utilities to manually disqualify each potential failure point until we determined the root cause. The other problem was that we spent more time figuring out what wasn’t causing the end user performance issues than what was.

Achieving Proactive with a Simplified Solution

While we were working to find fixes for performance issues, we began defining specific IT requirements for a technology that would solve our problems based on the gaps in visibility, such as:

  • MEDITECH servers and how they are performing
  • Deep performance metrics on Citrix XenApp and all of our VMware virtual machines
  • End user experience, such as Citrix logon duration and Citrix HDX & ICA latency

As a Healthcare IT team we agreed that the ultimate solution would simplify the process of EHR/Citrix/VMware performance monitoring, close our gaps in visibility and bring all of this data into one console.

As we searched for the type of solution we envisioned, we realized it would require a tremendous investment in licensing, consulting, customization or deploying multiple products. And although VMware offers vCenter Operations Manager, it doesn’t give visibility into any data outside of VMware, like MEDITECH and Citrix, so it required us to consider additional products to find and fix the root cause of end user performance issues.

The Solution

We reviewed other very good technologies such as ControlUp and eG Innovations, but we selected Goliath Technologies. Their software was right for us because it brings together, in one console, the performance metrics for MEDITECH, Citrix XenApp, and VMware.

How Augusta Health Uses Goliath’s MEDITECH Performance Monitoring Module

Here’s how we leverage Goliath’s technology:

  • Reduced troubleshooting times by being able to see at a glance our entire MEDITECH and VMware server infrastructure so we can quickly rule things out as potential root cause issues. For instance, I can quickly rule out host, storage latency, memory and CPU on all my MEDITECH and VMware servers.
  • Improved end user performance and putting a stop to the blame game. If I have an end user complaining that MEDITECH is slow I now have actual data on whether it is actually slow or not and why. I am armed with real time details of each logon stage and Citrix ICA channel utilization to more effectively determine the root cause of “slow.” The blame game is stopped cold with objective evidence as to the root cause of the issue! And, more often than not, it isn’t the MEDITECH application.
  • Documenting the end-user experience on Citrix using performance metrics pertaining to a user’s Citrix session (both logon times and performance in session) allows us to compare and contrast reported slowness to actual values and trends over time. We sometimes get reports that “my logon time this morning was a lot slower than yesterday,” or “it has taken longer to login every day this week.”
  • Proactively manage MEDITECH by using the purpose-built module to see many key metrics like queries in/out and read & write times to each of our file servers. By routinely watching these metrics, we can see how performance changes over time; and not just when there are reports of slowness, but also during “normal” times. The Goliath Performance Module for MEDITECH has given us insight into our MEDITECH performance that we didn’t have before.
  • Overall the product has given us the ability to see trends over time and build a “benchmark,” which gives us insight to determine if a problem occurs and if it falls into a window of “normal” activity.

All of these features are out of the box. This is only possible because the technology is purpose built for MEDITECH, Citrix and VMware. It only took about a day of consulting for installation, configuration and training. As importantly, a byproduct of being purpose built is that it is easy to use so we utilize the product almost daily for proactive health checks.

To see it for yourself, I encourage you to get a free demo or fully-supported 30 day free trial of Goliath’s MEDITECH Performance Monitoring Module.

Browse EHR Monitoring & Troubleshooting Webinars

User Story: Goliath Enables Accelera’s Application Availability & Testing Service

User Story: Goliath Enables Accelera’s Application Availability & Testing Service

User Story: Goliath Enables Accelera’s Application Availability & Testing Service

“We wanted to add a proactive, automated, cloud-based monitoring service to our current portfolio of Microsoft Azure cloud solutions. Our objective was to provide our customers with the capability to confirm that Citrix delivered applications will launch, reliably, every day, before end users even get to work, and if they don’t, send us an alert so we can fix it before users are impacted. Our decision to partner with Goliath Technologies was based on their unique ability to provide technology that supports all the areas of the service and they fully understand the business of managed service providers, so we have great confidence in their ability to support us long term.”
– Steve Weiss, President and COO at Accelera Solutions


The Organization:  Accelera Solutions, Managed Service Provider

The Organization’s Infrastructure:  Citrix XenApp, Citrix XenDesktop, Microsoft Azure

The Organization’s Performance Monitoring Products: Goliath Logon Simulator for Application Availability Service

The Business Challenge: Azure Hosted Desktop Availability

Accelera Solutions is one of the premiere managed services providers in existence today who use Microsoft Azure as a hosting provider. Remote infrastructure services, RMM and desktop-as-a-service (DaaS) delivery are the main services they offer. One of the key challenges for Accelera has been providing Citrix application and desktop availability assurance for their Azure hosted Citrix delivered applications and desktops. The desire was to deliver a solution to their clients that would provide them with advance warning before Citrix application and/or Citrix desktop availability issues occurred. So something with preemptive alerting so they know before their users know. Advance warning of Citrix logon issues would give them time to remediate the issue before users are impacted.

The key criteria for consideration was a solution that could exercise every aspect of the logon process in concert to validate that infrastructure components are available and deliver the application successfully; even the infrastructure elements in Microsoft Azure. Furthermore, the solution required enterprise features and had to be able to scale in order support their expansive customer base.

The Solution

Goliath Technologies was selected by Accelera to deliver Citrix application availability services to their customers. This selection was made because of the unique, industry-first capabilities that only Goliath could enable Accelera to provide. These capabilities are listed below:

  • True Citrix Delivery Infrastructure Validation – Confirms that the entire Citrix delivery infrastructure will work at the time of access. This includes NetScaler, Storefront, Delivery Controller, XenDesktop, XenApp, Active Directory, and Virtual Server Infrastructure.
  • Real-Time Alerting – Advance warning alerts to application failure or logon/launch slowness.
  • Reporting – On-demand or scheduled historical analysis of launch success and failures.
  • Dashboard – Real-time view of logon tests and successful/failure validation

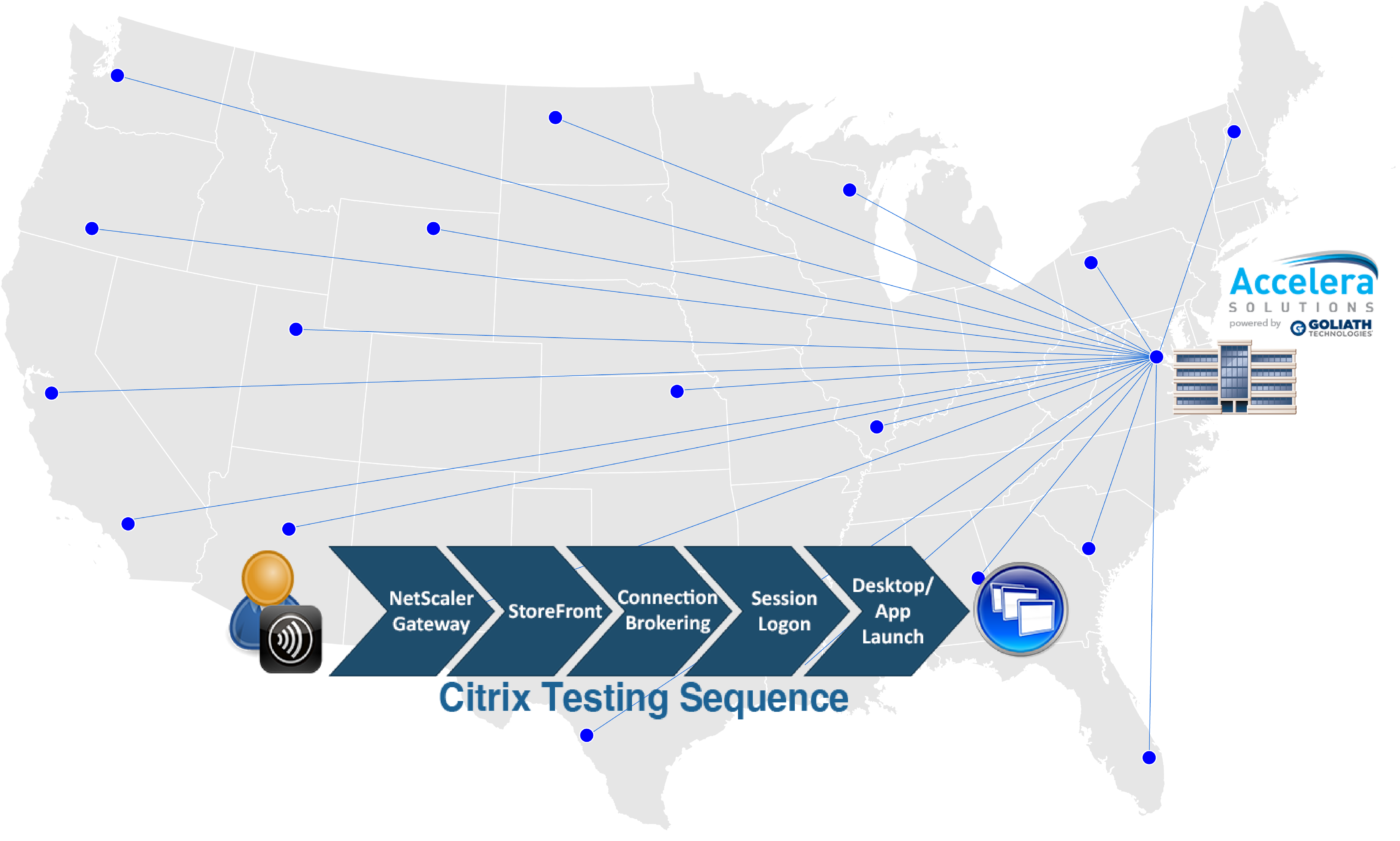
The Accelera service does not require software in the customer’s data center and is fully delivered from the Azure. Every day, three hours before users arrive at work, Goliath automatically executes a Citrix logon and launch validation to make certain the Citrix delivery infrastructure is up and available. The service allows for the testing of customer published applications and/or virtual desktops on a scheduled basis, regardless of the customer location, as seen in the image below. 

About the Author: 

The team members collaborated to bring together this blog post by calling on their past Customer Experiences and Expert Knowledge of Citrix Troubleshooting. Beyond writing technical documents this team supports Goliath Customers and provides product feature and function guidance to development.

Citrix Troubleshooting Isolates & Solves MEDITECH Failures

Citrix Troubleshooting Isolates & Solves MEDITECH Failures

User Story: MEDITECH Logon and Session Issues Solved – Support Tickets Drop 35%

goliath-technologies-blog

The Organization: Health Care System

The Organization’s Infrastructure: Citrix XenApp 7.16, VMware vSphere, and MEDITECH


The Pain: Clinicians complaining about MEDITECH application performance

A major healthcare organization faced chronic complaints from end users regarding the performance and responsiveness related to clinical and business applications delivered by Citrix XenApp 7.16 including MEDITECH. For example, in the morning, right when physicians began to see patients, there were hundreds of calls to the help desk regarding MEDITECH and Citrix XenApp 7.16 logon failures and Citrix latency or session slowness.

The primary challenge was that there was no Citrix monitoring that would provide visibility into the underlying delivery infrastructure. Without this visibility, it makes effective MEDITECH and Citrix Troubleshooting almost impossible. Additionally, these issues were sporadic, so isolating root cause was like finding a needle in a haystack. This required a historical record of windows event logs that could be indexed, analyzed and filtered to isolate the critical data points in order to correlate the data, find root cause and resolve the issue.

The MEDITECH & Citrix Troubleshooting Solution:

Goliath for Citrix Monitoring of Citrix XenApp 7.16 with the MEDITECH Module delivered the solution that the organization needed. Beyond the basic monitoring components, the Citrix monitoring and Citrix troubleshooting software also has built in functionality for event log management. As soon as the Citrix monitoring and Citrix troubleshooting technology was configured, it began to provide critical visibility that Citrix administrators did not previously have. The information they needed was provided by the Windows Event Log Analysis Report, one of the 66 reports available out-of-the-box with GPM. This windows event log analysis report rolled up the most important failures and faults into a single summary, eliminating non-essential data points, and, thereby, speeding up the manual process of individually checking windows event logs on the servers. The Goliath MEDITECH Module allowed the administrators to pull MEDITECH specific metrics into the reports as well. As a result, Citrix administrators were able to analyze and assess Citrix XenApp 7.16 server-side issues in a matter of minutes, rather than the days or weeks it took before the technology was in place.

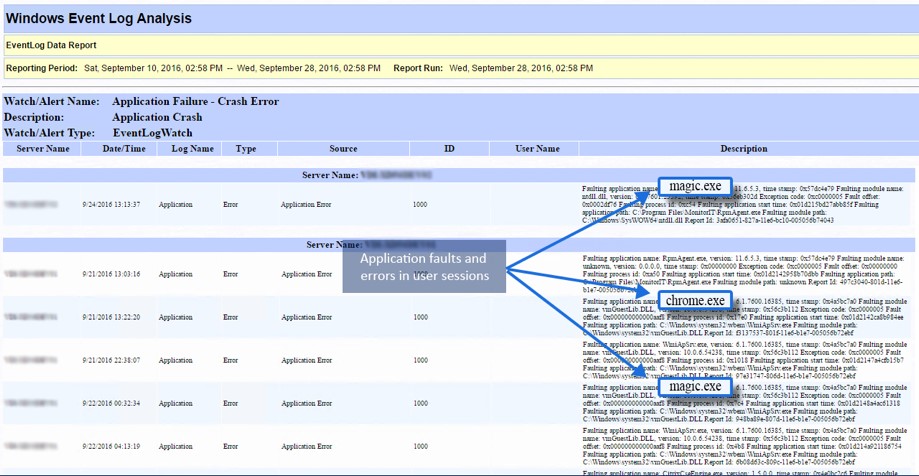
By utilizing the windows event log report, the Citrix administrators noticed that each day there were a multitude of application crashes and hangs for their five most business critical applications, two of which were MEDITECH applications. This was particularly concerning because each application crash event represented a time when a user was unable to logon or pull patient data from the system.

The image below depicts the Windows Event Log Analysis Report and how it presents the data.

meditechblog1011

The windows event log management reports provided great value in pinpointing the root cause of these MEDITECH issues and allowed administrators to work with the application vendors to resolve the existing problems. However, the IT team also recognized that these issues were not likely to be a one-time occurrence as their experience had shown them four things:

  1. Application crashes related to these five applications were reoccurring over time.
  2. The root cause and resolution for these issues was consistently the same and could be documented.
  3. They could permanently fix the issue if addressed early, thus, the issue could be prevented from becoming a widespread issue.
  4. They could set proactive alerts to make sure that they would get advanced warning in the future based on certain events being triggered.

This windows event log management feature also provided the necessary information required to open a task with MEDITECH to assist MEDITECH support with resolving certain issues that were specifically related to the MEDITECH application.

The Summary:

The Windows Event Log Analysis Report, Citrix Monitoring, Citrix Troubleshooting and the MEDITECH module all proved to be a comprehensive solution that the customer was able to use to easily identify problems in the environment and, subsequently, configure alerts to address the problems in advance of them becoming widespread. In addition, management used the data from the Citrix monitor to more accurately track the health of the environment which enabled the team to effectively communicate how problems were manifesting, resulting in more productive collaboration with application vendors. This combination of reporting and alerting has empowered the health system to become proactive in their strategy to identify and address issues in their Citrix environment.

Get 30-day Free Trial or Demo of the MEDITECH Module

Click here to get a fully supported 30-day free trial or demo of the MEDITECH Module.

Additional Resources:


Want To Learn More?

Browse our upcoming webinars to see our software in action!

Browse EHR Monitoring & Troubleshooting Webinars

Universal Health Services Troubleshoots End-User Experience Issues at Their Hospitals

Universal Health Services Troubleshoots End-User Experience Issues at Their Hospitals

Universal Health Services Troubleshoots End-User Experience Issues at Their Hospitals

Justin Monnig“My experience with Goliath Technologies goes back several years from my time at UHS. They have the only solution of this kind that combines the ability to preemptively alert us if clinicians will have difficulty when attempting to access Citrix & Cerner. This provides us with an early warning system that is better than real time and is one of the reasons we selected Goliath as a partner.” – Justin Monnig – General Manager of Crossings Healthcare Solutions, a subsidiary of Universal Health Services, Inc. 
Infrastructure:  Citrix XenApp, Citrix XenServer and VMware

Performance Monitoring Products: Goliath Performance Monitor for Hospitals Using Cerner, Goliath Logon Simulator for Citrix, Goliath for NetScaler

The Business Challenge

UHS, one of the ten largest healthcare management organizations in the United States, was faced with session performance-related issues when physicians and healthcare workers used XenApp delivered applications hosted by Cerner.

Due to the factors detailed below, pinpointing and resolving their issues was especially challenging:

  1. There were no real-time performance metrics accessible from the underlying Citrix XenApp delivery infrastructure components.
  2. Limitations in visibility were not isolated to just the XenApp servers. There was a significant lack of insight into Citrix ICA/HDX sessions.

These issues presented barriers to UHS solving their end-user experience challenges. The fact that Cerner was seeing everything performing correctly from an application standpoint meant that the issue was occurring somewhere between the application and the user. Without having visibility directly into sessions or ICA/HDX, it was difficult for the UHS IT team to ascertain whether the issues were symptoms of network-related problems.  They also lacked visibility into the XenApp servers, which limited the extent of their insight into the delivery infrastructure. In short, they were blind to the entire scope of where the root cause would be found.

The Solution

Goliath Technologies had been used by UHS Corporate to monitor and manage their Citrix environment for several years, so the Cerner team at UHS quickly identified Goliath Technologies as the vendor to help them overcome their challenges. They knew Goliath’s suite of technologies provides complete end to end visibility to the entire Citrix user experience from the connection through the whole delivery infrastructure.  While the data and metrics provided by Goliath’s technology alone set it apart from other tools, the major differentiator for UHS was that the Intelligent Agent could be deployed on the XenApp servers hosted at Cerner’s Kansas City datacenter. Then, the Goliath Application Availability Monitor was configured at each remote hospital location to test and confirm applications would launch. This meant for the first time, the entire Citrix workflow could be analyzed end to end. Furthermore, the data and metrics gathered could be used for proactive alerts and historical reporting.

UHS Proactive Deployment Architecture

For the purposes of this blog post, I will focus on the benefits of having the Intelligent Agents deployed in the Kansas City Data Center. For more on the Goliath Application Availability Monitor for Cerner Hospitals please see the blog post dedicated to this specific use case.

By having Goliath installed across their entire environment’s XenApp infrastructure and hospital locations, administrators were furnished with the actionable intelligence they needed to accomplish the following:

  • Identify users who may be experiencing poor performance by analyzing ICA latency, ICA/HDX channel performance, network latency, round trip time (RTT), and connection speed/performance.
  • Identify server and application performance bottlenecks that could impact end-user performance.
  • Have a real-time view of the entire delivery infrastructure from a single pane of glass to pinpoint and correlate root cause.

ICA/HDX Performance

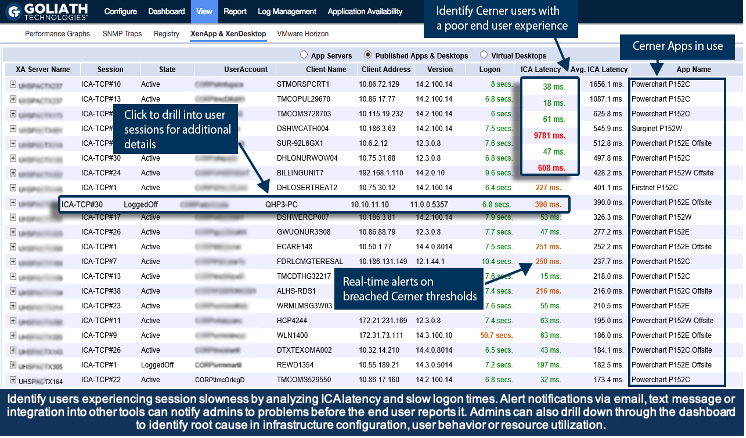
Goliath Performance Monitor allowed administrators to view user sessions in real time and historically. The session view provided critical information for identifying if session performance issues were network related or session related. This is done by differentiating network latency from ICA latency, and then correlating the metrics to ICA round trip time. Also, by drilling deeper into each session, the UHS team was also able to view the activity of each session and see how each of the 50 individual HDX channels impacted user sessions.

These capabilities proved to be invaluable as many of the session performance issues were related to network problems on the UHS side. This data pinpointed the exact cause and provided UHS with the data needed to resolve them quickly.

Below is the user session display used for troubleshooting session performance issues.

Cerner session display

ICA/HDX Performance

Goliath Performance Monitor allowed administrators to view user sessions in real time and historically. The session view provided critical information for identifying if session performance issues were network related or session related. This is done by differentiating network latency from ICA latency, and then correlating the metrics to ICA round trip time. Also, by drilling deeper into each session, the UHS team was also able to view the activity of each session and see how each of the 50 individual HDX channels impacted user sessions.

These capabilities proved to be invaluable as many of the session performance issues were related to network problems on the UHS side. This data pinpointed the exact cause and provided UHS with the data needed to resolve them quickly.

Below is the user session display used for troubleshooting session performance issues.

XenApp Server Performance & Errors

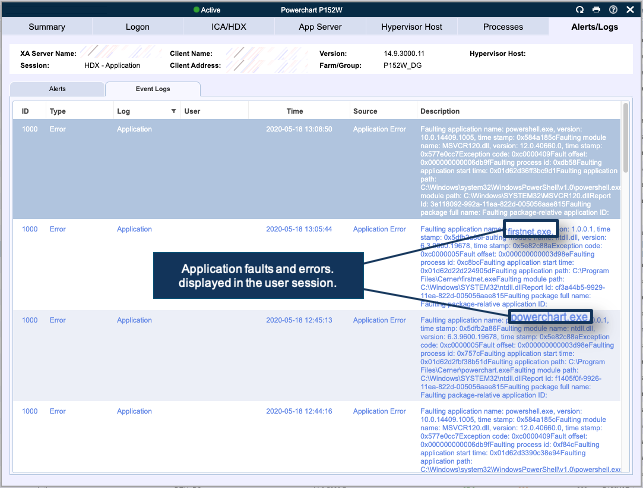
By leveraging the Goliath Intelligent Agent on the Cerner XenApp servers, the UHS team gained both real-time and historical insight into server performance and activity. This provided them with the ability to see and understand when server side issues occurred.

After gaining an understanding of what conditions impacted user experience and how each correlated to problems, the UHS team used their observations to create threshold based alerts. The alerts enabled them to become aware of server side issues before the user community was impacted (See image below on how alerts also can be displayed within the user session display showing).

In addition to being leveraged for creating alerts, the server metrics gathered by Goliath were also put to work in the form of historical reports. These reports proved to be invaluable as the information could then be used for collaborating with application owners to address root cause.

Cerner session display

XenApp Server Error Report

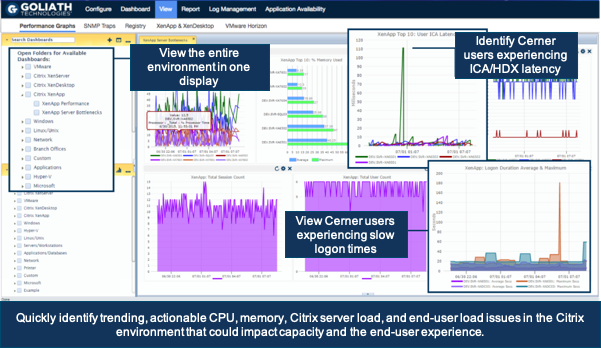
The final piece to having a complete solution was a single view of the entire delivery infrastructure. The goal was to have complete perspective for identifying session issues and correlating them to the network, infrastructure, or XenApp server immediately upon receiving notification. This was accomplished by leveraging the real-time performance graphs available out-of-the-box in Goliath Performance Monitor.

The UHS team configured a fully customized dashboard to view the entire delivery infrastructure end to end. Logon, statistics, ICA latency, server performance, and application load could all be viewed on one screen, empowering the support team to quickly identify and drill into the root cause of session problems as they occurred.

Below is an example of the real-time dashboard configured by UHS.

Cerner session display

The Summary

Goliath Performance Monitor for Hospitals with Cerner gave UHS insight into the delivery infrastructure that was needed to not only resolve end-user session challenges, but it also gave them the ability to proactively identify and address the issues before they impacted productivity. This was accomplished by leveraging network and ICA channel visibility, proactive alerting, historical reporting, and real-time dashboards.

Click here to get a fully supported 30-day free trial or demo of Goliath for Hospitals Using Citrix & Cerner.

Additional References


Want To Learn More?

Browse our upcoming webinars to see our software in action!