Hospital Using Epic Hyperspace Reduces Epic & Citrix XenApp Logon Times by 80%

Hospital Using Epic Hyperspace Reduces Epic & Citrix XenApp Logon Times by 80%

How We Did IT

Hospital Using Epic Hyperspace Reduces Epic & Citrix XenApp Logon Times by 80% 


Hospital Using Epic Hyperspace Reduces Logon Times by 80%

“Without a doubt, there is no comparison between the level of detail found in Goliath Performance Monitor and other tools like Director, etc.” 

— George Spiers, CTP

Infrastructure

Citrix XenApp, Epic Hyperspace


Challenge

Citrix Architects Spend Too Much Time Troubleshooting Citrix Clinicians report slow logon times, IT pinpoints root cause and permanently fixes issue.

The below screen shots were provided by a large non-profit healthcare organization that uses Citrix XenApp to deliver Epic Hyperspace and other business and clinical applications to over 5,000 physicians, clinicians and healthcare workers. The Healthcare IT team received support tickets from various end users about slow logon times. This document describes how the Citrix engineer used Goliath Performance Monitor to pinpoint and troubleshoot the “Citrix is Slow” complaint and implement a fix action that permanently resolved the issue and reduced logon times for the impacted users by more than 80%.

Solution

Logon Duration Drill Down Identifies Root Cause

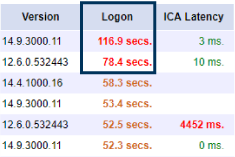
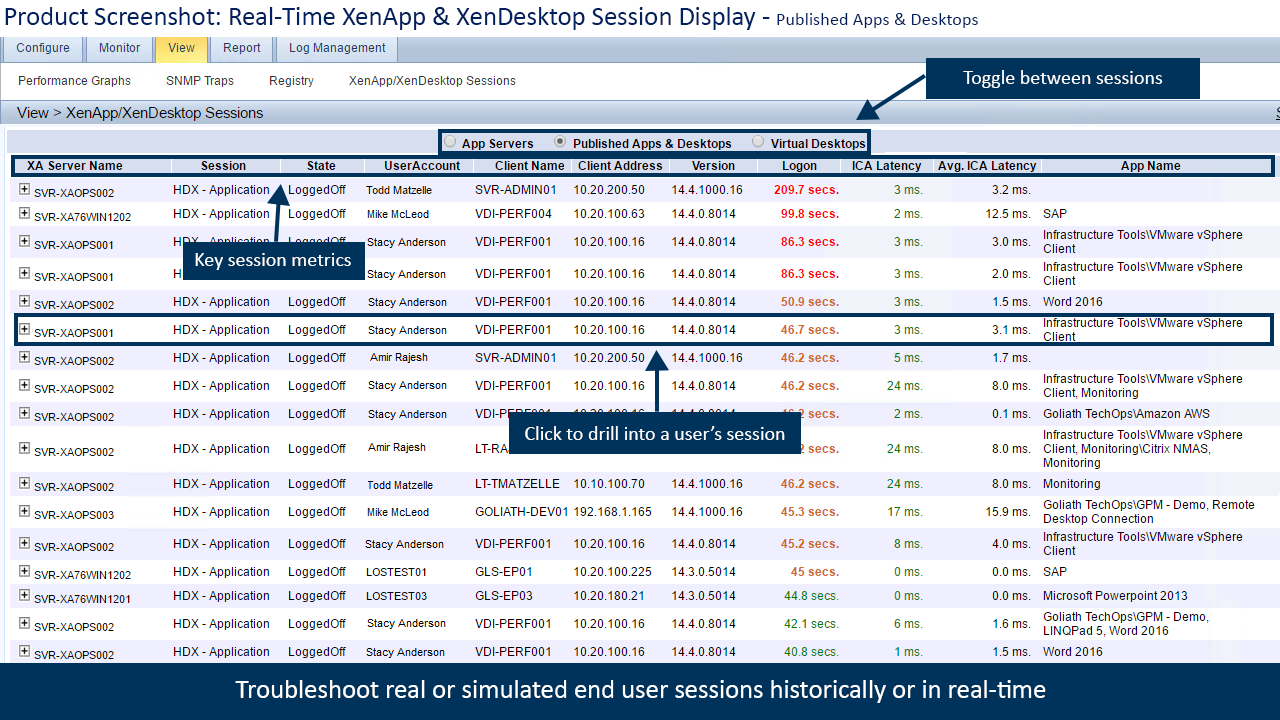
After receiving complaints about long Citrix XenApp logon times, the Citrix engineer used the session display to troubleshoot Citrix connection by sorting logon times.  They then identified a session with a logon time of nearly two minutes (Figure 1)– much too long in a hospital setting where clinicians were often logging in to multiple machines as they provide patient care in 20-minute increments.

Find sessions with high logon times

Figure 1: Using sort to quickly find sessions with high logon times. 

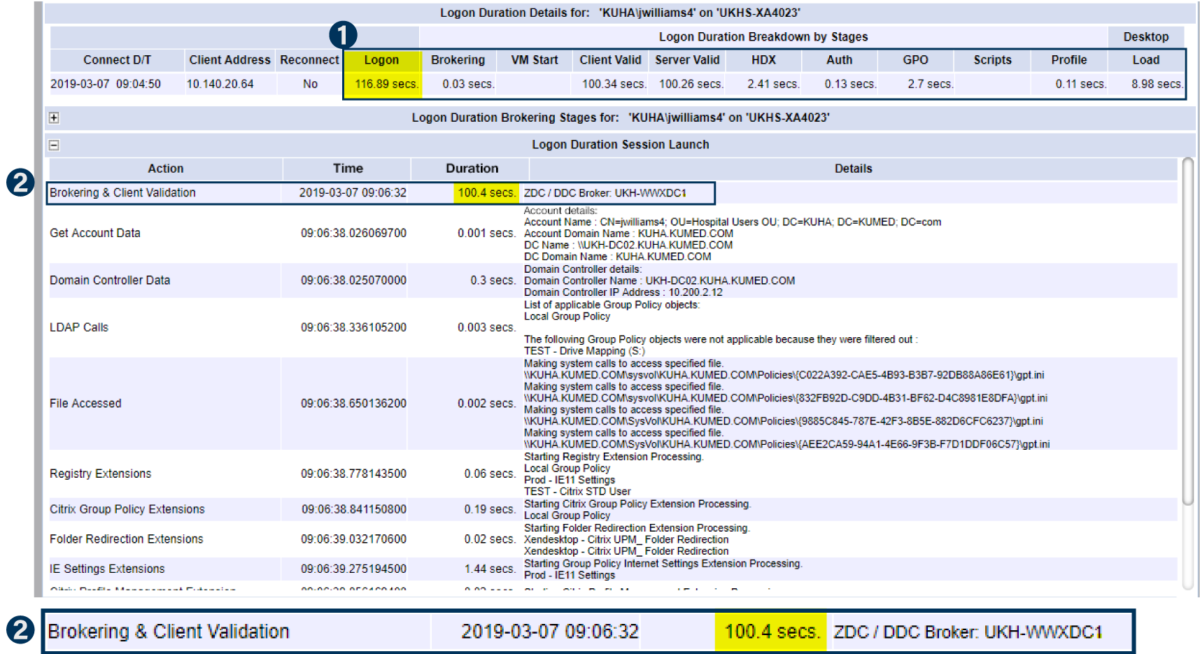
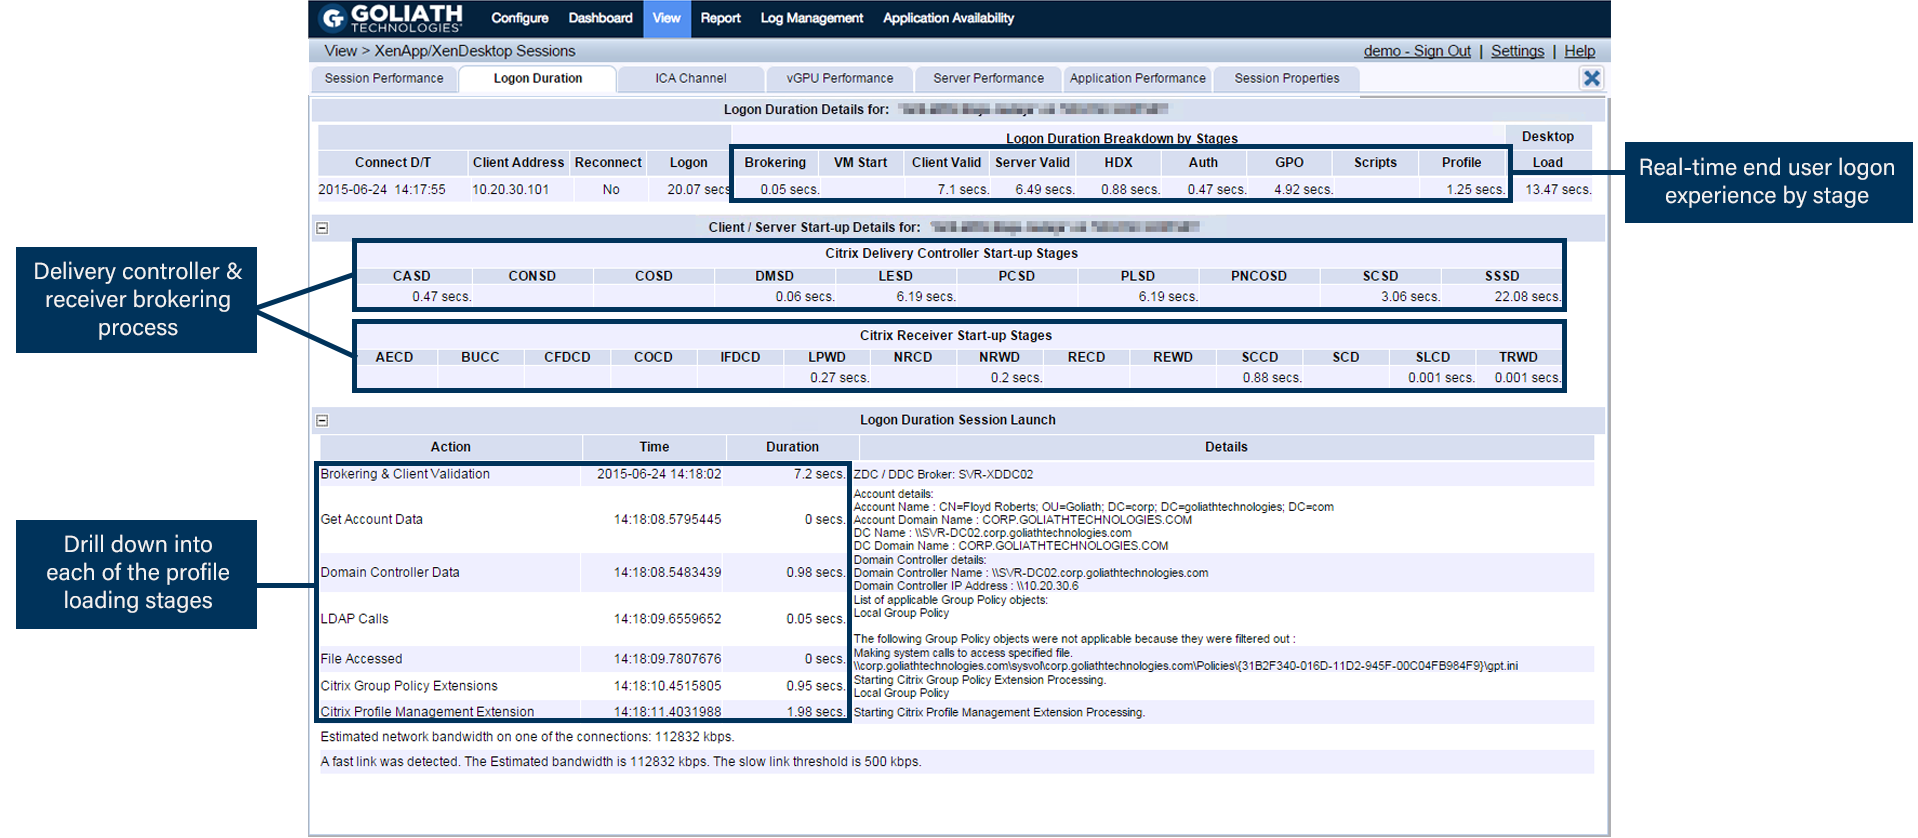
Unlike Citrix free utilities and other tools that only provide high level summary stage details for the logon process, the engineer was able to see the more than 33+ detailed stages provided by Goliath Performance Monitor – even though the Citrix session in question was more than a week old. This unique level of detail allowed him to quickly identify that 100.4 seconds, 86% of the total logon time was spent on the Client Validation stage (Figure 2).


Logon time spent on the Brokering Client Validation stage

Figure 2: The Logon Stage Details section of the Logon tab is unique to Goliath Performance Monitor.  It presents a granular breakdown of the login process by combining all of the above metrics with information included in the Goliath logs. This approach saves time and testing efforts by highlighting specific details during the login process that an administrator would normally have to dig through logs and other areas to obtain.

In two clicks, the Citrix engineer was able to both confirm the issue and pinpoint root cause by identifying the exact Delivery Controllers involved in the client validation process. The specific detail provided – including the specific Citrix XenApp delivery controller involved, focused troubleshooting on the true root cause of the problem. The team realized this problem could be solved – and prevented in the future — by allocating more memory to the specific Citrix XenApp Delivery Controllers during the busy logon hours in the morning.

Results

The New Posture of Proactive Alerting Before End Users Are Impacted

After making this change, the system showed a reduction of logon times by over 80% during early morning shift hours when most of the Citrix logon traffic occurred. In addition, proactive alerts were set to trigger based on both logon time length as well as memory utilization for the Delivery Controllers involved. This means that if these thresholds are breached in the future, IT will receive an alert and take corrective action before users are impacted.


*Epic, Hyperspace, Hyperdrive, and System Pulse are trademarks of Epic Systems Corporation

User Story: Epic Health System Troubleshoots ‘Citrix is Slow’

User Story: Epic Health System Troubleshoots ‘Citrix is Slow’

Epic Health System

Epic Health System Troubleshoots ‘Citrix is Slow’

Epic Health System Troubleshoots ‘Citrix-is Slow'

Infrastructure

Citrix XenApp, Epic Hyperspace

Challenge

Surgeon reports Citrix slowness, IT identifies and resolves the root cause immediately

The below screen shots were provided by a large non-profit healthcare organization that includes 4 acute care hospitals, over 20 clinics and 5,000 Citrix users. The Healthcare IT team received an urgent call from a surgeon who reported slowness in his EPIC EHR applications while delivering patient care. This document describes how the Citrix engineer used Goliath to quickly identify and troubleshoot the “Citrix is Slow” complaint and prove conclusively that the root cause wasn’t actually Citrix or the Epic Hyperspace Application at all.

Solution

Troubleshooting Session Slowness and Proving it isn’t Citrix or Epic Hyperspace

When the Citrix engineer received a call from his manager (because surgeons don’t open tickets) about Citrix performance issues, he needed to get to the root cause quickly. The surgeon’s complaint focused on session slowness. The engineer located, in real time, the specific session while the surgeon was still logged in to Citrix.

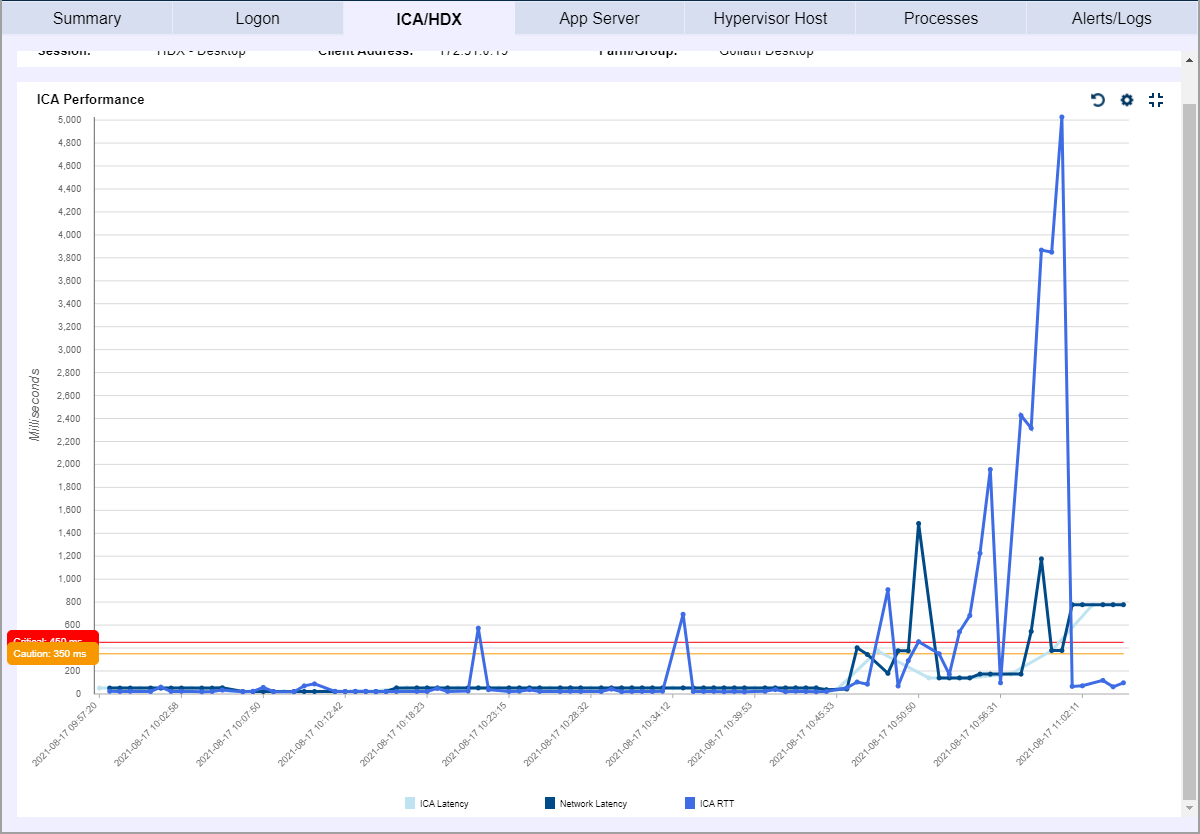
The Citrix engineer noticed that the connection from the remote hospital site to the hospital data center showed particularly high spikes in ICA RTT, ICA Latency, and Network Latency at the same time during the session (figure 2-1). Many tools can show ICA RTT, but these spikes could be caused by network issues, server/application resource issues, or even end user behavior, which can make this difficult to troubleshoot. This visibility limitation often results in unproductive finger pointing between teams.


Goliath’s Citrix session display

Figure 1: Goliath’s Citrix session display screen shows server name, user, logon duration, ICA latency and connection date among other details. Historical sessions are stored for weeks or months in full detail, without being averaged out or rolled-up

Time of network latency spike correlates directly to ICA & ICA RTT latency spikes

Figure 2: Time of network latency spike correlates directly to ICA & ICA RTT latency spikes.

However, Goliath includes a unique metric Network Latency, which measures the actual ICA network latency that is being experienced by the user. The network team might be right and there is plenty of bandwidth to the location overall, but the end user might still not have enough bandwidth for Citrix operations – especially when working with graphic-intensive applications. The spike in Network Latency here immediately indicates a network performance issue is to blame.

In two clicks, the Citrix engineer was able to both confirm the issue and pinpoint root cause – network performance issues. The engineer showed the objective evidence provided by the technology to his manager and the network team, proving that, while overall bandwidth is fine between the sites, the actual bandwidth available to the Citrix session is too low to support this physician’s use of graphic-intensive patient files, and deliver more bandwidth allocated in the future.

Results

Being Proactive – A New Health IT Paradigm

Without any quantitative measurement and tracking of end user experience metrics, IT professionals are forced to rely on anecdotal comments from the end users themselves. These reports are driven by frustration and are inconsistent, inaccurate and unreliable indicators of the size and scope of any actual issue. Now, IT professionals proactively track detailed end user experience metrics and automatically monitor those metrics for events, conditions and thresholds. This broad visibility correlates end user issues directly to the specific underlying elements of the complex virtual application and desktop delivery infrastructure that is the source of the problem. Then, IT administrators leverage the uniquely detailed metrics, including Network Latency, to pinpoint the specific root cause and resolve the issue.

*Epic, Hyperspace, Hyperdrive, and System Pulse are trademarks of Epic Systems Corporation

Epic Monitoring Program

*Epic, Hyperspace, Hyperdrive, and System Pulse are trademarks of Epic Systems Corporation

Top American Airline Ensures Access to Citrix Virtual Apps with Application Availability Monitoring

Top American Airline Ensures Access to Citrix Virtual Apps with Application Availability Monitoring

[fusion_builder_container hundred_percent=”no” hundred_percent_height=”no” hundred_percent_height_scroll=”no” hundred_percent_height_center_content=”yes” equal_height_columns=”no” menu_anchor=”” hide_on_mobile=”small-visibility,medium-visibility,large-visibility” status=”published” publish_date=”” class=”” id=”” background_color=”” background_image=”” background_position=”center center” background_repeat=”no-repeat” fade=”no” background_parallax=”none” enable_mobile=”no” parallax_speed=”0.3″ video_mp4=”” video_webm=”” video_ogv=”” video_url=”” video_aspect_ratio=”16:9″ video_loop=”yes” video_mute=”yes” video_preview_image=”” border_size=”” border_color=”” border_style=”solid” margin_top=”” margin_bottom=”” padding_top=”” padding_right=”” padding_bottom=”” padding_left=””][fusion_builder_row][fusion_builder_column type=”2_3″ layout=”1_1″ spacing=”” center_content=”no” link=”” target=”_self” min_height=”” hide_on_mobile=”small-visibility,medium-visibility,large-visibility” class=”” id=”” background_color=”” background_image=”” background_image_id=”” background_position=”left top” background_repeat=”no-repeat” hover_type=”none” border_size=”0″ border_color=”” border_style=”solid” border_position=”all” padding_top=”” padding_right=”” padding_bottom=”” padding_left=”” margin_top=”” margin_bottom=”” animation_type=”” animation_direction=”left” animation_speed=”0.3″ animation_offset=”” last=”no”][fusion_text columns=”” column_min_width=”” column_spacing=”” rule_style=”default” rule_size=”” rule_color=”” hide_on_mobile=”small-visibility,medium-visibility,large-visibility” class=”” id=””]

[fusion_imageframe image_id=”” max_width=”” style_type=”” blur=”” stylecolor=”” hover_type=”none” bordersize=”” bordercolor=”” borderradius=”” align=”right” lightbox=”no” gallery_id=”” lightbox_image=”” lightbox_image_id=”” alt=”” link=”/citrix-director-comparison/?utm_source=blog&utm_inline=banner&utm_campaign=website-CTAs&utm_content=gaat-airlines” linktarget=”_blank” hide_on_mobile=”small-visibility,medium-visibility,large-visibility” class=”” id=”” animation_type=”” animation_direction=”left” animation_speed=”0.3″ animation_offset=””]Director vs Goliath Troubleshooting[/fusion_imageframe]In this post, we share a story about how one of the top 10 airlines utilized a new technology to solve an old problem: Proactively confirm that the Sabre Reservation System, accessed using Citrix, would be available when reservation specialists attempted to logon and schedule flights for customers. They selected the Goliath Application Availability Testing Service for Citrix.

Recently, Goliath received an inquiry from the Citrix Engineering Team at one of the top ten airlines in the world. The Citrix team was in dire need of a tool which would allow them to continually check remote connectivity and availability of their Citrix VDI infrastructure and the Sabre Reservation System and alert them before they were called by the business units who would usually contact them when reservation specialists were having logon issues can catch them flat-footed. So, they wanted to be able to avoid these calls and if they did happen, have the ability to say, “we know of the issue and were on it”.

The catch: No technology could be deployed on-premises.

Employing a large remote workforce of registration agents in multiple time zones was effective from a business standpoint allowing for greater flexibility in hiring and market coverage. However, it did not come without technical challenges, as these remote team members were experiencing issues when the Citrix desktops were intermittently not launching successfully.

The catch: No technology could be deployed on-premises.

Employing a large remote workforce of registration agents in multiple time zones was effective from a business standpoint allowing for greater flexibility in hiring and market coverage. However, it did not come without technical challenges, as these remote team members were experiencing issues when the Citrix desktops were intermittently not launching successfully.

IT needs to ensure an ‘Always On’ Citrix environment for 1,000+ remote end users

At approximately 1,000+ users who take reservations and VIP support calls, the airline’s remote work force is rather large. This team depends on Citrix for delivery of key applications in order to perform their duties on a daily basis, and availability of those resources needs to be available 24/7/365.

We introduced the Citrix Engineers to our application availability testing service, which doesn’t require any software on premise. The onboarding process was easy. A configuration link was sent to them where they entered the following information:

  • URL to connect to the Citrix environment
  • The Citrix account credentials
  • Application or desktop name to be tested
  • Email address for receiving real-time alerts from the Application Availability Service

Upon saving the information, the service was fully configured and ready to start the testing process.

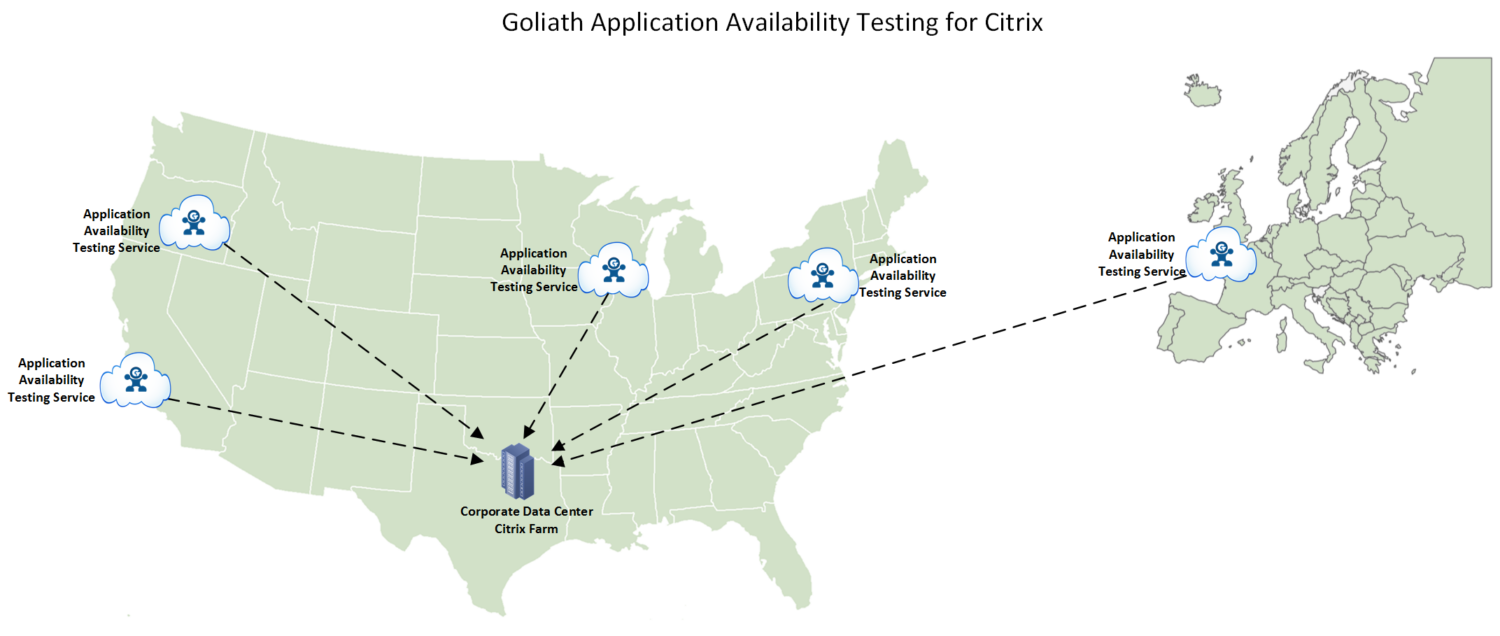
As you can see below, the service was configured to test application availability from four different egress points in the United States, and one in Europe. Each was selected based on time zone and the largest clusters of remote employees.

[/fusion_text][fusion_imageframe image_id=”41714|800″ max_width=”” style_type=”” blur=”” stylecolor=”” hover_type=”none” bordersize=”” bordercolor=”” borderradius=”” align=”center” lightbox=”yes” gallery_id=”” lightbox_image=”” lightbox_image_id=”” alt=”” link=”” linktarget=”_self” hide_on_mobile=”small-visibility,medium-visibility,large-visibility” class=”” id=”” animation_type=”” animation_direction=”left” animation_speed=”0.3″ animation_offset=””]https://goliathtechnologies.com/wp-content/uploads/2019/02/GAAT-Airlines-800×339.png[/fusion_imageframe][fusion_separator style_type=”none” hide_on_mobile=”small-visibility,medium-visibility,large-visibility” class=”” id=”” sep_color=”” top_margin=”25″ bottom_margin=”” border_size=”” icon=”” icon_circle=”” icon_circle_color=”” width=”” alignment=”center” /][fusion_text columns=”” column_min_width=”” column_spacing=”” rule_style=”default” rule_size=”” rule_color=”” hide_on_mobile=”small-visibility,medium-visibility,large-visibility” class=”” id=””]

Test & Confirm Applications Will Launch in Real Time

Almost immediately, the Citrix team started seeing successful application and desktop launches in real time. They also started seeing that failures were occurring. In fact, after initiating the first test, the Citrix team began receiving email notifications of logon failures.

Here is an example of the real-time screen they were seeing:

[/fusion_text][fusion_imageframe image_id=”41715|full” max_width=”” style_type=”” blur=”” stylecolor=”” hover_type=”none” bordersize=”” bordercolor=”” borderradius=”” align=”center” lightbox=”no” gallery_id=”” lightbox_image=”” lightbox_image_id=”” alt=”” link=”” linktarget=”_self” hide_on_mobile=”small-visibility,medium-visibility,large-visibility” class=”” id=”” animation_type=”” animation_direction=”left” animation_speed=”0.3″ animation_offset=””]https://goliathtechnologies.com/wp-content/uploads/2019/02/Confirm-Logon-Slowness-e1550089903569.png[/fusion_imageframe][fusion_separator style_type=”none” hide_on_mobile=”small-visibility,medium-visibility,large-visibility” class=”” id=”” sep_color=”” top_margin=”25″ bottom_margin=”” border_size=”” icon=”” icon_circle=”” icon_circle_color=”” width=”” alignment=”center” /][fusion_text columns=”” column_min_width=”” column_spacing=”” rule_style=”default” rule_size=”” rule_color=”” hide_on_mobile=”small-visibility,medium-visibility,large-visibility” class=”” id=””]

Upon receiving these alerts they were able to do what?

This data and information is also available in a historical report IT staff can analyze to make decisions and provide management with historical information.

The two images below are an example of logon failures displayed in this report. In the example here, the airline’s Citrix engineer used the data to confirm that a StoreFront server went down.

The report drilled down into the actual steps taken to get to the failure point. In a production environment, the appropriate support teams would have been alerted immediately when these failures occurred, giving them time to investigate the issue before receiving calls from their end users.

Finally, and as importantly, the reports gave them objective evidence that would validate whether or not they were meeting their Citrix Availability SLAs.

[/fusion_text][fusion_imageframe image_id=”41716|800″ max_width=”” style_type=”” blur=”” stylecolor=”” hover_type=”none” bordersize=”” bordercolor=”” borderradius=”” align=”center” lightbox=”yes” gallery_id=”” lightbox_image=”” lightbox_image_id=”” alt=”” link=”” linktarget=”_self” hide_on_mobile=”small-visibility,medium-visibility,large-visibility” class=”” id=”” animation_type=”” animation_direction=”left” animation_speed=”0.3″ animation_offset=””]https://goliathtechnologies.com/wp-content/uploads/2019/02/Historical-Simulation-Drilldown-800×422.png[/fusion_imageframe][fusion_separator style_type=”none” hide_on_mobile=”small-visibility,medium-visibility,large-visibility” class=”” id=”” sep_color=”” top_margin=”25″ bottom_margin=”” border_size=”” icon=”” icon_circle=”” icon_circle_color=”” width=”” alignment=”center” /][fusion_imageframe image_id=”41717|800″ max_width=”” style_type=”” blur=”” stylecolor=”” hover_type=”none” bordersize=”” bordercolor=”” borderradius=”” align=”center” lightbox=”yes” gallery_id=”” lightbox_image=”” lightbox_image_id=”” alt=”” link=”” linktarget=”_self” hide_on_mobile=”small-visibility,medium-visibility,large-visibility” class=”” id=”” animation_type=”” animation_direction=”left” animation_speed=”0.3″ animation_offset=””]https://goliathtechnologies.com/wp-content/uploads/2019/02/Track-Simulation-Results-800×359.png[/fusion_imageframe][fusion_separator style_type=”none” hide_on_mobile=”small-visibility,medium-visibility,large-visibility” class=”” id=”” sep_color=”” top_margin=”25″ bottom_margin=”” border_size=”” icon=”” icon_circle=”” icon_circle_color=”” width=”” alignment=”center” /][fusion_text columns=”” column_min_width=”” column_spacing=”” rule_style=”default” rule_size=”” rule_color=”” hide_on_mobile=”small-visibility,medium-visibility,large-visibility” class=”” id=””]

The Logon Success/Failure Analysis Report may be configured to run on a scheduled basis (daily, weekly, etc.) or as an on-demand report– just in time for those impromptu meetings management sometimes calls.

This Logon Report provides:

  • A direct output of any scheduled logon successes or failures for the time period specified when the report is generated
  • Full visibility to drill down into each of the logon availability tests to identify where a failure may have occurred

Logon Success/Failure Analysis Report will indicate if the:

  • Connection flowed through the NetScaler properly
  • StoreFront server isn’t responsive
  • Specific application or desktop was unable to launch

When this customer interaction ended, everyone was very satisfied. Together, and in less than two hours, we had solved a difficult challenge. The Goliath Application Availability Testing Service for Citrix provided them with peace of mind that they would “know first” if a reservation specialist was going to have issues.

[/fusion_text][/fusion_builder_column][fusion_builder_column type=”1_3″ layout=”1_3″ spacing=”” center_content=”no” link=”” target=”_self” min_height=”” hide_on_mobile=”small-visibility,medium-visibility,large-visibility” class=”” id=”” background_color=”” background_image=”” background_image_id=”” background_position=”left top” background_repeat=”no-repeat” hover_type=”none” border_size=”0″ border_color=”” border_style=”solid” border_position=”all” border_radius=”” box_shadow=”no” dimension_box_shadow=”” box_shadow_blur=”0″ box_shadow_spread=”0″ box_shadow_color=”” box_shadow_style=”” padding_top=”” padding_right=”” padding_bottom=”” padding_left=”” margin_top=”” margin_bottom=”” animation_type=”” animation_direction=”left” animation_speed=”0.3″ animation_offset=”” last=”no”][fusion_content_boxes layout=”icon-with-title” columns=”1″ title_size=”” heading_size=”2″ title_color=”” body_color=”” backgroundcolor=”” icon=”” iconflip=”” iconrotate=”” iconspin=”no” iconcolor=”” icon_circle=”” icon_circle_radius=”” circlecolor=”” circlebordersize=”” circlebordercolor=”” outercirclebordersize=”” outercirclebordercolor=”” icon_size=”” icon_hover_type=”” hover_accent_color=”” image=”” image_id=”” image_max_width=”” link_type=”” button_span=”” link_area=”” link_target=”” icon_align=”left” animation_type=”” animation_delay=”” animation_offset=”” animation_direction=”left” animation_speed=”0.3″ margin_top=”” margin_bottom=”” hide_on_mobile=”small-visibility,medium-visibility,large-visibility” class=”” id=””][fusion_content_box title=”” backgroundcolor=”” icon=”” iconflip=”” iconrotate=”” iconspin=”no” iconcolor=”” circlecolor=”” circlebordersize=”” circlebordercolor=”” outercirclebordersize=”” outercirclebordercolor=”” image=”” image_id=”” image_max_width=”” link=”” linktext=”Read More” link_target=”” animation_type=”” animation_direction=”left” animation_speed=”0.3″ animation_offset=””]

[gravityform id=”106″ title=”false”]

[/fusion_content_box][/fusion_content_boxes][/fusion_builder_column][/fusion_builder_row][/fusion_builder_container][fusion_builder_container hundred_percent=”no” hundred_percent_height=”no” hundred_percent_height_scroll=”no” hundred_percent_height_center_content=”yes” equal_height_columns=”no” menu_anchor=”” hide_on_mobile=”small-visibility,medium-visibility,large-visibility” status=”published” publish_date=”” class=”” id=”” background_color=”” background_image=”” background_position=”center center” background_repeat=”no-repeat” fade=”no” background_parallax=”none” enable_mobile=”no” parallax_speed=”0.3″ video_mp4=”” video_webm=”” video_ogv=”” video_url=”” video_aspect_ratio=”16:9″ video_loop=”yes” video_mute=”yes” video_preview_image=”” border_size=”” border_color=”” border_style=”solid” margin_top=”” margin_bottom=”” padding_top=”” padding_right=”” padding_bottom=”” padding_left=””][fusion_builder_row][fusion_builder_column type=”1_1″ layout=”1_1″ spacing=”” center_content=”no” link=”” target=”_self” min_height=”” hide_on_mobile=”small-visibility,medium-visibility,large-visibility” class=”” id=”” background_color=”” background_image=”” background_image_id=”” background_position=”left top” background_repeat=”no-repeat” hover_type=”none” border_size=”0″ border_color=”” border_style=”solid” border_position=”all” padding_top=”” padding_right=”” padding_bottom=”” padding_left=”” margin_top=”” margin_bottom=”” animation_type=”” animation_direction=”left” animation_speed=”0.3″ animation_offset=”” last=”no”][fusion_imageframe image_id=”41465|1200″ max_width=”” style_type=”” blur=”” stylecolor=”” hover_type=”none” bordersize=”” bordercolor=”” borderradius=”” align=”center” lightbox=”no” gallery_id=”” lightbox_image=”” lightbox_image_id=”” alt=”” link=”/free-trial/goliath-application-availability-monitor-30-day-free-trial/?utm_source=blog&utm_medium=banner&utm_campaign=website-CTAs&utm_content=gaat-airlines” linktarget=”_blank” hide_on_mobile=”small-visibility,medium-visibility,large-visibility” class=”” id=”” animation_type=”” animation_direction=”left” animation_speed=”0.3″ animation_offset=””]https://goliathtechnologies.com/wp-content/uploads/2019/02/Free-Trial-CTA-v2.1-GAAM-1500×486-1200×389.png[/fusion_imageframe][/fusion_builder_column][/fusion_builder_row][/fusion_builder_container]

Law Firm With 5,000 Users Troubleshoots Citrix Latency Issues

Law Firm With 5,000 Users Troubleshoots Citrix Latency Issues

How We Did It User Story: Law Firm With 5,000 Users Troubleshoots Citrix Latency Issues

In this post, the Goliath Support Team shares a story and troubleshooting workflow pertaining to a law firm with over 5,000 users. The law firm leveraged Goliath to troubleshoot Citrix and solve slow Citrix XenApp session issues by using the End-User Experience and HDX Latency Reports in Goliath Citrix Monitoring.

Problem: IT Operations lacked visibility into the end-user experience of 5,000 people in 30 offices  

Last week, I was working with a customer who is using Goliath for Citrix Monitoring and troubleshooting of their XenApp 7.6 environment. This law firm uses our technology to ensure their end users around the world have seamless access to their Citrix-delivered applications.

With 30 offices located worldwide and a Citrix XenApp environment of over 5,000 users, it was challenging for their IT Operations team to understand how many end users were experiencing poor performance, in what frequency and, most importantly, why.

By configuring our Citrix Monitoring and troubleshooting technology, the IT team was able to track and report on people who had poor Citrix end-user experience by using two reports that come out-of-the-box with Goliath’s Citrix Monitoring:

These reports are part of Goliath’s Citrix troubleshooting functionality and were scheduled to run on a daily and weekly basis and sent via email to the law firm’s Citrix Admins.

Step 1: Configure the End-User Experience Report & Schedule to Run Automatically for Citrix Troubleshooting

The first step in the process to understand the end-user experience was to bring in their Citrix XenApp 7.6 environment through our ‘First Time Run Wizard’ using our APIs for Citrix. Once the Citrix infrastructure was listed in the inventory, we deployed our Intelligent Agent.

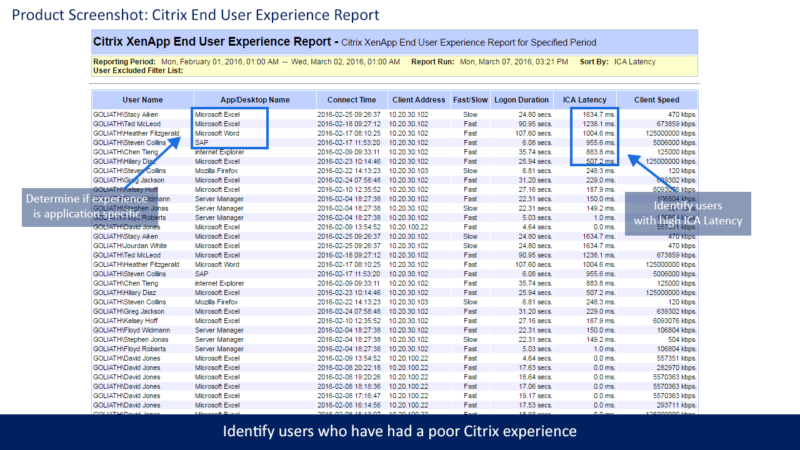
The first report they configured was the End-User Experience Report, which is essential for Citrix troubleshooting. This report was scheduled to run every morning at 9:30 am so it landed in the Citrix Admins’ inbox first thing in the morning.

With the End-User Experience Report, the Citrix Admins could quickly determine if:

  1. An end user was experiencing Citrix session slowness (as indicated by HDX latency)
  2. The Citrix slowness was caused by a slow connection speed
  3. Citrix itself determined the connection to be slow and adjusted experience accordingly

The Citrix End-User Experience Report also provided information around the connection times and what application was used. So, instead of being caught off guard by calls from frustrated end users complaining about slow Citrix sessions, the administrator can be more proactive, anticipate the issues and, ultimately, prevent them altogether.

XAXD End User Experience Report

Step 2: Configure the HDX Latency Report & Troubleshoot Citrix End-User Experience Issues

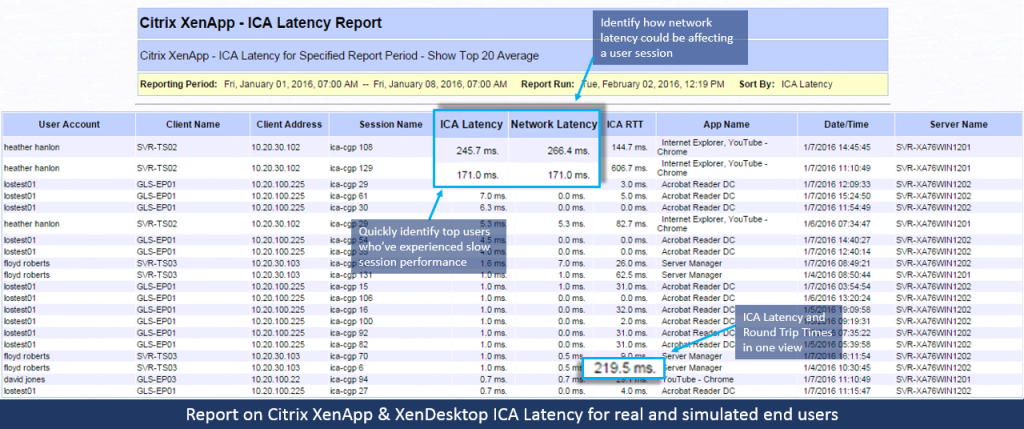
The other Goliath report this law firm used was the Citrix HDX Latency Report. Citrix ICA latency is a key metric because when we look at performance and end-user experience problems, if there is a problem stemming from a server’s ability to process the user’s request or their connection, it will manifest in our Citrix troubleshooting functionality for Citrix HDX latency. 

This is the starting point for determining if the user’s poor experience issue is caused by something related to what they are doing or how they are connecting to the environment. In addition to scheduling the Citrix End-User Experience Report, the Citrix HDX Latency Report is also scheduled to run on a weekly basis and sent to the Citrix Admins.

Step 3: Set Threshold-Based Alerting for All End Users with Latency Higher than 300 Milliseconds

To enable proactive Citrix troubleshooting, the law firm configured the Citrix HDX Latency Report to show all users with a latency higher than 300 milliseconds, which is the threshold at which users begin noticing performance problems.

In multiple cases, the law firm identified network latency as being the cause of HDX latency for users from certain offices and used this report to forward the evidence (the report) onto the network team and management.

Citrix XenApp - ICA Latency Report

By using these reports in Goliath’s Citrix troubleshooting functionality, the Citrix Admins were able to quickly end the finger pointing between teams and provide objective evidence to management and the end users when performance complaints are reported.  The Citrix End-User Experience and HDX Latency Reports continue to be leveraged to maintain visibility to the Citrix end-user’s experience without depending on a phone call and to provide objective evidence when problems occur.

Tech Guide Upload Promotion

For more information on how Goliath Performance Monitor can help you and your team be proactive and anticipate, troubleshoot and prevent end user experience issues:


Send us an email: techinfo@goliathtechnologies.com

Give us a call: 855-465-4284

About the Author: 

Evangelical Hospital Improves Clinician Experience Issues

Evangelical Hospital Improves Clinician Experience Issues

Evangelical Community Hospital

Improves Clinician End User Experience Issues

Challenge

Evangelical Community Hospital is a health system with a 132-bed facility, and it is very important to make certain all 200 physicians and 900 healthcare workers have unimpeded access to Allscripts and IE based applications. At a hospital facility patient care is the primary concern, and if those who take care of patients can’t access applications like Allscripts, it can directly impact the patient.

When Ashley Parker took over responsibility for managing the Citrix XenApp 6.5 Delivery Infrastructure, it was difficult and time-consuming to troubleshoot issues when end users would complain.   It became an important initiative to find technical solutions that would help them quickly isolate root cause and troubleshoot IT related issues that could negatively impact the experience of the end users.  To accomplish this task, Ashley would need greater visibility into her VMware vSphere infrastructure, Citrix XenApp 6.5 and the supporting infrastructure that delivered Allscripts and business applications to end users at Evangelical Hospital.

Solution

The decision was made to purchase Goliath Technologies and Ashley was put in charge of the product and the initiative. Immediately she engaged with Goliath Care Services and received training on the Goliath Performance Monitor Product. She was able to see that the software had functionality which offered visibility she hadn’t had before around both Citrix and the Supporting Infrastructure. The product, being purpose built for virtual server and virtual desktop for both Citrix and VMware environments, offers out-of-the-box: specific alerts, metrics, drill down capability, real time dashboards, and trending reports.

So the situation changed quickly. In the past if a physician had an issue, Ashley’s team would have to remote in and track down the specific server that might have been impacting the Citrix session. Now, they have a real-time view with the ability to drill down into specific user session detail to understand if the issue is the server, device (supported or not supported,) or network.


In addition, if a user is having an issue with slow logons Ashley can drill down in real-time and see the session logon duration to see where the bottleneck is occurring, including the ICA channel. Finally, she receives historical trending reports on many metrics that can indicate a problem on the horizon. She was able to schedule reports to be sent to her that include ICA latency, Session Logon Duration, Memory Utilization and End User Experience.


GPM Citrix Logon Duration Drill Down


“We have dramatically reduced time to resolution when issues occur with our Citrix XenApp 6.5 delivery infrastructure by implementing Goliath’s solution that is purpose built for Citrix,” explained Ashley.

Results

The purpose built nature of Goliath Performance Monitor allowed Evangelical Hospital’s IT organization to reduce time to resolution when troubleshooting end user experience issues.

Further Reading

ABOUT EVANGELICAL COMMUNITY HOSPITAL

Evangelical Community Hospital is a prominent healthcare institution known for its dedication to providing high-quality medical services to the local community. The hospital offers a wide range of medical specialties, including emergency services, surgical care, obstetrics, and advanced diagnostic facilities. With a team of skilled healthcare professionals and a patient-centered approach, Evangelical Community Hospital continues to be a trusted healthcare provider in the region.

Headquarters location: Lewisburg, Pennsylvania
Founded: 1926
Employees: >1900
Industry: Healthcare

Uses Goliath’s Application Availability Testing as a Service with AWS to Prevent Citrix Failed Logons

Uses Goliath’s Application Availability Testing as a Service with AWS to Prevent Citrix Failed Logons

How We Did IT

Top 5 Airline Uses Goliath’s Application Availability Testing as a Service with AWS to Prevent Citrix Failed Logons


citrix failed logon

Infrastructure

Citrix XenDesktop & Citrix XenApp; AWS; Sabre Technology

Challenge

Random outages of reservation application running on Citrix XenDesktop and Citrix XenApp was negatively impacting customer service.

The Goliath team received an inquiry from the Citrix engineering group at one of the top airlines in the world. The Citrix engineers were faced with four unique challenges:

  1. They needed a way to continuously test remote connectivity and availability of their Citrix VDI infrastructure and reservation system.
  2. They required the ability to be proactively alerted to issues before reservation specialists experienced an outage, negatively impacting customer service.
  3. Software could not be deployed on-premise within their IT infrastructure, so a cloud-based solution was required.
  4. They needed objective evidence in the form of reports, analytics, and even screenshots to prove success, failure, and, if a failure, root cause.

For context, this airline has approximately 2,000+ remote reservation specialists who take reservations and VIP support calls. They work from home and in small offices and, therefore, experience variable connection quality. This team depends on Citrix for delivery of key applications in order to perform their daily duties, and availability of those resources needs to be 24/7/365.

Solution

Goliath’s Application Testing as a Service with AWS Monitoring

Understanding the requirements, the Citrix engineers were introduced to Goliath’s Application Availability Testing as a Service using AWS. It enabled them to continually test availability of not only their reservation application but the entire Citrix XenApp and XenDesktop environment for all remote workers. The Goliath AWS Monitoring Solution is hosted in AWS and, therefore, doesn’t require any software on-premises. The onboarding process was easy. A configuration link was sent to them where they entered the following information:

  • URL to connect to the Citrix environment
  • The Citrix account credentials
  • Application or desktop name to be tested
  • Email address for receiving real-time alerts from the Application Availability Service

Upon saving the information, the Goliath’s Application Availability Testing as a Service was fully configured and ready to begin the process of confirming Citrix application availability in production.

As depicted below, Goliath’s Application Availability Testing as Service for Citrix XenApp and XenDesktop is configured to confirm application availability from two different points in the United States and one in Europe deployed on AWS instances in each region. Each was selected based on time zone and the largest clusters of remote employees. From each AWS instance, the Goliath Application Launcher initiates a real Citrix logon from the endpoint in AWS to the data center hosting Citrix. It logs on like a real user with all the same permission settings as in Active Directory. From the gateway through to the application and/or desktop launch, the application availability service tests each component of the delivery infrastructure, in concert, identical to an actual end user.


Deployment across remote locations

Image 1: Above is an illustration of their deployment across remote locations. To test for all remote users, Goliath’s App Launcher is launched from AWS instances located on the east and west coast of the U.S. and another in Europe. All launchers launch then to the centralized Citrix delivery infrastructure located on-premise in their data center.

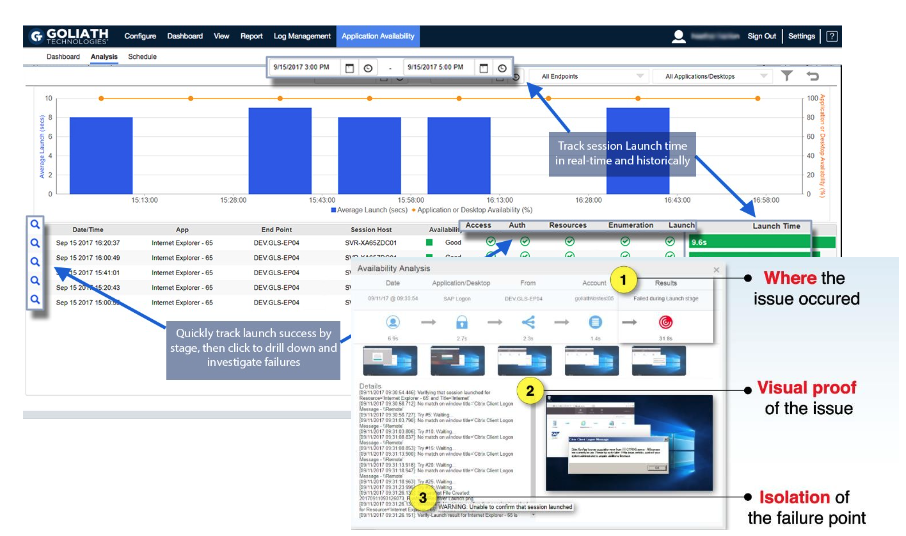
Immediately after deploying the testing service, the Citrix team started seeing failed or slow Citrix logons in real time. For the first time, they had visibility into where Citrix availability issues were occurring around the globe with screenshot evidence (Image 2).

As issues were uncovered, alerts were sent from the Goliath’s Console for AWS Monitoring to the appropriate Citrix monitoring personnel. In addition to alerting, Citrix administrators were able to view the health of their environment from a live dashboard (Image 2) and address any issues before calls came into the help desk.

Application Availability Monitor

Image 2: In this case, failure occurred at the launch stage (1). The screenshot (2) proves that the application failed to launch and shows the root cause of the Citrix workflow and application launch failure resulted due to a licensing problem. Then by navigating to the “Details” or “Analytics” section (3), we can see that the launch failed at the point of verifying that Internet Explorer launched.

Beyond a real-time view into the health of the production availability of the reservation application, there was also a need for the Citrix team to be able to run AWS monitoring reports on Citrix’ end user logon success or failure rates. Management required that the application availability meet SLA requirements. Because Goliath confirmed Citrix and the reservation application availability in production, the reports could also serve as objective evidence of validation that uptime requirements were being met.

As depicted in Goliath’s Application Launcher Success and Failure Analysis Report below (Image 3), every detail is captured as the production logon sequence is completed and then is presented in the output of the report, providing the empirical evidence required to validate environment uptime and availability. The detail provided in the reports also helped to quickly identify patterns and trend over time where Citrix availability issues were occurring for remote users, thereby allowing technical teams to better collaborate across the organization and get issues resolved.

Citrix logon simulator revised

Image 3: Goliath offers historical data to identify trends around application availability and overall logon performance. This data can be viewed leveraging one of Goliath’s out-of-the box reports that can be shared via email, export (pdf, csv), or directly in the Goliath Console. 

Results

Goliath’s Application Availability Testing as a Service with AWS Monitoring satisfied the needs and requirements of the major airline. The team was empowered with a service that could logon remotely from AWS locations and confirm in production that applications were available or alert to failures or slowness. It provided them with a live real-time dashboard and threshold-based alerts so they could be aware of issues before their users or business units were impacted. The AWS Monitoring service also enabled them to provide historical reports to management to substantiate that SLA’s were being met and to pinpoint and resolve issues discovered over time. The entire software is provided as a monthly service by Goliath leveraging AWS to host the software.

Now when an end user calls regarding an issue, the Citrix team is truly able to say they are addressing issues before the end users are aware.

For more information on how Goliath’s Application Availability as a Service can help you and your team be proactive and anticipate, troubleshoot and document end user experience issues:

Send us an email: techinfo@goliathtechnologies.com

Give us a call: 855-465-4284

ABOUT ORGANIZATION

This major U.S. airline boasts a vast fleet serving numerous destinations both domestically and internationally. Known for its distinctive tail design and extensive network, it plays a significant role in the global aviation industry.

Headquarters location: South Central, United States
Founded: mid-1920s
Employees: >2000
Industry: Aviation