St. Louis Metropolitan Police Department Selects Citrix Enterprise Instead of Citrix Platinum

St. Louis Metropolitan Police Department Selects Citrix Enterprise Instead of Citrix Platinum

St. Louis Metropolitan Police Department Selects Citrix Enterprise Instead of Citrix Platinum

“We selected Citrix Enterprise & Goliath instead of Citrix Platinum because Goliath gives us far superior Citrix monitoring and management capabilities than the utilities included with Platinum. Goliath and Citrix Enterprise together were much more affordable than Citrix Platinum, and after we evaluated the Citrix performance monitoring of Goliath, the decision was a no-brainer.”
– Tom Westbrook, Manager IT Operations & Networking, SLMPD


The Business Challenge: 

The Saint Louis Police Department was deciding whether to purchase Citrix Platinum or Enterprise. Citrix XenApp and XenDesktop are used to support remote police officers by delivering applications and desktops. Due to the nature of the environment, having an effective and comprehensive Citrix XenApp monitoring solution for their delivery infrastructure is critical. The need for Citrix XenApp monitoring was the major consideration when trying to decide between purchasing XenDesktop Enterprise or XenDesktop Platinum. They were told that the Platinum edition included additional capabilities for Citrix XenApp monitoring with Director and Insight, “all the enterprise monitoring you will need is free if you purchase Citrix Platinum”.

 
View the Director Comparison Video
 

Citrix Platinum Tools are Not Useful for Citrix Monitoring & Troubleshooting  

The biggest challenge in the decision-making process was the cost vs. the benefit of purchasing Citrix XenApp/XenDesktop Platinum. The features and functionality of the Enterprise edition satisfied all of the technical requirements necessary to delivering applications and desktops to end users, except for providing the Citrix monitoring capabilities needed to ensure a high-quality user experience. While the Platinum edition claims to provide comprehensive Citrix monitoring capabilities with the free utilities included in the Citrix Platinum License, the evaluation proved that the functionality of Director and Insight did not meet the minimum requirements for Citrix monitoring. The Citrix monitoring tools may indicate that something is wrong, but the depth of visibility did not exist to tell them “what was wrong” or root cause. So, why purchase Platinum and then have to also buy additional Citrix monitoring for the supporting infrastructure and end user experience? What was truly needed was a monitoring solution that worked with Citrix Enterprise Edition. See the selection criteria they developed here:

Feature Goliath Citrix Desktop Director with Insight for Platinum Edition
Enterprise Architecture Yes No
VMware Integration Yes No
vCenter, XenServer, and Hyper-V Integration Yes Limited
One Product to Monitor VDI, Hypervisors, and Physical Infrastructure Yes No
3rd Party Tools Integration Yes No
Alerting Controls and Scheduling Yes No
Automated Remediation Yes No
Alert Resolution Feature Yes No
Physical Server Monitoring Yes No
ICA/HDX Monitoring Yes Limited
Citrix XenApp and XenDesktop Performance Dashboard Yes Limited
Citrix XenApp and XenDesktop Failure Monitoring Yes Limited
Application Failure Monitoring Yes No
Citrix App Availability Testing Yes No
175+ Pre-Configured Failure Point Monitors Yes No
Logon failure and duration threshold-based alerting Yes Limited
Session analysis per user session for VDI, Hosted Shared Desktop and Hosted Shared Application Yes Limited
Logon Duration Analysis Yes Limited
ICA Channel Drilldown Yes Yes
ICA Latency and RTT Yes Yes
Detailed Historical Reporting Yes No
Client Connection Speed Yes No
Client Network Latency Through ICA Yes No
Application Availability testing all components of logon in concert Yes No
Print Monitoring Yes No
Profile Monitoring Yes No
Provisioning Services Monitoring Yes No
Microsoft SQL Monitoring Yes No
Active Directory Yes No
66 Out-of-The-Box Reports Yes No

The Solution: “Goliath and Citrix Enterprise Were a No Brainer”

Part of the decision-making process for the Saint Louis Police Department was to evaluate alternative solutions that would give them better functionality as Director and Insight for Platinum Edition. They wanted something that would help them anticipate, troubleshoot, resolve and prevent Citrix end user experience issues. Goliath offered an end-to-end solution, providing deep visibility into Citrix sessions, end user experience and underlying infrastructure–often the root cause of Citrix performance issues.

The powerful out of the box capabilities above, combined with the competitive price point of Goliath Performance Monitor and Goliath Application Availability Monitor, gave the Citrix support staff the ability to be truly proactive without purchasing Citrix Platinum.  This allowed them to anticipate, troubleshoot, resolve, and prevent issues in a way that Director with Platinum edition simply could not, while also saving money.

The Summary

After the evaluation concluded, it was readily apparent that Goliath Technologies and Citrix Enterprise Edition offered a complete and comprehensive solution that was more capable than the tools included with XenApp/XenDesktop Platinum Edition. And, given the upcharge for going to Citrix Platinum, a truly proactive Citrix Desktop environment could be achieved at a far lower price point.
Click the image below to learn more about how we compare to Citrix Director — then sign up for a Free Trial!

Citrix Troubleshooting Helps MEDITECH Hospital Solve User Issues

Citrix Troubleshooting Helps MEDITECH Hospital Solve User Issues

The Goliath Support Team worked with a customer who uses Goliath’s Citrix Monitoring and Troubleshooting functionality for their MEDITECH applications. This customer was a Health Care System that includes 2 hospitals and a number of other healthcare related facilities.

The Health Care System had over 150 VMware VMs supporting their MEDITECH EMR/EHR applications via Citrix XenApp for over 1,000 users. Their primary concern was preventing end user complaints resulting from application and server issues. By configuring our product for VMware vSphere monitoring, Citrix monitoring, and MEDITECH monitoring we were able to let them know of impending issues so they had time to react and solve problems before end users were impacted. This blog will speak to how we did that.

Monitoring Rules & Real-Time Alerts

So first we set up our Citrix and MEDITECH Monitoring Rules and real-time alerts. Keep in mind these are all out-of-the-box, meaning that the expertise of knowing what conditions to look for or monitor are already pre-loaded into the base product, as are the alerts. This is essential for Citrix Troubleshooting because the rules tell the product what conditions to look for on the hypervisor, virtual machines, OS, applications, and hardware.

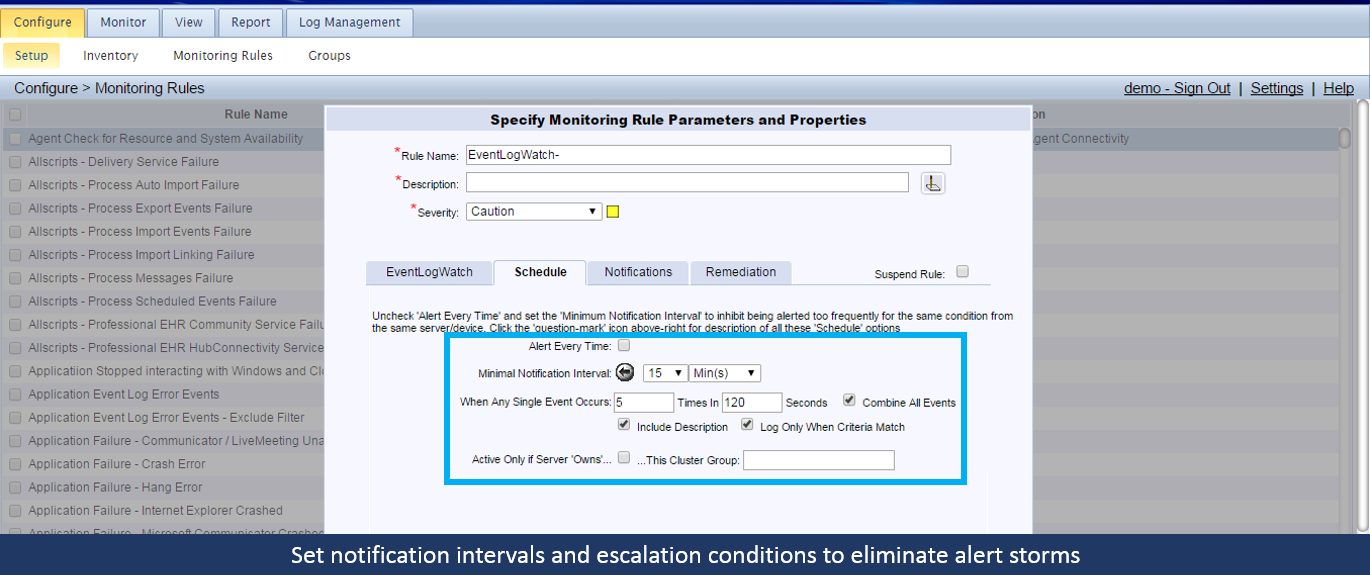
For example, we deployed MEDITECH, VMware monitoring, Citrix monitoring, and many other rules. The rules also contain the alerts that will tell you in real time if a trigger event has taken place, and can also perform proactive remediation actions as well.

In the case of the Health Care System, once the monitoring rules and real-time alerts were configured they were instantly alerting of faults taking place in their environment. After running the Citrix monitoring, Citrix troubleshooting, and MEDITECH monitoring for a month or so, they started to experience a high CPU utilization alerts on a handful of their MEDITECH XenApp Servers. In receiving the alerts they were able to drill into the issue to determine the root cause of these alerts.

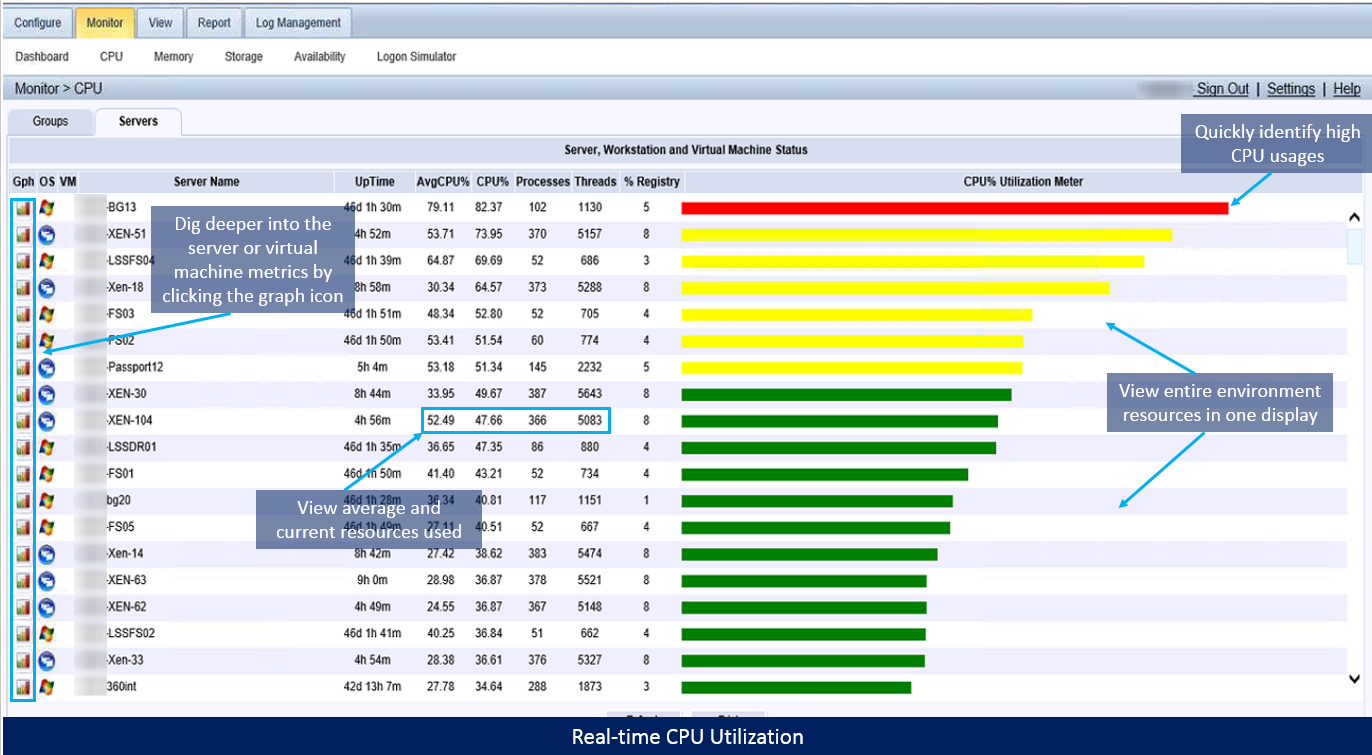
In the screenshot below, you will see that they would first navigate to the CPU page to get a glance at all of the average and percent CPU for the entire Citrix and MEDITECH environment.

Citrix Troubleshooting Out-of-the-Box CPU monitoring

cpu-monitoring-goliath-technologies

From this page, the customer was then able to compare the alerted machine CPU against others in the environment. They were also able to drill into the VMware virtual machine metrics by clicking the graph icon to view additional key CPU metrics via the hypervisor trending over time.

In the screenshot below the customer was able to use this display to see that the %CPU had been steadily increasing over an hour time span before it maxed at 100% for one their XenApp servers which were hosting MEDITECH.

vm-metrics-identify-usage-trends

Identify Usage Trends

Finally, the customer was able to note all of these key metrics before moving to the Citrix XenApp/XenDesktop Session Display to see how user activity could be affecting the XenApp server. Once on that display, they were able to search for all of the sessions on that particular machine for a given time frame to troubleshoot Citrix. Once spotting a couple users with high CPU they were able to drill into those sessions.

To see what the user was doing, they opened the ‘Application Performance’ tab. The Health Care System was able to then determine from the display that the said user was running 6 instances of csmagic.exe that were collectively monopolizing the machine resources. Once the root cause was identified the help desk was able to kill those processes and in turn stabilize the machine.

View Processes and Identify Users Burning Resources

These are only a few key screens and metrics, but they were hugely impactful to this customer. Since implementing Goliath Performance Monitor for Citrix Monitoring and Troubleshooting few months ago they have been able to catch multiple CPU and memory leaks in their environment across multiple locations. They have also implemented additional alerting in regards to process utilization to get ahead of situations like this from happening again.

If you have any questions or would like to speak to a technical specialist, feel free to reach out by Phone at (855)-465-4284 or Email at techinfo@goliathtechnologies.com.


Want To Learn More?

Browse our upcoming webinars to see our software in action!

Browse EHR Monitoring & Troubleshooting Webinars
MTM Meets Customer SLAs with Goliath Technologies

MTM Meets Customer SLAs with Goliath Technologies

[fusion_builder_container hundred_percent=”no” hundred_percent_height=”no” hundred_percent_height_scroll=”no” hundred_percent_height_center_content=”yes” equal_height_columns=”no” menu_anchor=”” hide_on_mobile=”small-visibility,medium-visibility,large-visibility” class=”” id=”” background_color=”” background_image=”” background_position=”center center” background_repeat=”no-repeat” fade=”no” background_parallax=”none” enable_mobile=”no” parallax_speed=”0.3″ video_mp4=”” video_webm=”” video_ogv=”” video_url=”” video_aspect_ratio=”16:9″ video_loop=”yes” video_mute=”yes” video_preview_image=”” border_size=”” border_color=”” border_style=”solid” margin_top=”” margin_bottom=”” padding_top=”” padding_right=”” padding_bottom=”” padding_left=””][fusion_builder_row][fusion_builder_column type=”1_1″ layout=”1_1″ spacing=”” center_content=”no” link=”” target=”_self” min_height=”” hide_on_mobile=”small-visibility,medium-visibility,large-visibility” class=”” id=”” background_color=”” background_image=”” background_position=”left top” background_repeat=”no-repeat” hover_type=”none” border_size=”0″ border_color=”” border_style=”solid” border_position=”all” padding_top=”” padding_right=”” padding_bottom=”” padding_left=”” dimension_margin=”” animation_type=”” animation_direction=”left” animation_speed=”0.3″ animation_offset=”” last=”no”][fusion_text columns=”” column_min_width=”” column_spacing=”” rule_style=”default” rule_size=”” rule_color=”” class=”” id=””]

“At MTM, we deploy the Goliath Application Availability Monitor as an advanced troubleshooting tool. GAAM’s automatic screenshots allow us to see a picture of the exact point at which the application launch failed, then ID and resolve the underlying problem that caused the application or infrastructure to be unavailable quickly, and we can share the images directly with customers, so they can see exactly what issue occurred and where.”
-Joe Byrne, Director of NOC Technologies, MTM Technologies

MTM Technologies, Inc., is a Citrix Service Provider and leading national provider of next-generation IT solutions and services to Global 2000, enterprise organizations, and mid-size companies. MTM is a National Platinum Citrix Partner and VMware Premier Partner. MTM, who maintains all four Citrix specializations, works with Citrix to assist companies with the demands of today’s mobile workforce. Whether on premise or in the cloud, by combining Citrix’s product suite with MTM’s branded professional and managed services enterprise, commercial and government organizations are provided a robust solution to serve their mobile workers their applications and data in a highly secure manner.

Click Here to see if Goliath can Power your Recurring revenue services business

The Customer’s Infrastructure: Citrix XenServer 6.5, Citrix XenApp, XenDesktop & Citrix NetScaler


The Business Challenge: Current Monitoring Vendor has Performance Visibility Gaps with Citrix XenServer, XenApp, XenDesktop, NetScaler, & End User Experience

As a Managed Service Provider (MSP), MTM Technologies designs SLAs that are unique to each customer but essentially focus on delivering a positive end user experience. MTM’s monitoring backbone to deliver these services had been Nimsoft for infrastructure and SolarWinds for the Network.

These are good tools but neither product offers purpose-built functionality for Citrix Monitoring and specifically the ability to proactively determine if there is a problem with Citrix Logon Initiation, Logon Duration or Session Performance.

Goal of Being Proactive

There are products that can tell MTM if something failed after the fact, but they needed something to give them advance warning before Citrix end users were impacted. MTM deemed it critical to use proactive Citrix Monitoring technology to ensure that performance-based SLAs were met when offering Remote Infrastructure Monitoring (RIM), Monitoring as a Service (MAAS)  and Desktop as a Service (DaaS).

Unsure of Root Cause of End User Experience Issues

MTM wanted absolute visibility and predictability in their Citrix Performance Monitoring for XenApp and especially around the Citrix End User Experience in situations where they were providing RIM, MaaS or delivering DaaS. Essentially, MTM needed advance notice and alerts when logon initiation failures or slowness occurred.

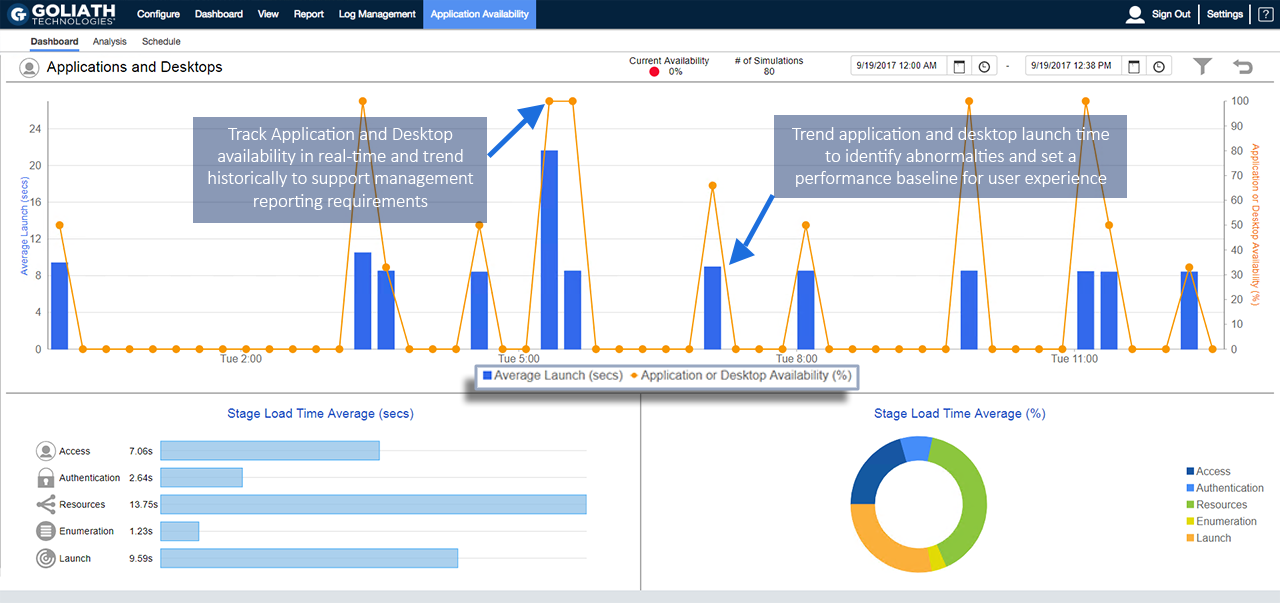
Then, if there was a failure or degradation of service, MTM needed the correlated data from the end point through the NetScalers and the backend Citrix delivery architecture to determine the root cause so they could deploy remediation actions. This required logon simulation alerting and logon duration analysis as depicted in the below real-time screen shot of the Goliath Application Availability Monitor.

Real-time Application Availability Dashboard

GAAM Application and Desktop Dashboard

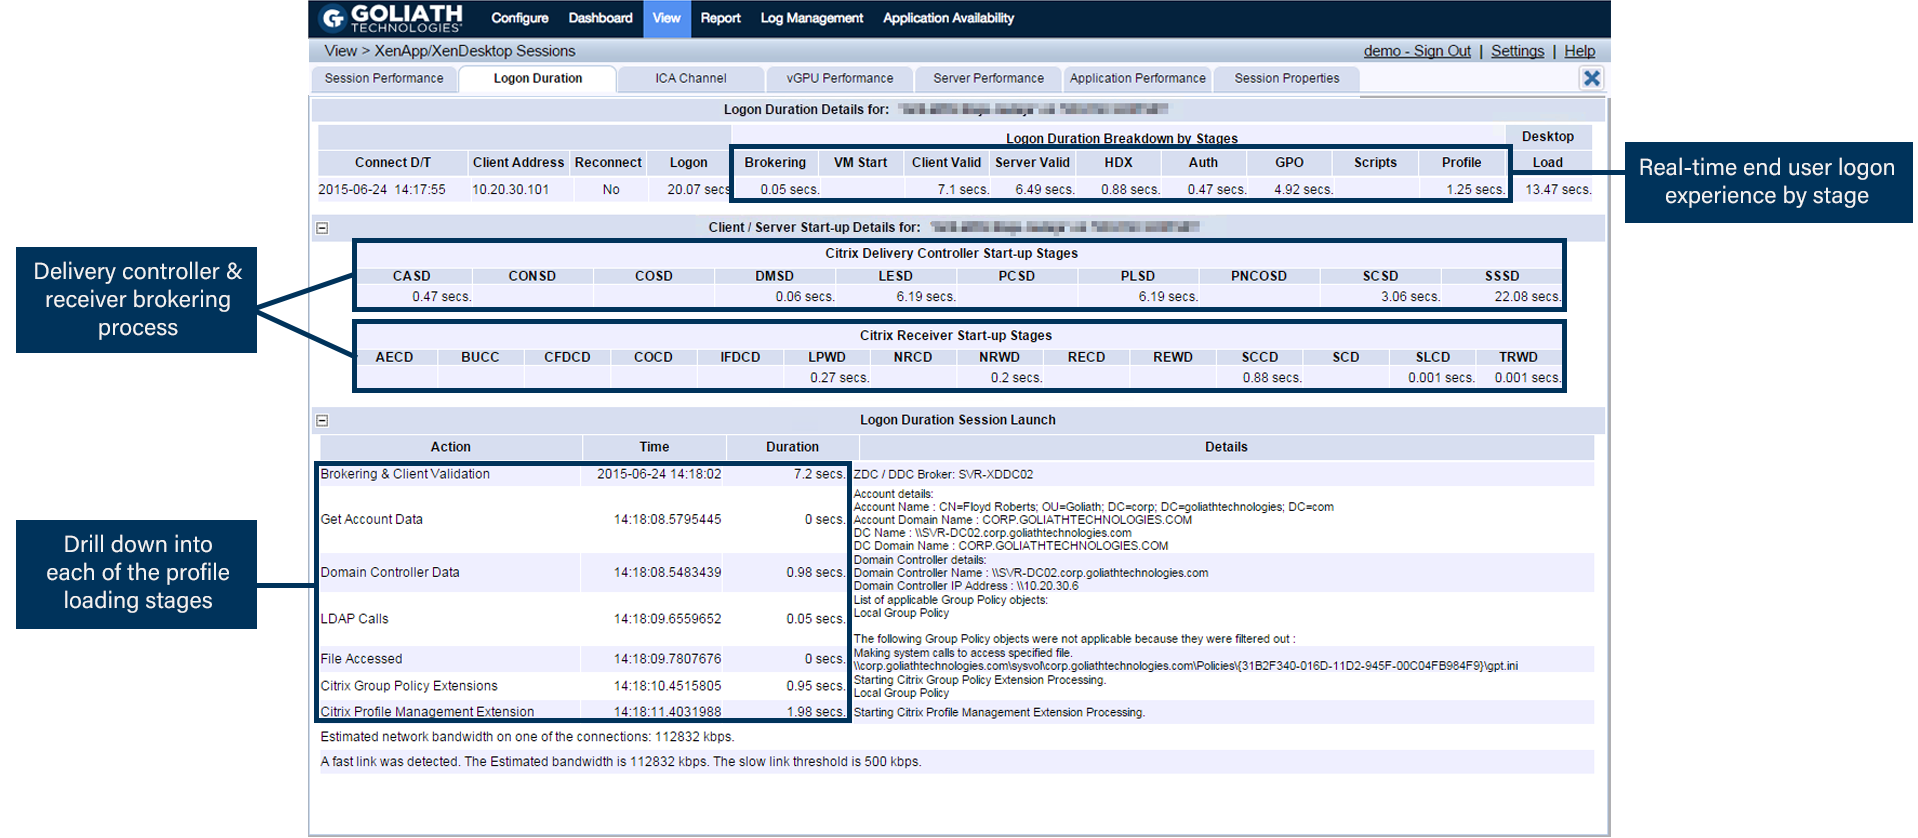
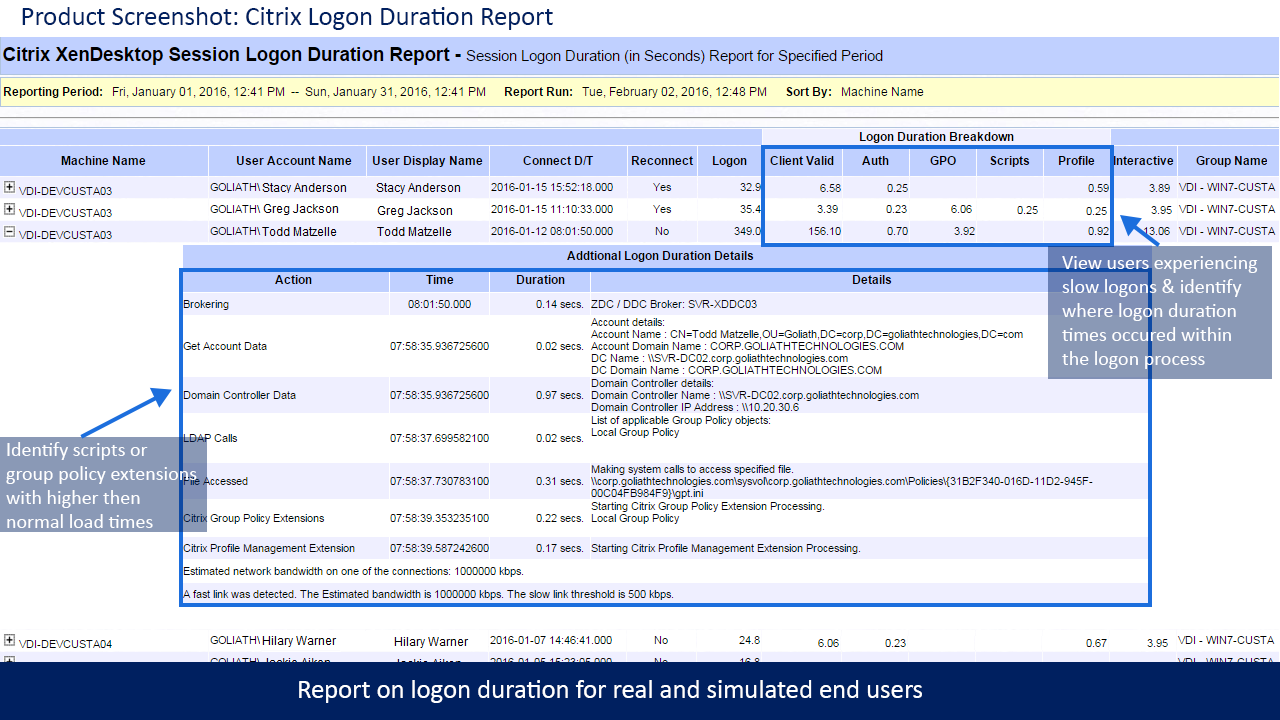
Many times the logon initiation process was successful but the logon process was sluggish. In this case, MTM used the logon duration drill down which dissects 33 different, though interrelated, steps in the logon process as depicted below. Armed with this logon duration detail MTM was able to pinpoint the true root cause of logon duration slowness and resolve the issue permanently—before end user performance is impacted.

Real-time Citrix Logon Duration Drill Down

GPM Citrix Logon Duration Drill down

“Citrix is Slow!” Alerts

With MTM supporting many customers and SLAs, some running over 2500 VDI sessions, they needed alerts for the ambiguous “Citrix is slow” complaint.

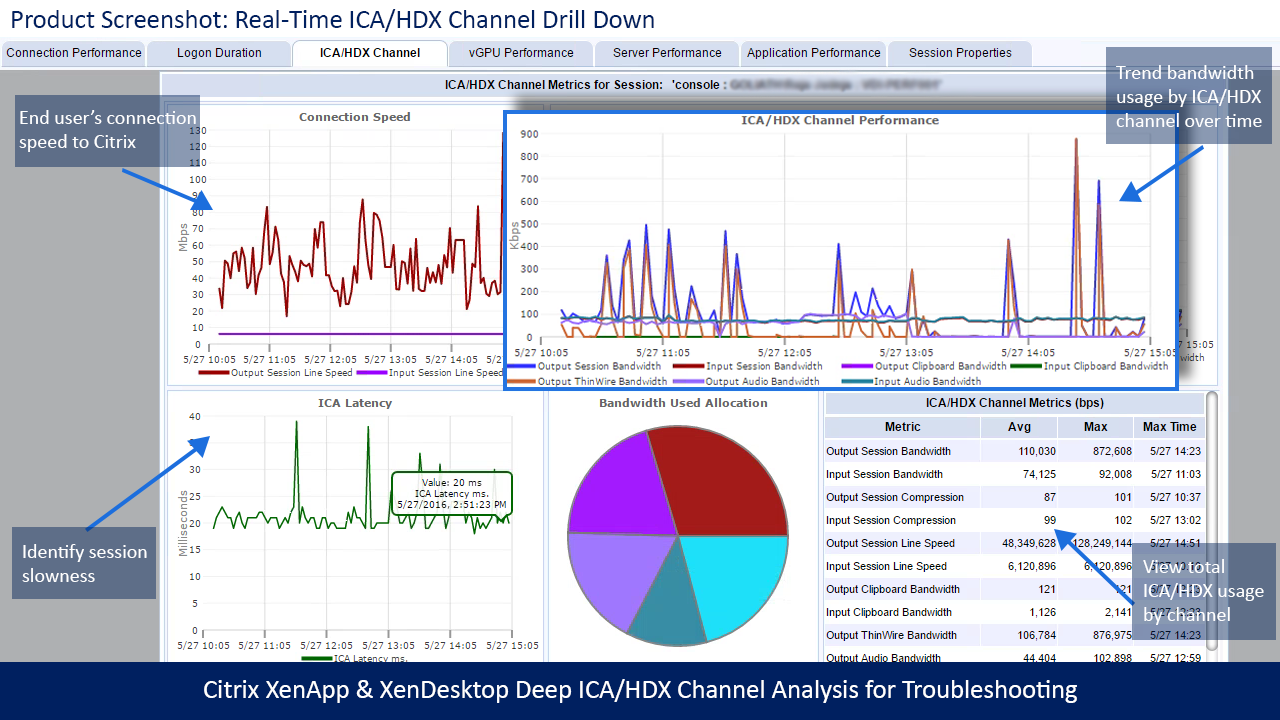
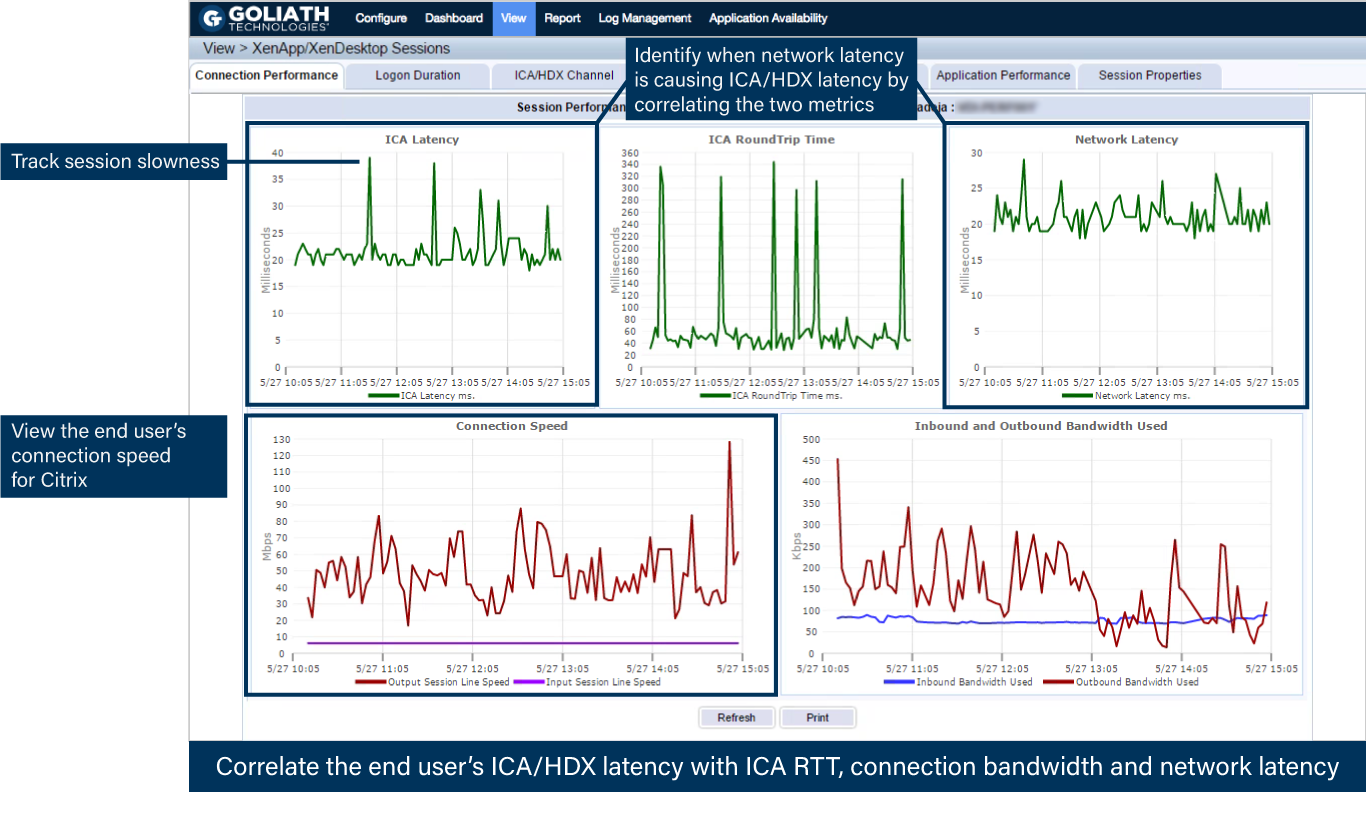
Citrix CSPs, and especially Citrix Administrators, know that Citrix gets the blame when performance issues arise, which is why comprehensive Citrix monitoring is critical. Often, the true culprit of session performance issues are some element in the supporting infrastructure. MTM’s other base requirement was to have the visibility into the entire Citrix delivery infrastructure by having two unique capabilities; one, a drill down into a specific Citrix user’s session and two, a break down of the HDX latency and session performance in real-time.

Real-time Citrix ICA/HDX Channel Drill Down

Citrix ICA/HDX Channel Drill Down

Real-time Citrix Session Performance Drill Down

Citrix Session Performance Drill Down

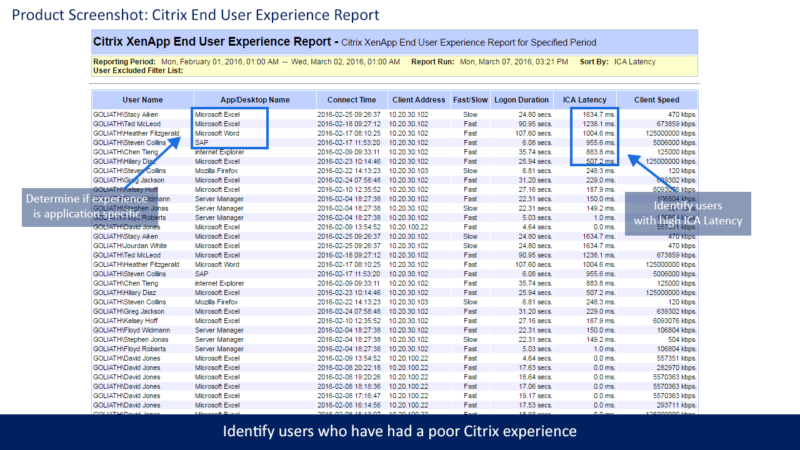
Finally, MTM needed to run historical reports and analysis to determine long-term performance trends because if they couldn’t see what happened, it would be impossible to be proactive. The requirement was to have the necessary reports available out-of-the-box. Armed with this data, MTM can customize Goliath’s Citrix Monitoring software to send threshold-based alerts and simultaneous remediation actions before end users are affected.

Citrix XenApp & XenDesktop End User Experience Report

XAXD End User Experience Report

Citrix XenApp & XenDesktop Logon Duration Report

XAXD Logon Duration Report

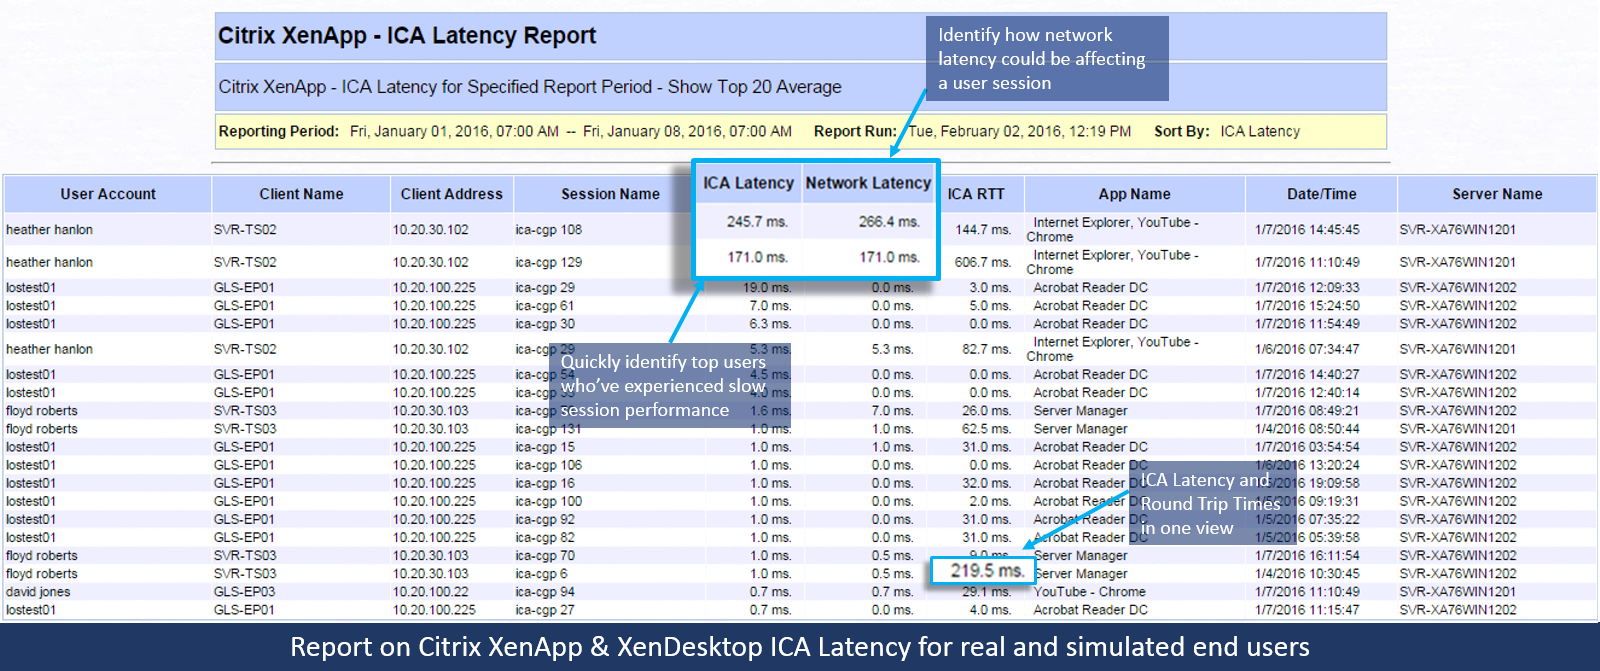
Citrix XenApp & XenDesktop ICA Latency Report

XAXD ICA Latency Report

Goliath has 66 of these types of performance and end user experience reports for Citrix and VMware, all of which come out-of-the-box with Goliath Performance Monitor.

The Solution: Choose a Proactive End-to-End Solution

Based on MTM’s criteria to proactively manage end user experience and satisfy their SLAs—ICA Latency, Logon Simulation, Logon Duration, and Session Performance—Goliath was the clear solution.

MTM chose Goliath Technologies Citrix Monitoring to solve visibility gaps, end user experience issues and meet SLAs, but there was more than just deep metrics that factored into their decision, which include:

  • Service Level Agreements: Goliath’s suite of proactive IT performance monitoring and management technology allows MTM to meet their SLAs.
  • Multi-tenancy: MSPs like MTM can use Goliath to proactively manage environments by criteria such as customer, location, application, infrastructure, etc.
  • Master “Intelligent” Agent: This is an ultra-low resource utilization (0.1% CPU) agent to monitor remote locations without maintaining an external connection. The “Intelligent” Agent gathers numerous metrics like the ICA/HDX Channel and the Hypervisor, and it can execute remediation actions on XenApp Servers, XenDesktop VDI, Citrix Role Servers, & End Points.
  • MSP Management: Centralized management of the end user experience for MSPs.
  • Share Data with other Tools: Can send data to Nimsoft, SolarWinds, etc.
  • Custom Reporting: Real-time dashboards and historical reports that are branded with MTM’s logo.

As you can see from the above screenshots, MTM is able to use Goliath Performance Monitor and the Goliath Application Availability Monitor for Citrix to gain complete visibility into the end users’ sessions, XenServer and XenDesktop performance data, and end user experience metrics in a single view.

With Goliath, MTM can trend utilization over time and see exactly what is happening with remote users to troubleshoot the root cause of performance issues and proactively deploy remediation actions to ensure a positive end user experience.

Further Reading

Goliath Performance Monitor for Citrix XenServer

Goliath Performance Monitor for Citrix XenApp & XenDesktop

Goliath Application Availability Monitor for Citrix

Independent Reviews of all Goliath Technologies’ Proactive IT Operations Software

[/fusion_text][/fusion_builder_column][/fusion_builder_row][/fusion_builder_container]

MTM Meets Customer SLAs with Goliath Technologies

MTM Hits End User Uptime SLAs with Goliath Technologies

MTM Meets Customer SLAs with Goliath

 
MTM Technologies Logo

“Goliath Technologies is the only truly proactive end-to-end monitoring and management solution for Citrix. Goliath provides deep metrics and analysis necessary for organizations to get ahead of issues in the three key areas that often cause pain for end users: logon initiation, logon duration and session performance.” 
– John Byrne, MTM Technologies Director of NOC Technologies

MTM Technologies, Inc., is a Citrix Service Provider and leading national provider of next-generation IT solutions and services to Global 2000, enterprise organizations, and mid-size companies. MTM is a National Platinum Citrix Partner and VMware Premier Partner. MTM, who maintains all four Citrix specializations, works with Citrix to assist companies with the demands of today’s mobile workforce. Whether on-premises or in the cloud, by combining Citrix’s product suite with MTM’s branded professional and managed services enterprise, commercial and government organizations are provided a robust solution to serve their mobile workers their applications and data in a highly secure manner.

The Customer’s Infrastructure: Citrix XenServer 6.5, Citrix XenApp, XenDesktop & Citrix NetScaler

The Business Challenge: Current Monitoring Vendor has Performance Visibility Gaps with Citrix XenServer, XenApp, XenDesktop, NetScaler, & End User Experience

As a Managed Service Provider (MSP), MTM Technologies designs SLAs that are unique to each customer but essentially focus on delivering a positive end user experience. MTM’s monitoring backbone to deliver these services had been Nimsoft for infrastructure and SolarWinds for the Network.

These are good tools but neither product offers purpose-built functionality for Citrix Monitoring and specifically the ability to proactively determine if there is a problem with Citrix Logon Initiation, Logon Duration or Session Performance.

Goal of Being Proactive

There are products that can tell MTM if something failed after the fact, but they needed something to give them advance warning before Citrix end users were impacted. MTM deemed it critical to use proactive Citrix Monitoring technology to ensure that performance based SLAs were met when offering Remote Infrastructure Monitoring (RIM), Monitoring as a Service (MAAS)  and Desktop as a Service (DaaS).  

Unsure of Root Cause of End User Experience Issues

MTM wanted absolute visibility and predictability in their Citrix Performance Monitoring for XenApp and especially around the Citrix End User Experience in situations where they were providing RIM, MaaS or delivering DaaS. Essentially, MTM needed advance notice and alerts when logon initiation failures or slowness occurred.

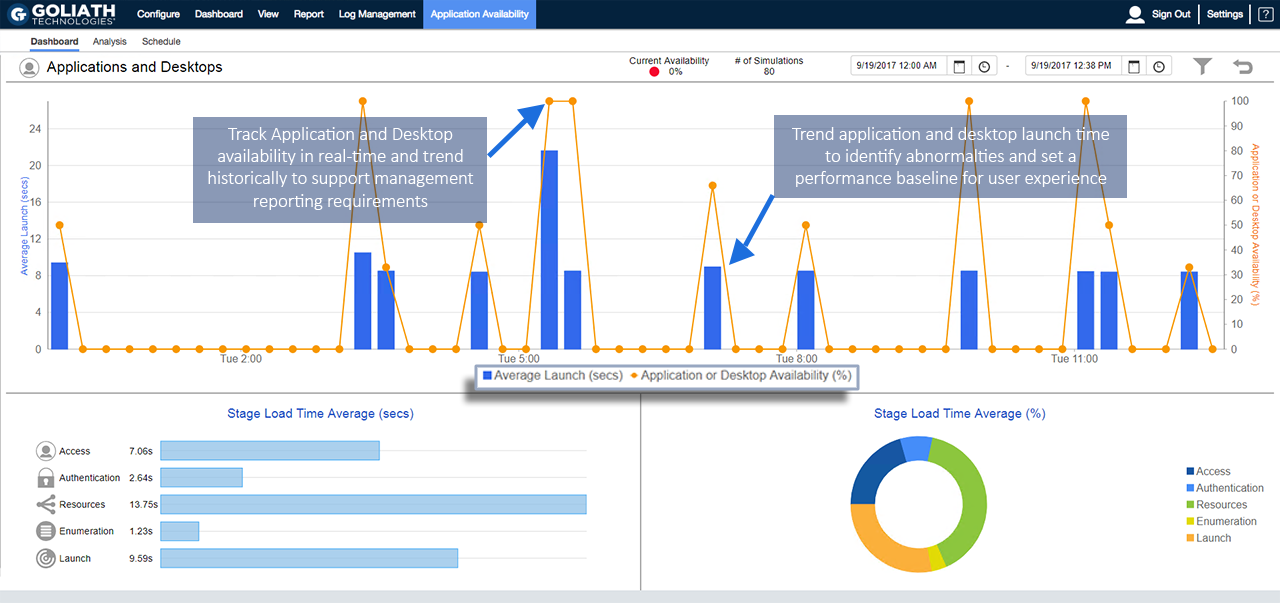
Then, if there was a failure or degradation of service, MTM needed the correlated data from the end point through the NetScalers and the backend Citrix delivery architecture to determine the root cause so they could deploy remediation actions. This required logon simulation alerting and logon duration analysis as depicted in the below real-time screen shot of the Goliath Application Availability Monitor. 

Real-time Application Availability Dashboard

GAAM Dashboard

Many times the logon initiation process was successful but the logon process was sluggish. In this case, MTM used the logon duration drill down which dissects 33 different, though interrelated, steps in the logon process as depicted below. Armed with this logon duration detail MTM was able to pinpoint the true root cause of logon duration slowness and resolve the issue permanently—before end user performance is impacted. 

Real-time Citrix Logon Duration Drill Down

GPM Citrix Logon Duration Drill Down

“Citrix is Slow!” Alerts

With MTM supporting many customers and SLAs, some running over 2500 VDI sessions, they needed alerts for the ambiguous “Citrix is slow” complaint.

Citrix CSPs, and especially Citrix Administrators, know that Citrix gets the blame when performance issues arise, which is why comprehensive Citrix monitoring is critical. Often, the true culprit of session performance issues are some element in the supporting infrastructure. MTM’s other base requirement was to have the visibility into the entire Citrix delivery infrastructure by having two unique capabilities; one, a drill down into a specific Citrix user’s session and two, a break down of the HDX latency and session performance in real-time.

Real-time Citrix ICA/HDX Channel Drill Down

Citrix ICA/HDX Channel Drill Down

Real-time Citrix Session Performance Drill Down

Citrix Session Performance Drill Down

Finally, MTM needed to run historical reports and analysis to determine long-term performance trends because if they couldn’t see what happened, it would be impossible to be proactive. The requirement was to have the necessary reports available out-of-the-box. Armed with this data, MTM can customize Goliath’s Citrix Monitoring software to send threshold-based alerts and simultaneous remediation actions before end users are affected. 

Citrix XenApp & XenDesktop End User Experience Report

XAXD End User Experience Report

Citrix XenApp & XenDesktop Logon Duration Report

XAXD Logon Duration Report

Citrix XenApp & XenDesktop ICA Latency Report

Goliath has 66 of these types of performance and end user experience reports for Citrix and VMware, all of which come out-of-the-box with Goliath Performance Monitor.

The Solution: Choose a Proactive End-to-End Solution  

Based on MTM’s criteria to proactively manage end user experience and satisfy their SLAs—ICA Latency, Logon Simulation, Logon Duration, and Session Performance—Goliath was the clear solution.  

MTM chose Goliath Technologies Citrix Monitoring to solve visibility gaps, end user experience issues and meet SLAs, but there was more than just deep metrics that factored into their decision, which include:

  • Service Level Agreements: Goliath’s suite of proactive IT performance monitoring and management technology allows MTM to meet their SLAs.
  • Multi-tenancy: MSPs like MTM can use Goliath to proactively manage environments by criteria such as customer, location, application, infrastructure, etc.
  • Master “Intelligent” Agent: This is an ultra-low resource utilization (0.1% CPU) agent to monitor remote locations without maintaining an external connection. The “Intelligent” Agent gathers numerous metrics like the ICA/HDX Channel and the Hypervisor, and it can execute remediation actions on XenApp Servers, XenDesktop VDI, Citrix Role Servers, & End Points.
  • MSP Management: Centralized management of the end user experience for MSPs.
  • Share Data with other Tools: Can send data to Nimsoft, SolarWinds, etc.
  • Custom Reporting: Real-time dashboards and historical reports that are branded with MTM’s logo.

As you can see from the above screenshots, MTM is able to use Goliath Performance Monitor and the Goliath Application Availability Monitor for Citrix to gain complete visibility into the end users’ sessions, XenServer and XenDesktop performance data, and end user experience metrics in a single view.

With Goliath, MTM can trend utilization over time and see exactly what is happening with remote users to troubleshoot the root cause of performance issues and proactively deploy remediation actions to ensure a positive end user experience.

product discussions for MSPs promotion

User Story: CDK Global’s vSphere Performance Monitoring Product Selection Process

User Story: CDK Global’s vSphere Performance Monitoring Product Selection Process

User Story: CDK Global’s vSphere Performance Monitoring Product Selection Process

We wanted a product that was very competitively priced, had great flexibility, a vast host of features and was easy to implement and manage. We found it in Goliath Performance Monitor.

Mike Musgrove, Product Development Consultant, CDK Global, a hosting division of ADP Dealer Services UK Limited


The Business Challenge

I was tasked with evaluating and testing various products for monitoring our complex IT infrastructure. We needed better visibility into VMware server performance so that we could increasingly anticipate potential performance issues, and if they did occur, we needed to then be able to automate immediate fix actions.

There were a number of key requirements:

  1. The solution must cover a wide variety of platform servers because, here at ADP Dealer Services, we use a wide variety of operating systems such as UNIX, UnixWare, AIX, Microsoft and various forms of Linux servers all on VMware platforms.
  2. The product must have the same functionality for both physical and virtual environments.
  3. Additional requirements were ease of use, flexibility of installation and deployment on the various platforms we maintain, easy management and the flexibility to be able to run self-healing programs and scripts to automatically rectify problems without the need for user intervention.

The Solution

I evaluated many different products at various price ranges. The exhaustive evaluation included, but wasn’t limited to, HP Openview, Solarwinds, Nagios and Kaseya. The decision to choose Goliath Performance Monitor was made for the following reasons:

VMware Monitoring Rules

  1. Ease of configuration. Goliath Performance Monitor comes with hundreds of pre-configured watches that makes it very easy to set up and begin monitoring.
  2. We also found that Goliath Performance Monitor offered us the ability to run or schedule reports on WMI objects enabling us to not only monitor for faults, but also to detect and tune systems for peak performance and detect where bottleneck or performance issues were occurring automatically. This is especially useful for intermittent faults as these can be brought to our attention without the need to log on to a suspect server and waste time watching for events or problems
  3. The capability of managing our VMware servers with either an agent or agentless solution offered great flexibility. It is easy to capture key metrics from the virtual machine, host or hypervisor.
  4. Comprehensive reports and interactive alert screens offered real time visibility into the performance of our VMware server farms.
  5. The Goliath Performance Monitor’s “intelligent agent” allows one agent at a remote site, behind the firewall, to be designated a “master agent” and receives alerts from all the other agents deployed at that site. The intelligent agent will then send status and alerts back through the firewall to the remote Goliath Performance Monitor server. This made monitoring our remote locations very easy and efficient from a resource and management perspective.

The Results

We are now monitoring over our VMware environment of 1700 servers both in our data centers and on customers’ remote sites. We can automatically log calls on our own bespoke call control system and allocate engineers to rectify problems on servers, sometimes even before the customer is aware that a problem exists. All the statistics from Goliath Performance Monitor are fed directly to our Extranet to allow customers to view in real time the status of their own servers.
Obviously, with the quantity of servers we have, it was crucial that we had access to vendor support should a problem come to light. Support is something Goliath Technologies, takes very seriously! Solutions to queries on the product or features were quickly responded to and rectified, or an enhancement was added in a very professional and timely way.

We wanted a product that was very competitively priced, had great flexibility, a vast host of features and was easy to implement and manage. We found it in Goliath Performance Monitor.

St. Luke’s University Hospital Reduced Support Tickets by 25%

St. Luke’s University Hospital Reduced Support Tickets by 25%

St. Luke’s University Health Network

St. Luke’s University Health Network Dropped Epic Support Tickets by 25%

User Story Banner

“Goliath Performance Monitor was able to identify several issues within my infrastructure and none of them were due to Citrix. After we were able to resolve the issues identified by Goliath, we saw a drop in the number of tier 1 support tickets and, after one month of using the technology, we were able to drop tier 1 support tickets by 25%.”

– Chad Brisendine, CIO of St. Luke’s University Health Network

Infrastructure

Citrix XenApp, Epic


Challenge

Consistent and Constant Availability

Ensuring that 9,000+ employees at St. Luke’s who deliver quality care to their patients have a reliable and consistent user experience; coupled with aligning the Citrix delivery infrastructure to St. Luke’s.

Solution

Chad Brisendine, CIO at St. Luke’s University Health Network, and his team evaluated multiple monitoring solutions. After contacting Goliath Technologies about their fully-supported, 30-day free trial of the Goliath Performance Monitor (GPM), Chad started collecting data from over 400 Citrix XenApp servers. GPM was set up and configured within 24 hours and Chad immediately started receiving real-time alerts and daily performance reports. What was most important to Chad was that, not only did the daily reports detail errors and faults, they pinpointed where in the infrastructure problems were occurring and their frequency. The first report isolated the root cause to the print drivers on multiple servers, which were installed and configured incorrectly.


St. Lukes

Chad and his team then discovered that end users were having trouble launching their published applications. With GPM’s real-time event log display, they found there were several errors stemming from the Web Interface trying to connect to the SQL database.


St. Lukes pic 2

The errors shown from the real-time display shows the Data Store on the SQL server was unavailable and causing all incoming connections to fail. Chad and his team were then able to restart the SQL server and bring SQL back online, all without having to guess and check each of the role servers in the farm.

Results

Citrix XenApp was being blamed for issues related to print drivers being installed and configured incorrectly. By utilizing Goliath Performance Monitor’s daily reports and real-time alerts and Event Log Management dashboard, Chad was able drop support tickets by 25%.

St. Luke's Hospital & Health Network

ABOUT SLUHN

St. Luke’s University Health Network (SLUHN) is a non-profit, regional, integrated network based in northeast Pennsylvania. SLUHN is comprised of six acute care hospitals. The tertiary hub, St. Luke’s University Hospital, is a teaching hospital based in Bethlehem. Additional hospital campuses are located in Allentown, Quakertown, Coaldale, and Easton, as well as a New Jersey-based campus in Philipsburg. The network is comprised of over 1,400 physicians and provides out-patient services at over 150 locations. Areas of exceptional medical expertise include oncology, heart/vascular, neuroscience, orthopaedics and an adult level I trauma center.

Headquarters location: Bethlehem, Pennsylvania
Founded: 1872
Employees: 18 000+
Industry: Healthcare